
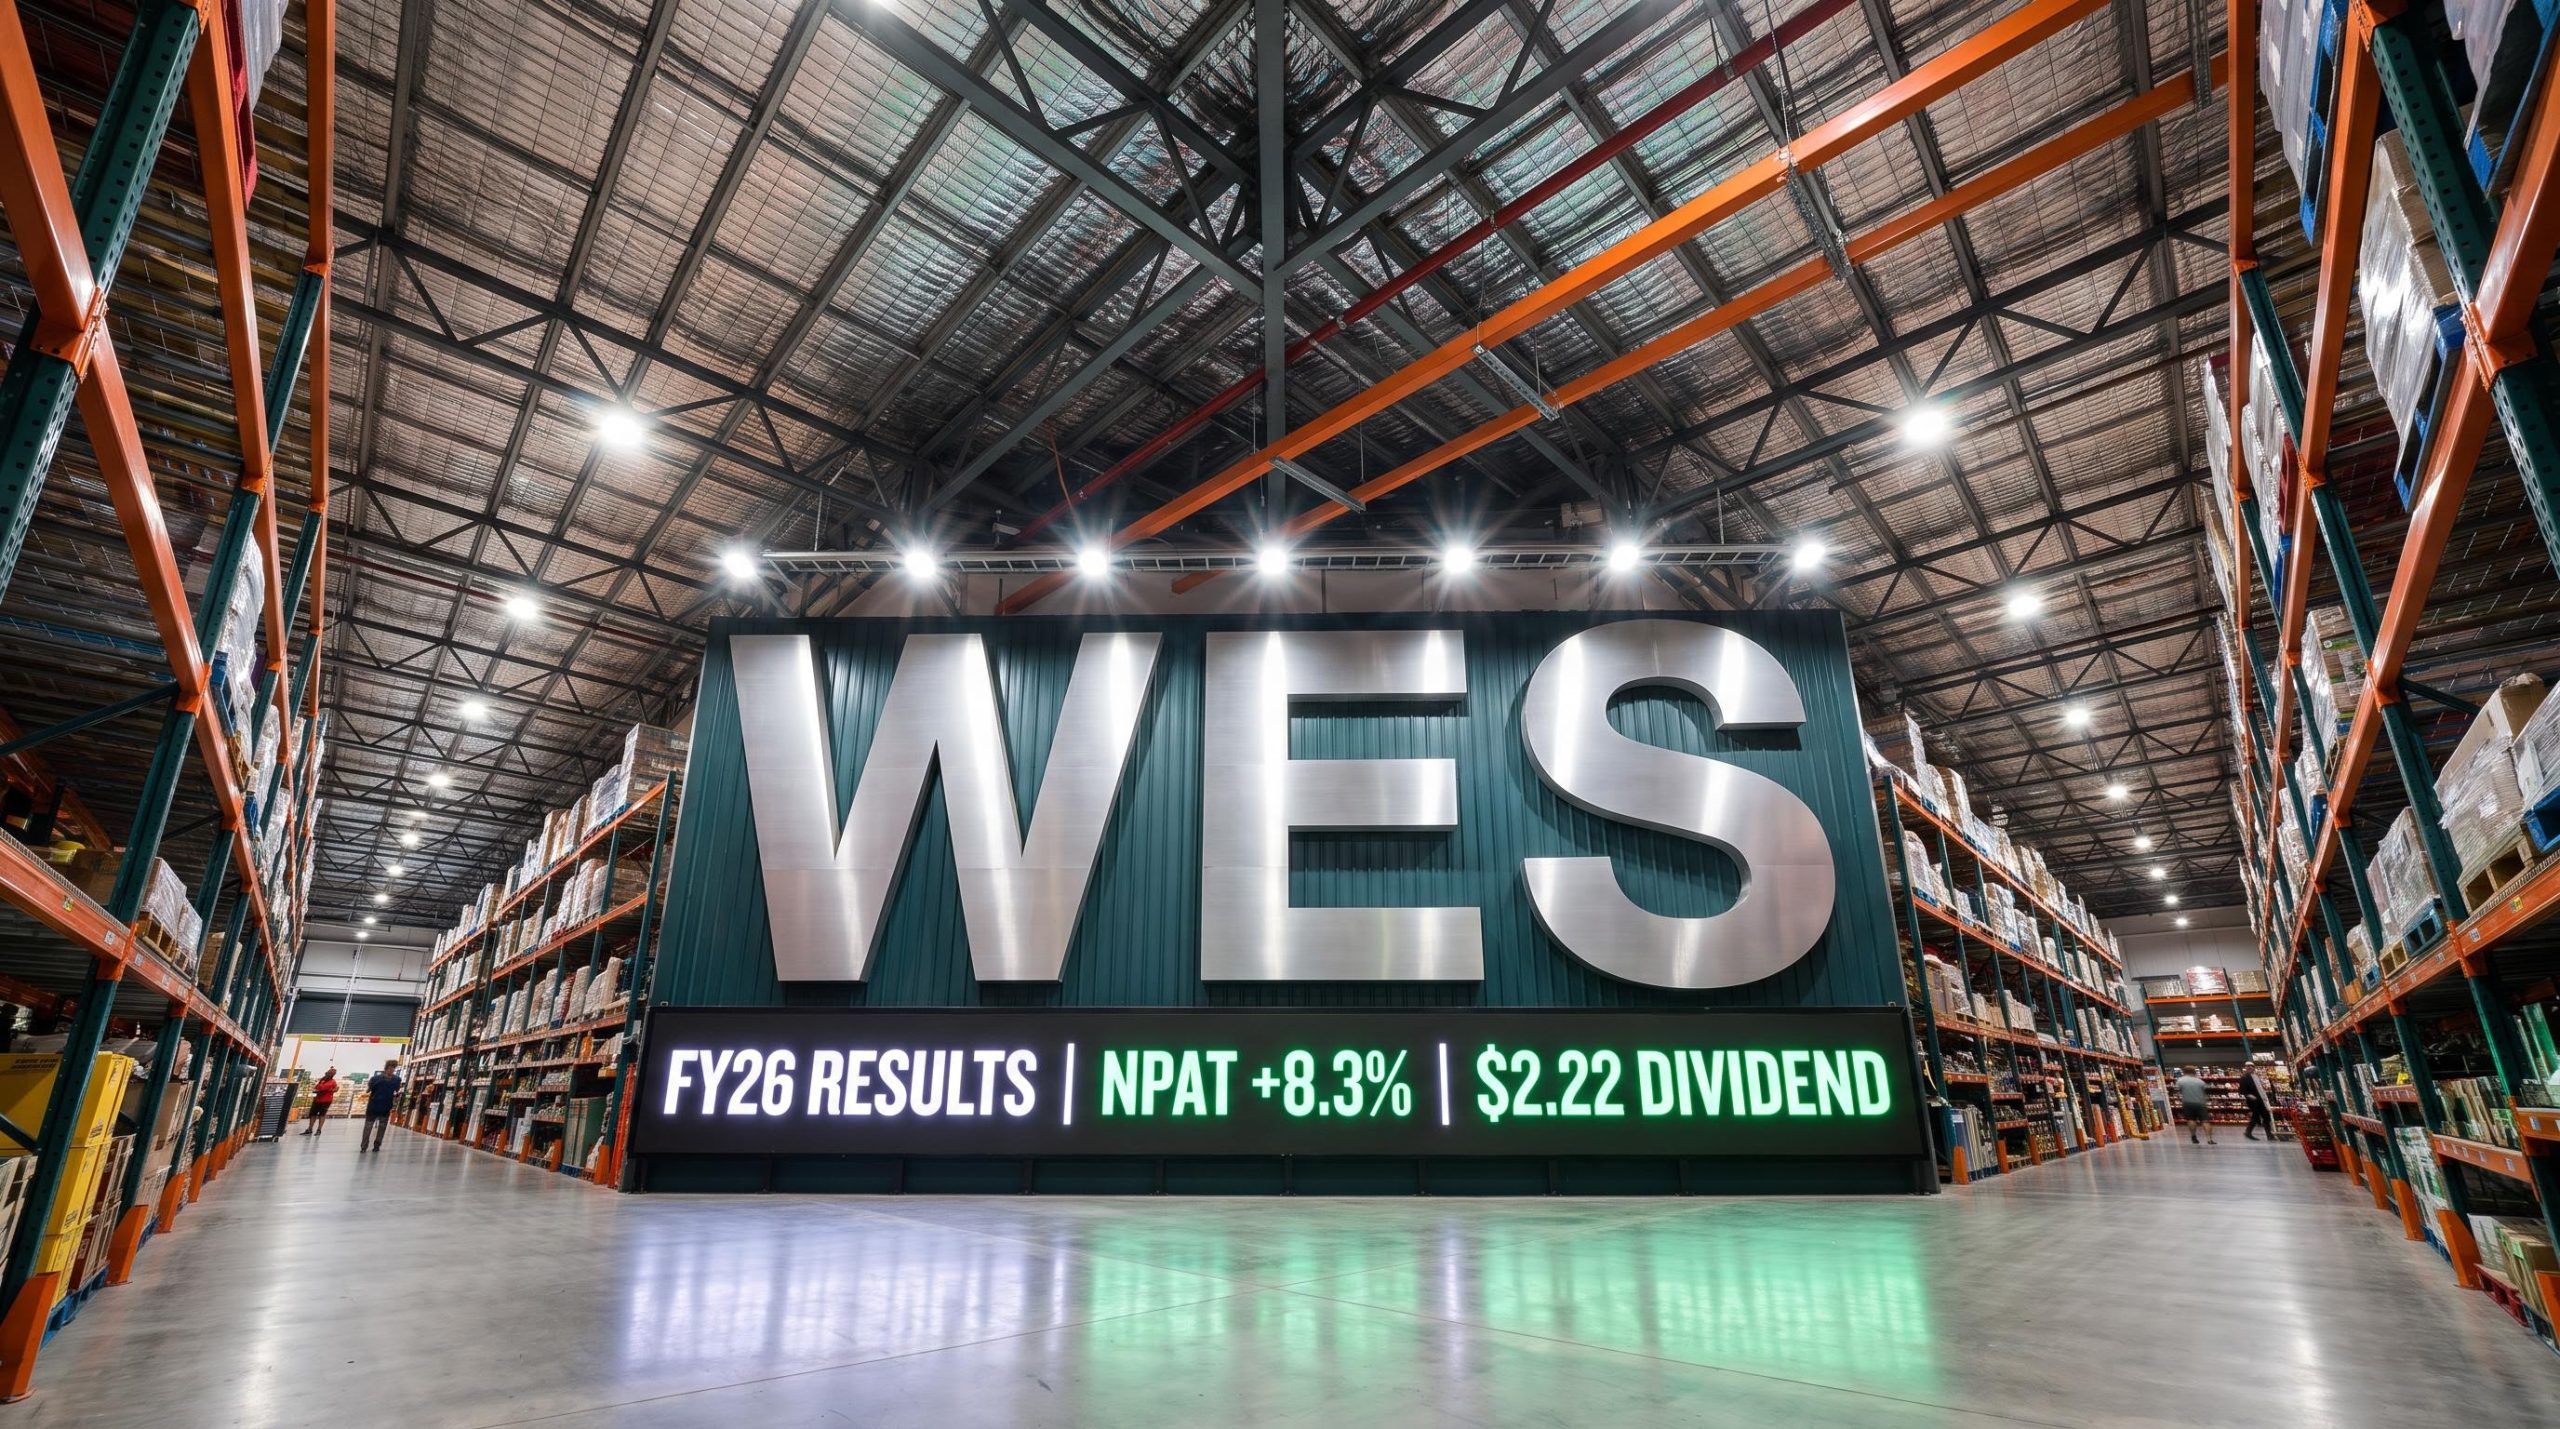
Wesfarmers delivers 8.3% profit lift and $2.22 dividend in FY26 results
In its 2026 full-year results briefing delivered to investors on 27 August 2026, Wesfarmers outlined a set of full-year results showing profit growth and a lifted dividend for the 12 months ended 30 June 2026, against a consumer backdrop management described as resilient but pressured by cost-of-living headwinds.
Managing Director Rob Scott and Chief Financial Officer Anthony Gianotti presented the result, emphasising portfolio quality and disciplined execution across the Group’s diversified businesses.
The headline figures point to steady momentum in the conglomerate’s largest divisions.
- Revenue up 3.4% to $47.3b
- NPAT (excluding significant items) up 8.3% to $2.9b
- Full-year ordinary dividend up 7.8% to $2.22 per share
- Return on equity of 35.5%
When big ASX news breaks, our subscribers know first
FY26 financial performance in focus
The presentation detailed group net profit after tax excluding significant items of $2,874m, up 8.3% on the prior year, with revenue climbing to $47,274m. Earnings per share on the same basis rose 8.3% to 253.4 cents.
Operating cash flows softened 6.5% to $4,272m. Management attributed this to deliberate inventory decisions rather than any deterioration in fundamentals. WesCEF held additional fertiliser inventory at elevated prices, while Health increased inventory contingency, both to protect customer availability amid supply disruption arising from the conflict in the Middle East.
Despite lower operating cash flow, free cash flows rose 15.8% to $3,992m. The presentation explained this offset came from proceeds on the sale of Coregas and the sale and leaseback of seven properties following the wind-up of the BPI structure.
| Metric | FY26 | FY25 | Var % |
|---|---|---|---|
| Revenue ($m) | 47,274 | 45,700 | 3.4 |
| NPAT ex. sig. items ($m) | 2,874 | 2,653 | 8.3 |
| Operating cash flows ($m) | 4,272 | 4,568 | (6.5) |
| Free cash flows ($m) | 3,992 | 3,446 | 15.8 |
| EPS ex. sig. items (cps) | 253.4 | 234.0 | 8.3 |
| Ordinary dividend (cps) | 222 | 206 | 7.8 |
Management commentary
Result highlights the quality of the Group’s businesses and teams, Rob Scott noted in the briefing, pointing to strong earnings contributions from the three largest divisions.
Dividend and capital returns
Shareholder returns featured prominently in the briefing. The presentation detailed a fully-franked ordinary final dividend of $1.20 per share, taking the full-year fully-franked ordinary dividend to $2.22 per share.
Separately, and distinct from the ordinary dividend, the Group paid a $1.50 per share capital management distribution in December 2025. This comprised a capital return of $1.10 per share and a fully-franked special dividend of $0.40 per share, approved by shareholders at the Annual General Meeting on 30 October 2025.
Key dividend details from the briefing include:
- Ordinary final dividend: $1.20 per share, fully franked
- Full-year ordinary dividend: $2.22 per share, fully franked
- Dividend record date: 2 September 2026
- Dividend payable: 7 October 2026
How the divisions performed
Management outlined a result driven by the three largest earnings contributors, Bunnings Group, Kmart Group and WesCEF, all of which performed strongly.
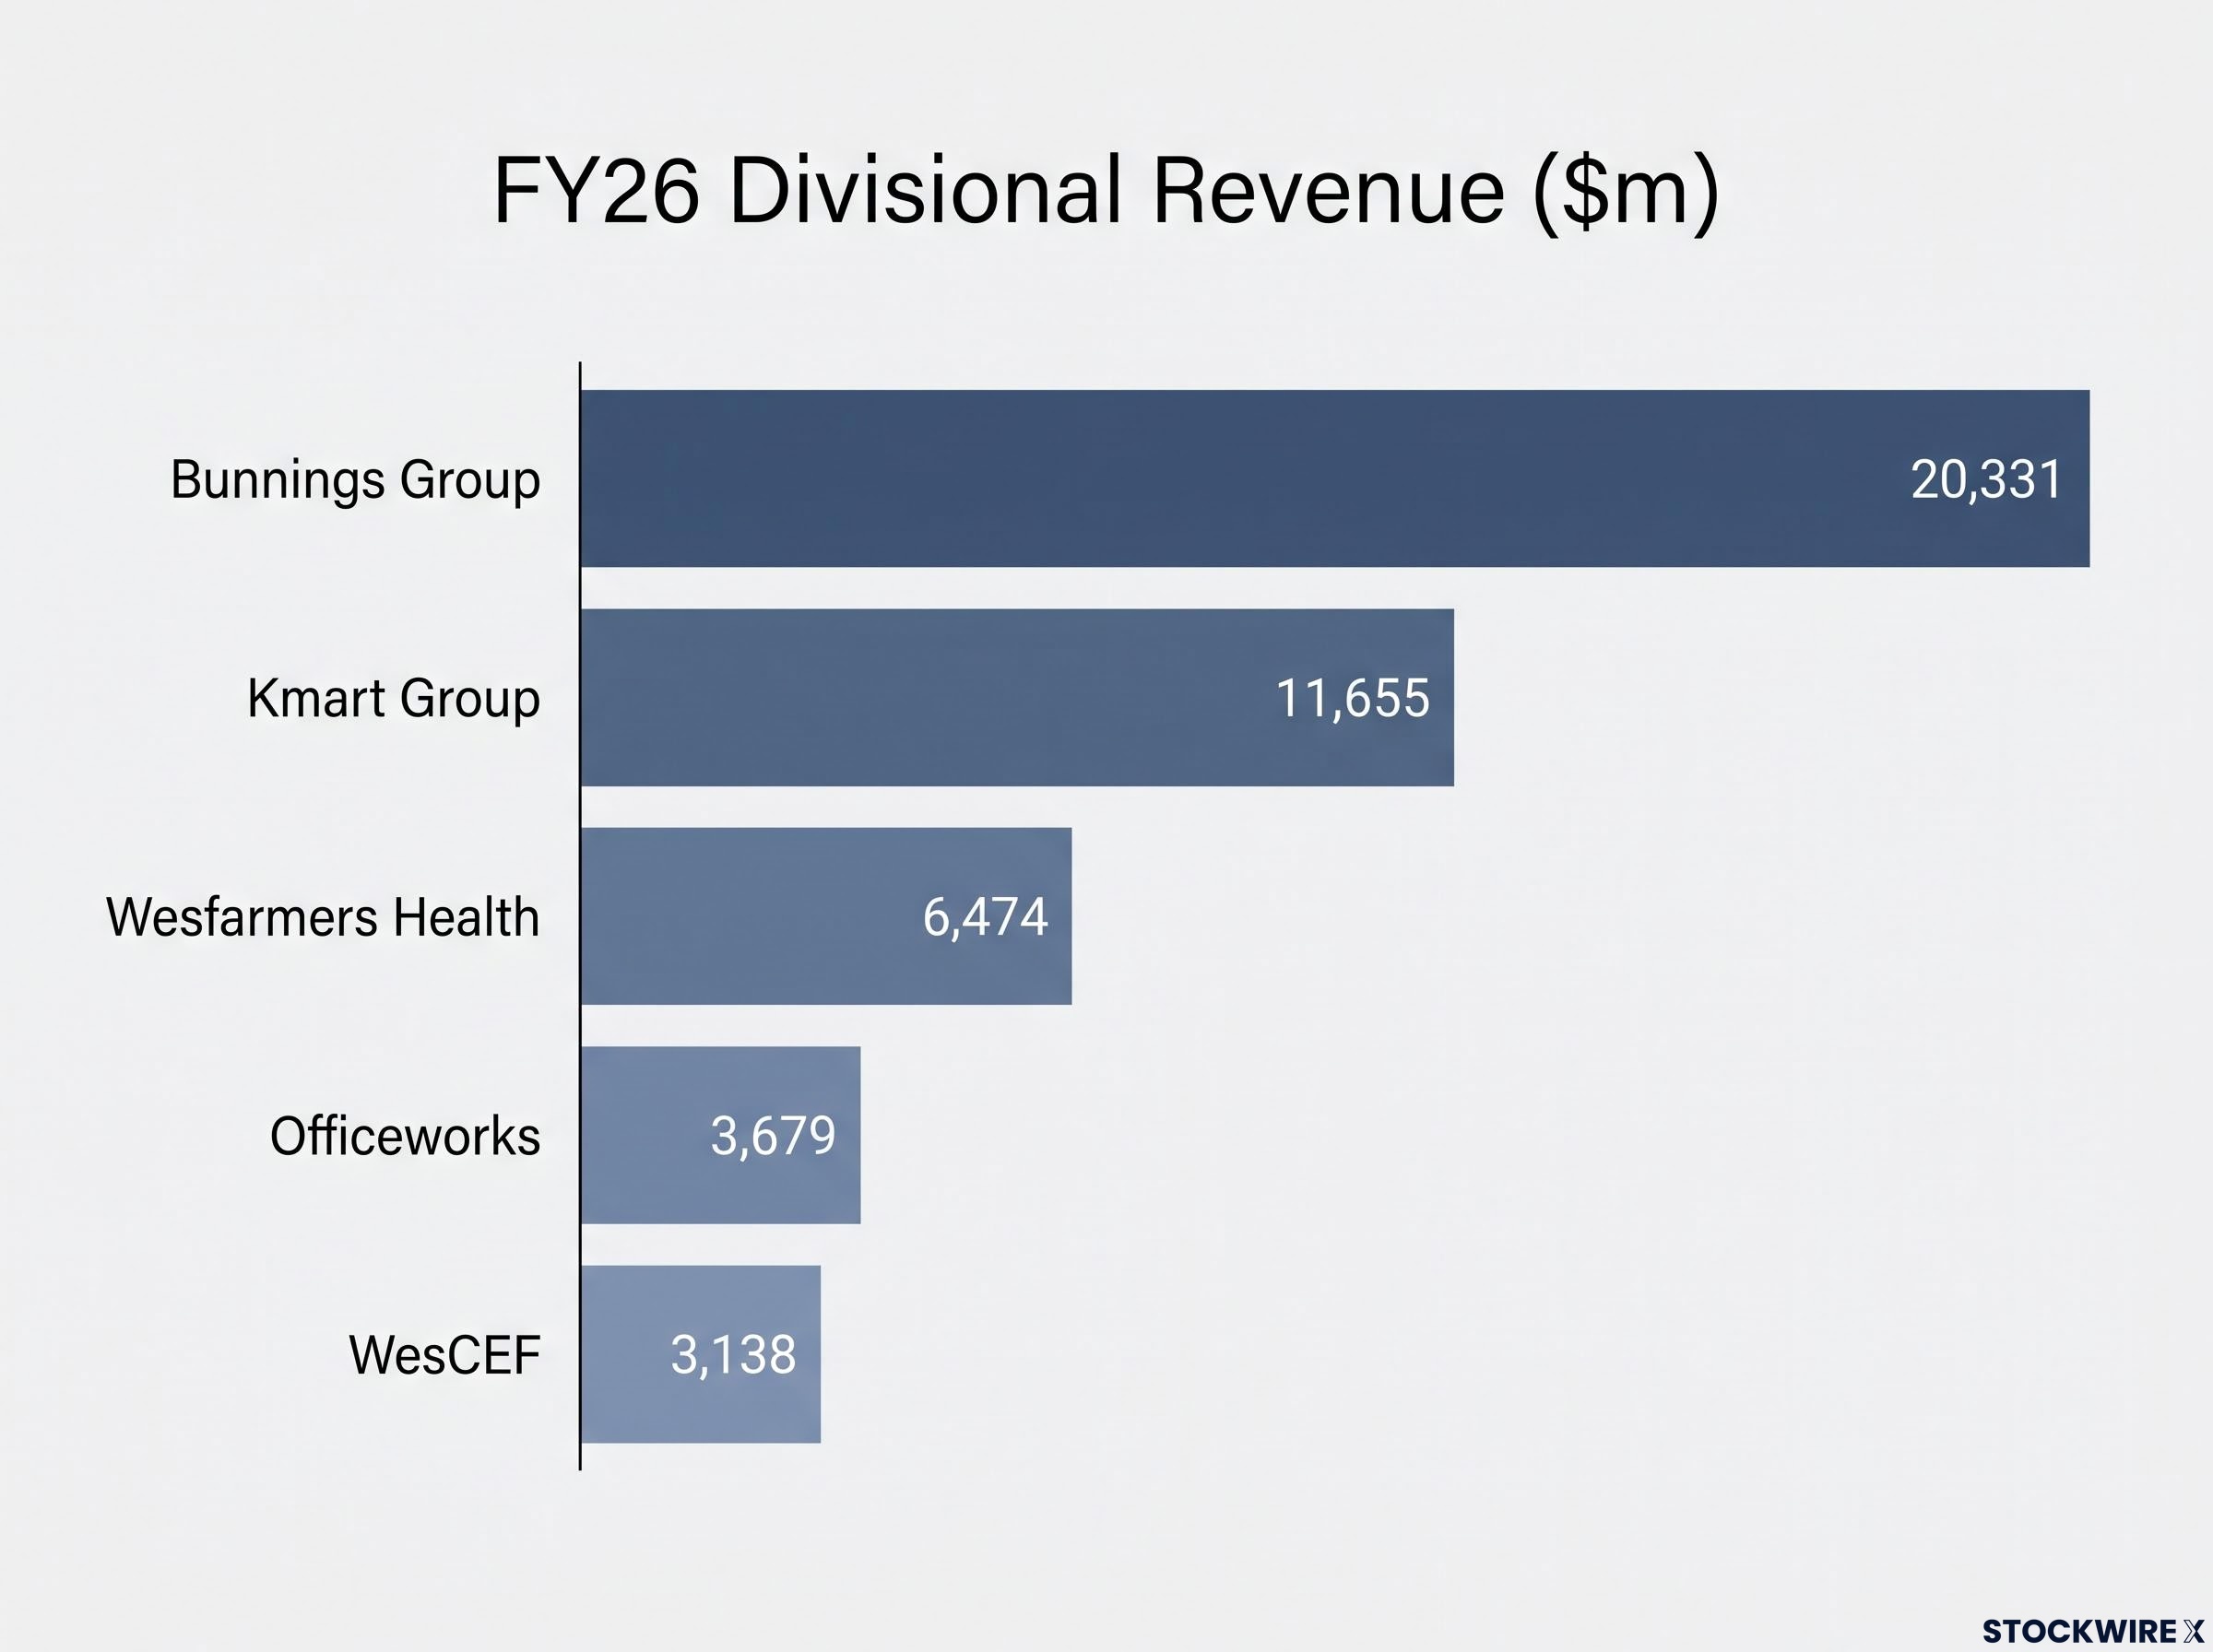
| Division | FY26 ($m) | FY25 ($m) | Growth % |
|---|---|---|---|
| Bunnings Group | 20,331 | 19,560 | 3.9 |
| Kmart Group | 11,655 | 11,341 | 2.8 |
| Officeworks | 3,679 | 3,547 | 3.7 |
| WesCEF | 3,138 | 2,962 | 5.9 |
| Wesfarmers Health | 6,474 | 5,933 | 9.1 |
Bunnings lifted earnings before tax 5.0% to $2,455m (excluding property), with a return on capital of 69.2%, supported by its lowest-price positioning for cost-conscious customers.
Kmart grew earnings before tax 6.0% to $1,109m, dropping prices on more than 2,500 items while digital sales increased 19.7% in the second half.
WesCEF delivered an 18.5% earnings uplift to $473m. The lithium business swung to a $40m profit from a $59m loss a year earlier, aided by spodumene concentrate production above nameplate capacity and the first LiOH product achieved with its joint venture partner.
Wesfarmers Health grew revenue 9.1% and earnings before tax 18.8%, with Priceline Pharmacy headline network sales up 12.7%.
Officeworks earnings declined 22.2% to $165m, which the presentation attributed to roughly $40m in transformation costs rather than structural decline. Management indicated FY27 earnings are expected to show a meaningful improvement as a lower cost base takes effect.
The briefing also noted Wesfarmers became the first retail group in Australia to deploy Google Cloud’s agentic AI Shopping Agent across multiple brands.
Understanding Wesfarmers’ conglomerate model
Wesfarmers operates as a diversified conglomerate, meaning it owns businesses across unrelated sectors including home improvement, discount retail, chemicals and lithium, and health. Because these markets respond differently to economic conditions, earnings from one area can help smooth performance when another faces headwinds, reducing reliance on any single sector.
The FY26 result illustrates this in action. Resilient retail earnings combined with an upswing in lithium to deliver group profit growth, even as chemicals earnings decreased compared to the prior year. Return on equity of 35.5% measures how efficiently the company converts shareholder equity into profit, and a figure at this level is notable, indicating the Group generated substantial earnings relative to the capital shareholders have invested.
Balance sheet strength and growth investment
Net financial debt rose to $5.3b at 30 June 2026 from $4.2b a year earlier. The presentation attributed the increase largely to the $1.7b capital management distribution paid in December 2025, rather than operational stress.
Debt to EBITDA stood at 1.9x, with credit ratings maintained at Moody’s A3 and S&P A-, both on a stable outlook. In July 2026, S&P revised the Group’s downside threshold upwards to a 3.0x debt-to-EBITDA ratio from 2.75x, increasing debt headroom at the current rating and expanding capacity for growth investment. Gross capital expenditure totalled $1,194m with net capital expenditure of $779m.
Management outlined a growth pipeline spanning both retail and industrial platforms:
- Mt Holland expansion — a Final Investment Decision was announced to double nameplate spodumene concentrate production to c.760ktpa (WesCEF share c.380ktpa), with first product targeted for CY30.
- Covalent Lithium refinery ramp-up, with production rates expected to accelerate through 2H27 as further odour mitigation solutions are implemented.
- Sodium cyanide expansion expected to complete in 1H27, increasing capacity by c.35ktpa.
- Group retail media network scaling, with more than 1,500 in-store screens, alongside new Kmart and Bunnings marketplaces.
- Built Living JV to deliver residential apartments at scale through advanced manufacturing, with establishment subject to certain consents and approvals.
Outlook: positioned to deliver through the cycle
Management’s outlook balanced portfolio resilience against acknowledged pressures. The briefing noted Australian consumer demand remains resilient, though cost-of-living pressures continue to be felt across the economy and higher costs of doing business weigh on business confidence.
For the first seven weeks of FY27, the presentation reported Bunnings sales growth slightly stronger than 2H26, assisted by unseasonably dry weather in July, Kmart Group sales growth in line with 2H26, and Officeworks maintaining positive growth slightly below 2H26.
The Group guided to FY27 net capital expenditure of between $1,300m and $1,500m, inclusive of around $200m relating to the Mt Holland expansion. Management highlighted that recent investments across lithium, retail media, health and housing create earnings opportunities independent of the near-term consumer cycle.
Closing the outlook, management pointed to the Group’s ‘People-first, Digitally-enabled’ productivity agenda and a strong, flexible balance sheet as providing the capacity to manage a range of potential risks and opportunities over the long term.
Investors exploring the longer-term investment thesis behind the Group’s capital allocation priorities will find our deep-dive into Wesfarmers’ 2026 Strategy Briefing covers the divisional return targets, the digital marketplace build-out across Bunnings and Kmart, and the decade-long shareholder returns track record that underpins management’s compounding credentials.
Don’t Miss the Next ASX Consumer Sector Winner
Get FREE breaking ASX news delivered to your inbox within minutes of release, complete with in-depth analysis already done for you. Join 20,000+ subscribers staying ahead of the market on consumer, retail, and beyond. Click the “Free Alerts” button at Big News Blast to start receiving alerts the moment market-moving announcements hit the ASX.