

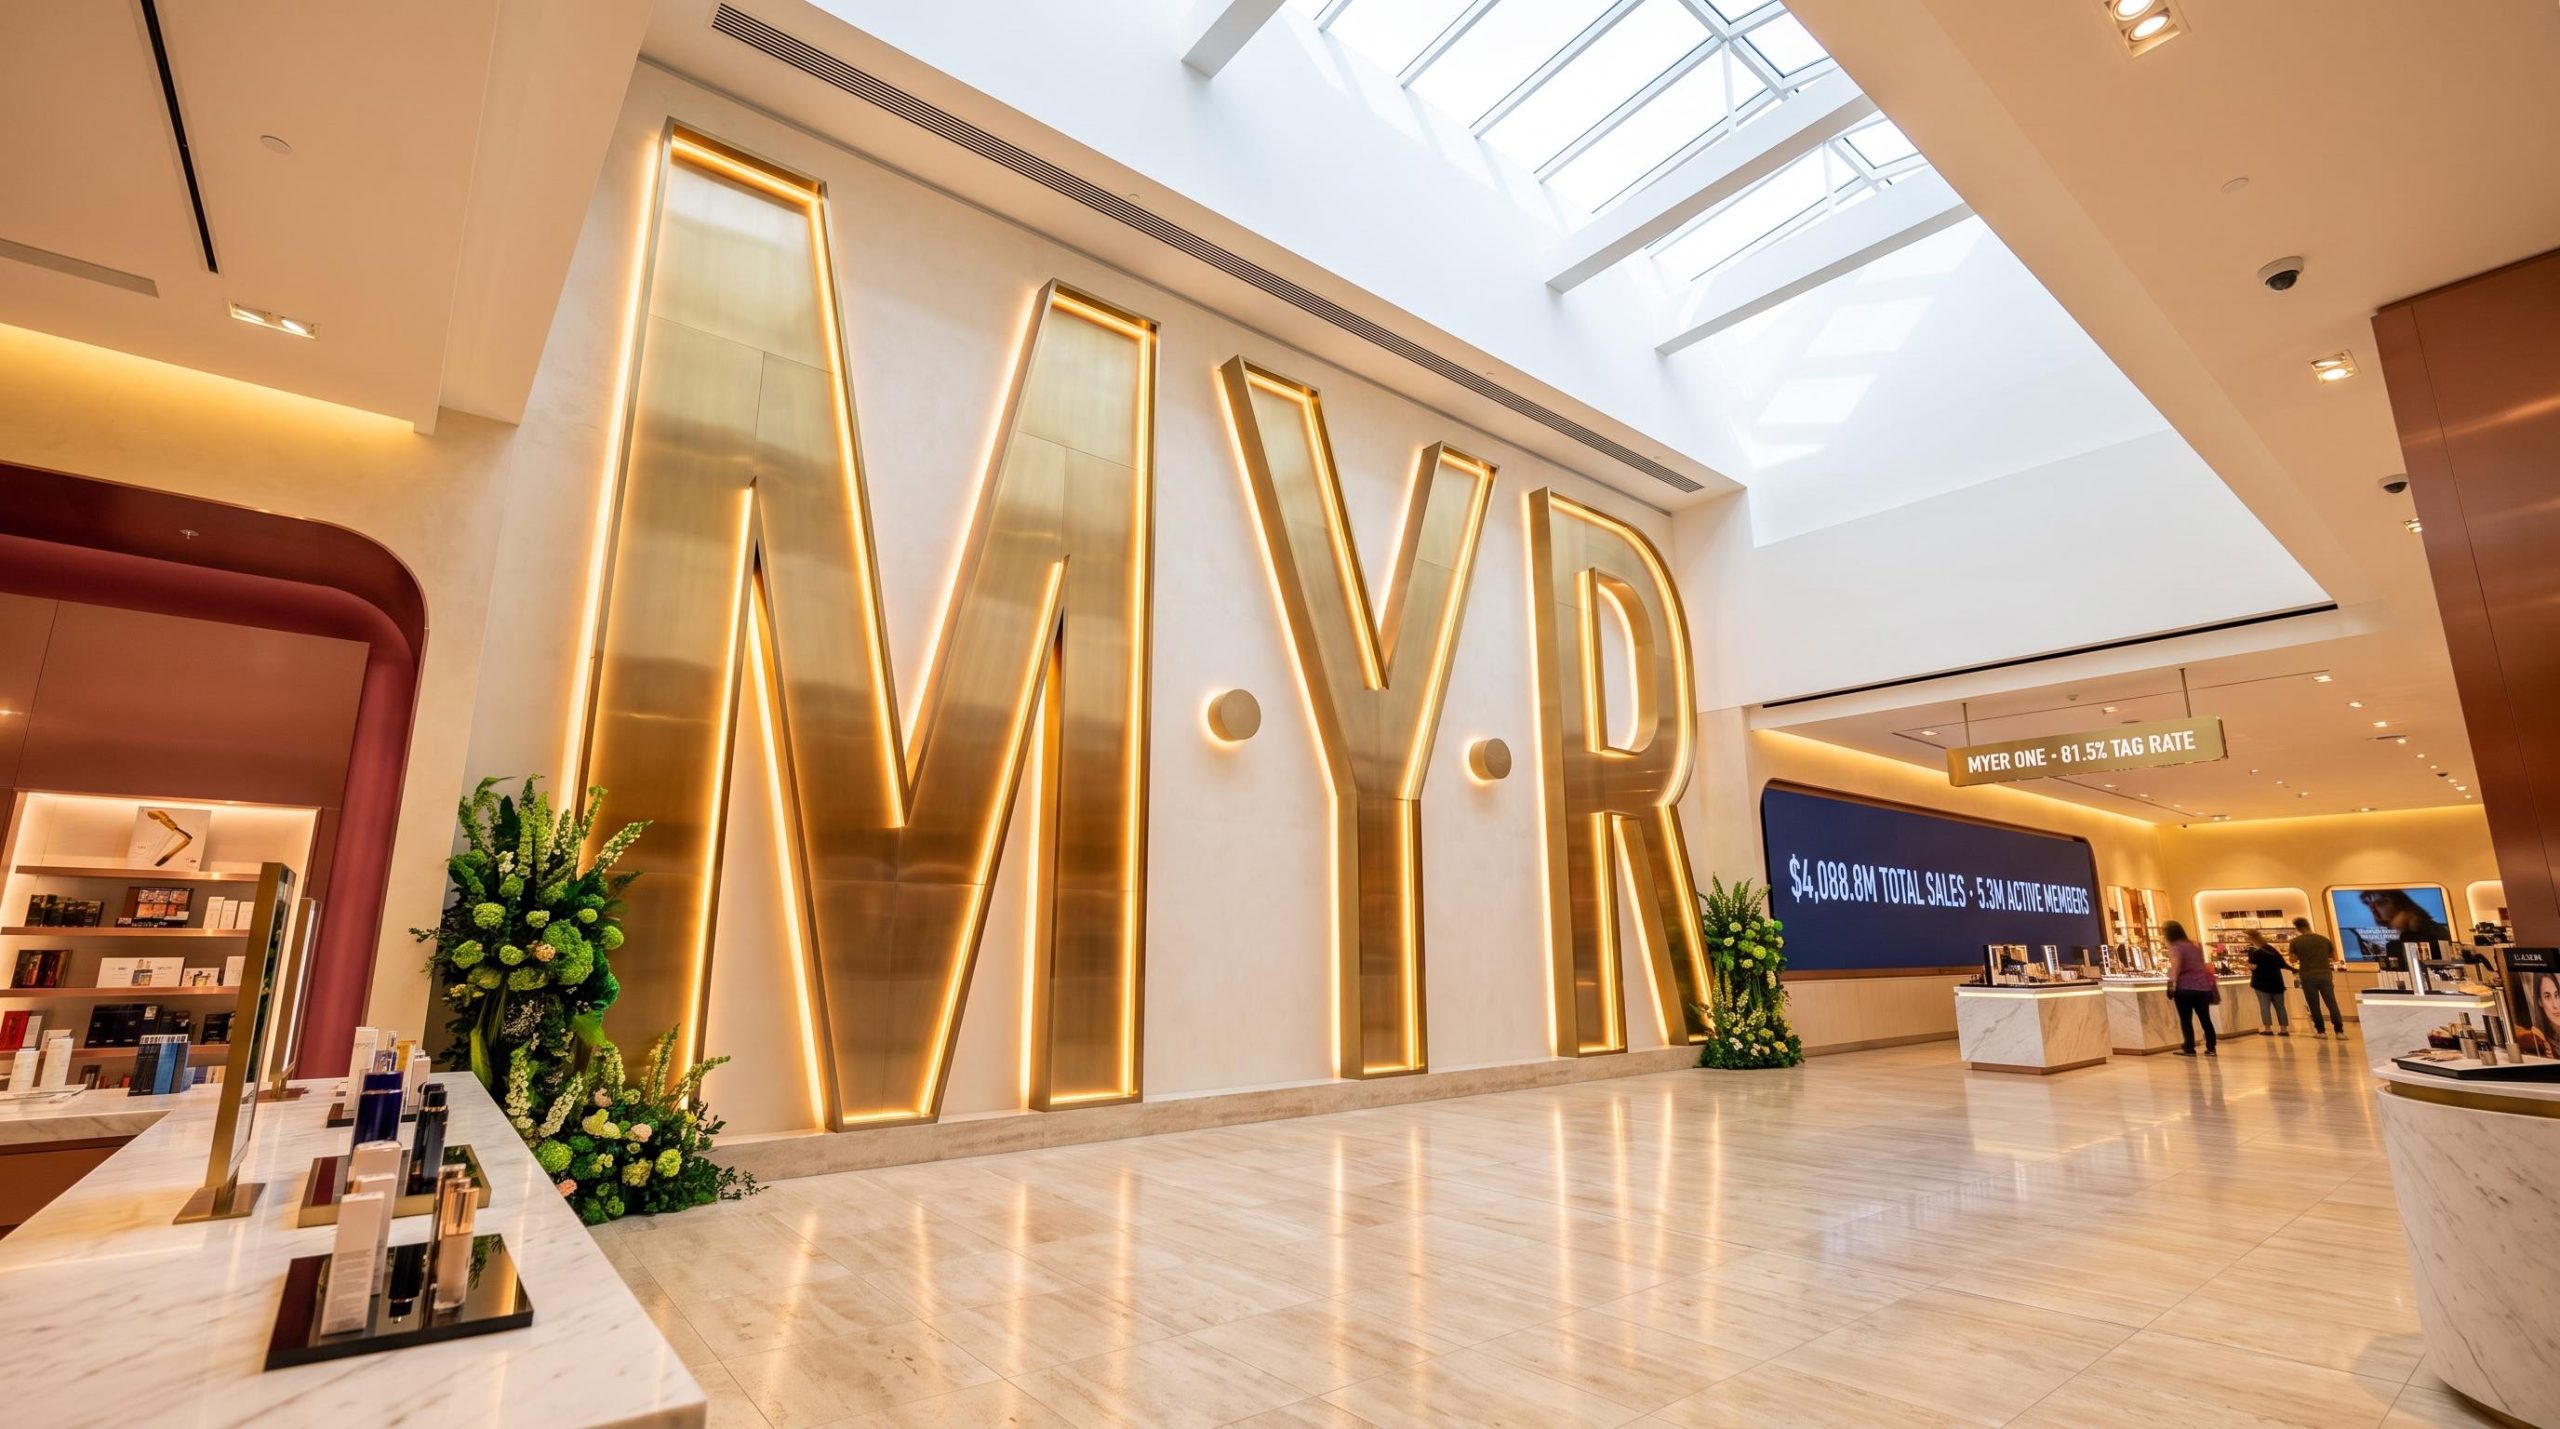
In its FY26 results presentation, Myer Holdings Limited reported total sales of $4,088.8 million for the 52 weeks ended 25 July 2026, up 11.3% on an actual basis and 0.3% on a pro forma basis, with comparable sales growth of 0.7%. The result reflected a year of meaningful strategic progress alongside a materially tougher second half, as cost-of-living pressures, three CY26 interest rate increases, a warmer-than-average winter, and fuel price impacts from the Middle East conflict weighed heavily on consumer sentiment.
Underlying EBIT came in at $139.4 million, down 7.0% on an actual basis and 23.5% on a pro forma basis, while underlying NPAT of $42.5 million was 2.9% lower on an actual basis and 32.1% lower on a pro forma basis. A $279.6 million one-off, non-cash post-tax impairment charge (relating to goodwill, brand intangibles, and store impairment) drove a statutory NPAT of $(276.5) million. Investors should note that this impairment is a non-cash item and does not reflect the group’s underlying trading performance.
The Myer 1H26 results, reported in March 2026, showed underlying NPAT of $51.7 million and a net cash position of $287 million, providing the stronger first-half base against which the second-half deterioration in FY26 is most clearly measured.
The balance sheet remained solid. Myer held a net cash position of $100.1 million as at 25 July 2026, and $200 million in undrawn debt facilities as at 22 September 2026, following an increase and extension of facilities. No final dividend was declared; a fully franked interim dividend of 1.5 cents per share was paid in May 2026, representing a payout ratio of 60% for FY26.
FY26 financial performance summary
| Metric | FY26 | Actual Change | Pro Forma Change |
|---|---|---|---|
| Total Sales | $4,088.8m | ▲ 11.3% | ▲ 0.3% |
| Operating Gross Profit | $1,603.2m | ▲ 14.0% | ▼ 1.6% |
| CODB % | 29.1% | In line with FY26 target of ~29% | |
| Underlying EBITDA | $413.5m | ▲ 7.9% | ▼ 12.1% |
| Underlying EBIT | $139.4m | ▼ 7.0% | ▼ 23.5% |
| Underlying NPAT | $42.5m (2.5 cps) | ▼ 2.9% | ▼ 32.1% |
| Statutory NPAT | $(276.5m) ((16.0) cps) | ▼ 35.3% | n.m. |
| Net Cash | $100.1m | ||
| Dividend | No final dividend; fully franked interim of 1.5 cps paid May 2026 | Payout ratio 60% |
When big ASX news breaks, our subscribers know first
How the Myer Group growth strategy played out in FY26
The presentation detailed management’s account of strategic execution across four pillars during the year: Customer and Loyalty, Products and Brands, Omni-channel Network, and Sourcing and Supply Chain.
Loyalty and customer engagement hit records
The MYER one loyalty programme delivered standout results in FY26, with several metrics reaching record levels.
- MYER one tag rate in Myer Retail reached a record 81.5% (FY25: 79.5%)
- MYER one tag rate in Myer Apparel Brands reached 55.1%, less than 12 months since launch
- Active members grew to a record 5.3 million (FY25: 4.7 million)
- A Retail Media business was launched, powered by the MYER one platform
Brands, stores and the omni-channel push
The presentation highlighted a broad programme of brand and network activity across the year.
- 36 new brands launched in Beauty; 31 across Womenswear and Menswear
- Global brand access secured, including Fenty Beauty, La Mer, Guerlain, and GAP
- 38 Myer Apparel Brands stores closed; 14 opened as part of network rationalisation
- New Marketplace platform launched June 2026, with Marketplace sales up 5.8%
- Refurbishment of Myer Sydney City beauty hall and Myer Morley (Perth) commenced
- Online sales grew 9.1% on an actual basis
Synergies and value creation delivered
Management highlighted three streams of financial benefit delivered during FY26.
- Approximately $20 million in synergies delivered from the Myer Apparel Brands integration
- SBMDL (sass & bide, Marcs and David Lawrence) integration completed, with approximately $10 million in annualised synergies expected from FY27
- Approximately $17 million in benefits delivered from the Value Creation programme, through initiatives including closure of the Myer Asia sourcing office, closure of an overseas hub, and optimisation of staffing flexibility
- CODB held in line with the FY26 target of approximately 29% of total sales
Understanding Myer’s two-segment structure
Myer now reports across two operating segments: Myer Retail and Myer Apparel Brands. For investors assessing the group’s true performance, understanding both the “actual” and “pro forma” comparisons is important.
The FY25 actual result included only six months of Myer Apparel Brands (following its mid-year acquisition), whereas FY26 reflects a full 12 months. This means the actual basis comparison overstates the growth contribution from the Apparel Brands segment. The pro forma comparison, which restates FY25 to include 12 months of Myer Apparel Brands, provides the more meaningful like-for-like measure of segment performance.
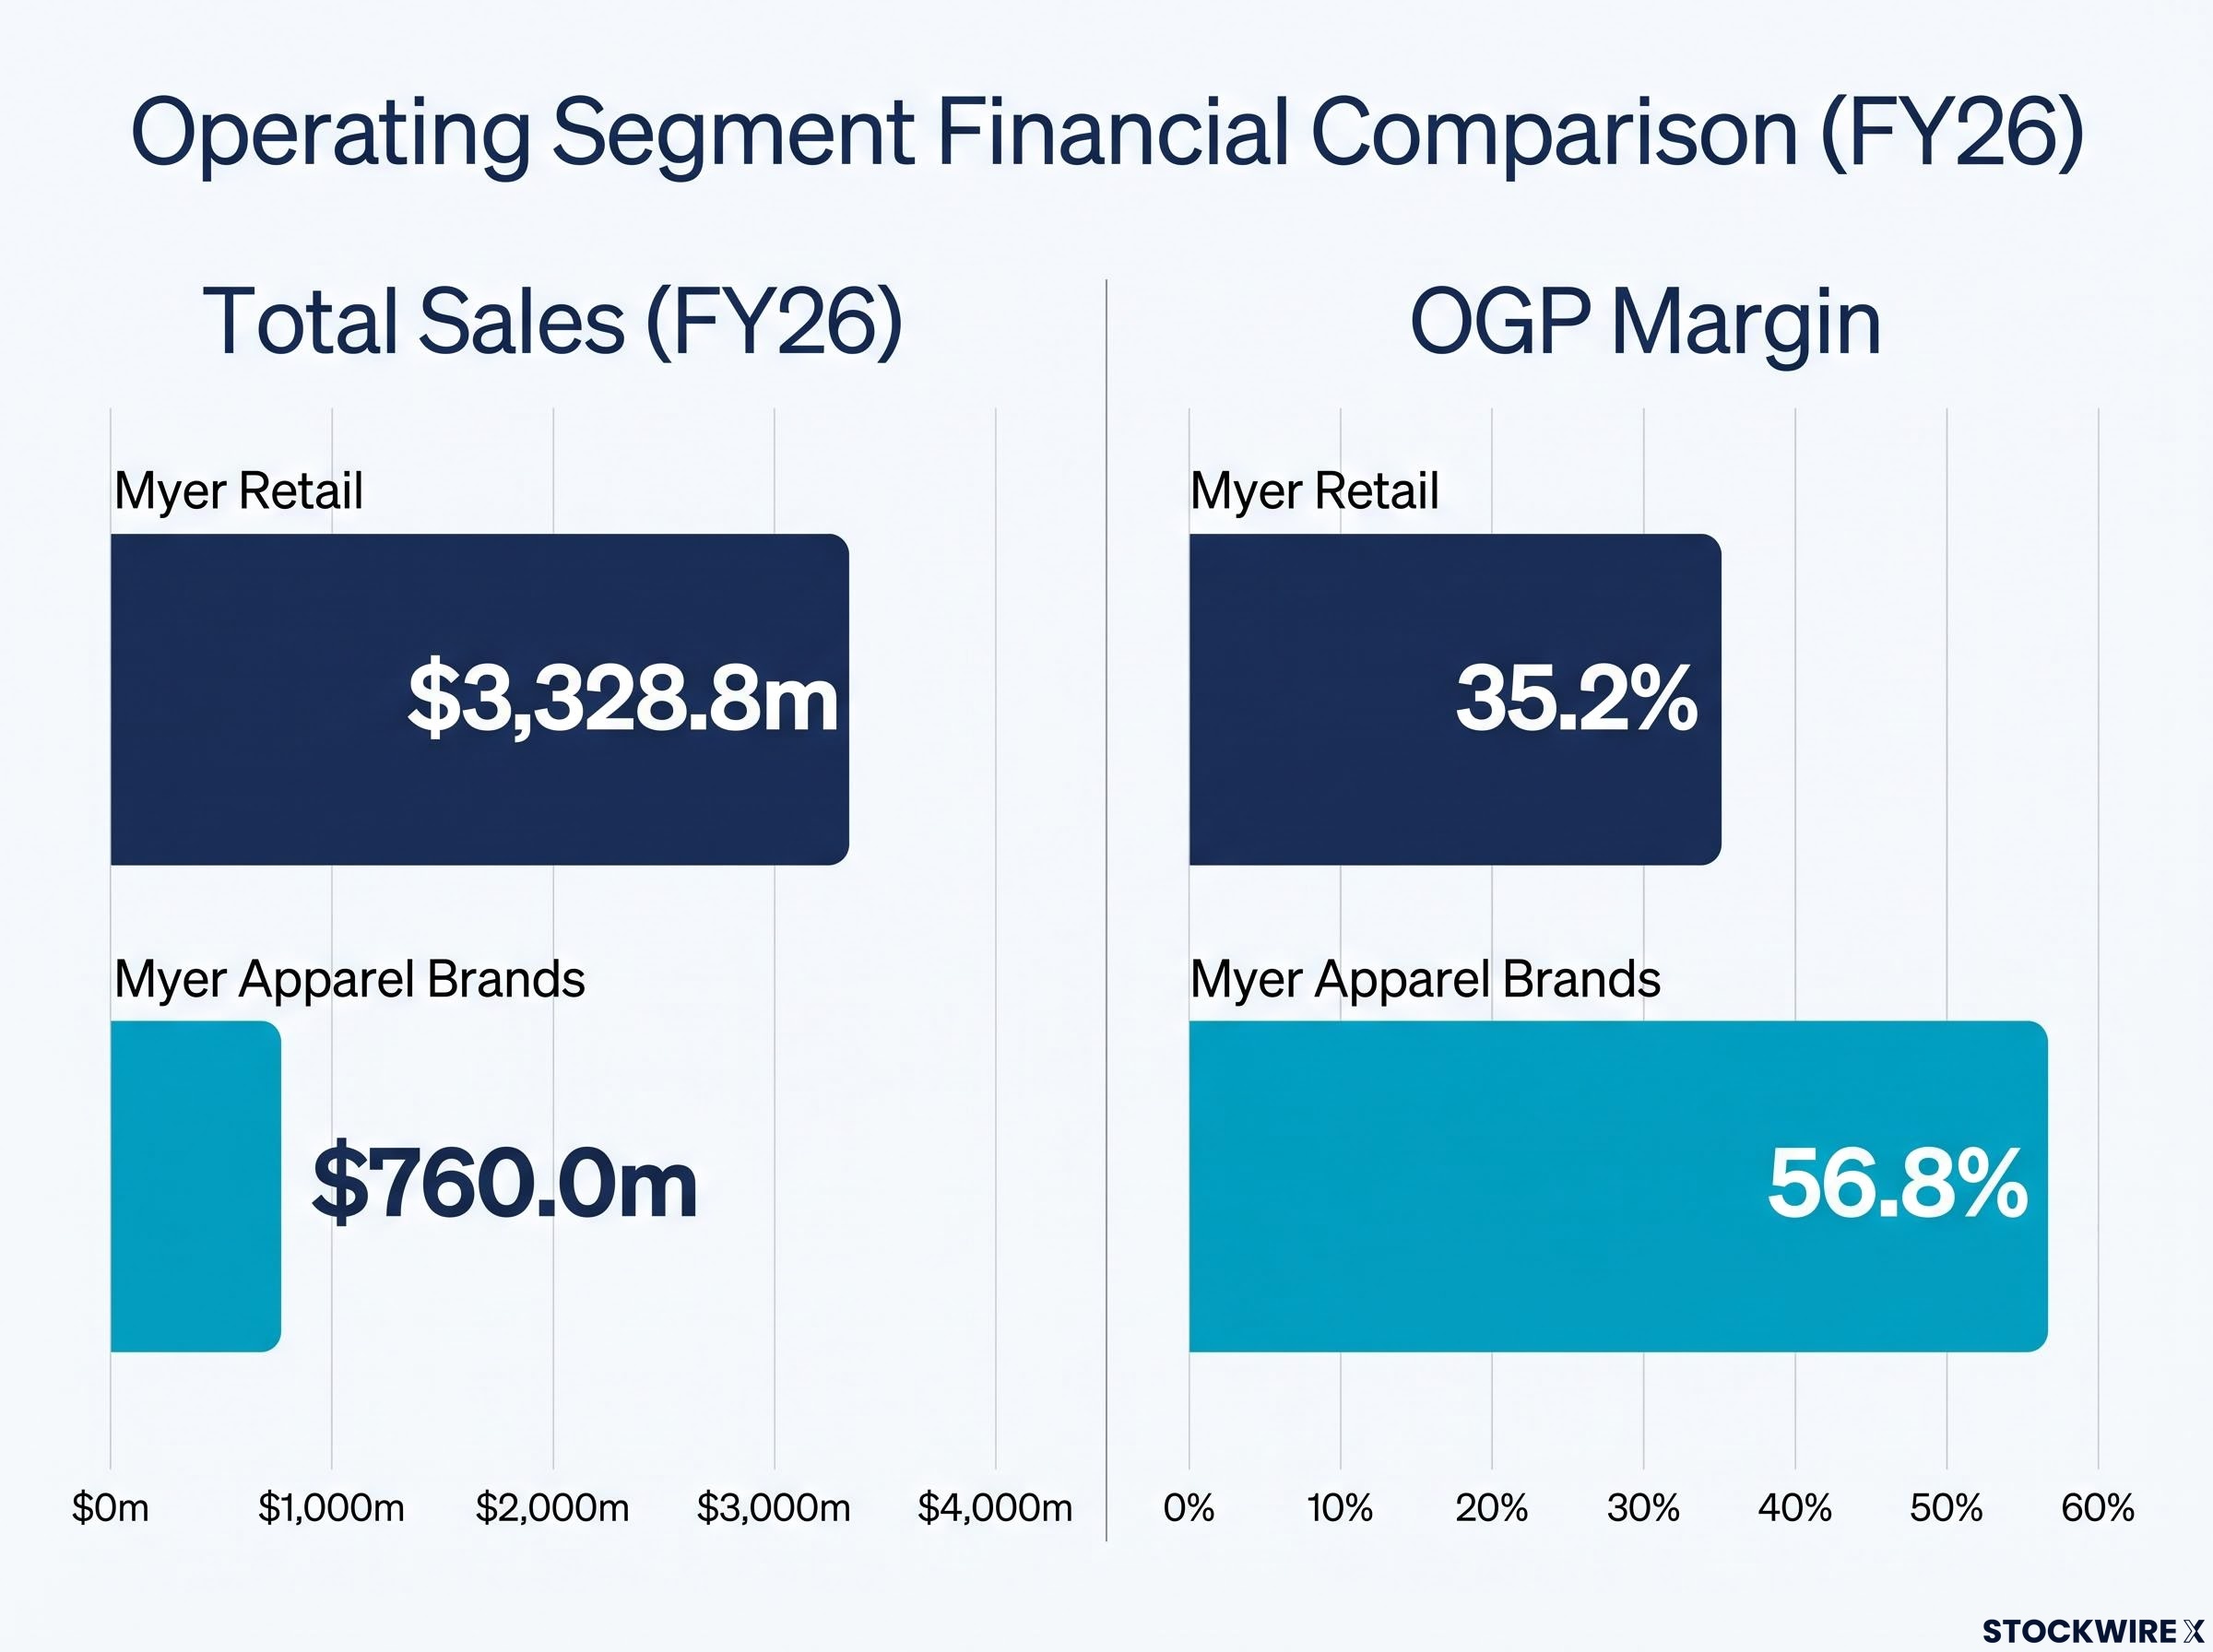
A key structural point highlighted in the presentation: Myer Apparel Brands carries an OGP margin of 56.8%, materially higher than Myer Retail’s 35.2%. This makes the Apparel Brands segment strategically significant to the group’s overall margin profile, even as it currently operates at a smaller sales base.
| Metric | Myer Retail | Myer Apparel Brands |
|---|---|---|
| Total Sales (FY26) | $3,328.8m | $760.0m |
| Sales Change | ▲ 0.7% actual | ▼ 1.3% pro forma |
| Comparable Sales | ▲ 1.0% | ▼ 0.3% |
| OGP Margin | 35.2% | 56.8% |
| MYER one Tag Rate | 81.5% (record) | 55.1% (~12 months since launch) |
| Brand highlights | Women’s Fashion ▲4.7%, Home ▲5.6%, Kids ▲4.6%, Concessions ▲8.2% | Just Jeans ▲6.0%, offset by softness in Portmans |
What comes next — FY27 priorities and early trading
Eight weeks into FY27
The first eight weeks of 1H27 reflected an uneven start, with Myer Group comparable sales broadly flat while actual sales declined.
| Segment | 1H27 Actual Sales | 1H26 Actual Sales | Actual Change | Comparable Sales Change |
|---|---|---|---|---|
| Myer Group | $519.6m | $534.1m | ▼ 2.7% | ▲ 0.2% |
| Myer Retail | $420.2m | $428.3m | ▼ 1.9% | ▲ 1.8% |
| Myer Apparel Brands | $99.4m | $105.8m | ▼ 6.0% | ▼ 5.9% |
The presentation noted that August trading was softer, followed by improving momentum through September. The FY27 CODB target has been maintained at approximately 29% of total sales.
FY27 strategic priorities
Management outlined the following priorities for the year ahead:
- Expand loyalty partnerships and embed enhanced MYER one automation capability
- Launch the Flagship Beauty destination in Sydney
- Progress strategic store renewals and grow the Marketplace offering
- Deliver the National Distribution Centre (NDC) proof-of-concept and finalise the long-term NDC solution
- Continue Myer Apparel Brands integration, targeting annualised synergies of at least $30 million from FY28
Executive Chair Olivia Wirth provided the following outlook commentary:
Olivia Wirth, Executive Chair
“While we remain cautious about the near-term consumer outlook, we believe that our strategic actions are strengthening the Group’s competitive position, resilience and supporting the creation of long-term shareholder value.”
Don’t Miss the Next Consumer Sector Mover
Big News Blast delivers FREE breaking ASX consumer sector news directly to your inbox within minutes of release, complete with in-depth analysis already done. Join 20,000+ investors who stay ahead of the market the moment announcements drop. Click the “Free Alerts” button to start receiving alerts now.