
Light & Wonder 3Q26 earnings presentation highlights: net income up 17% to $133M
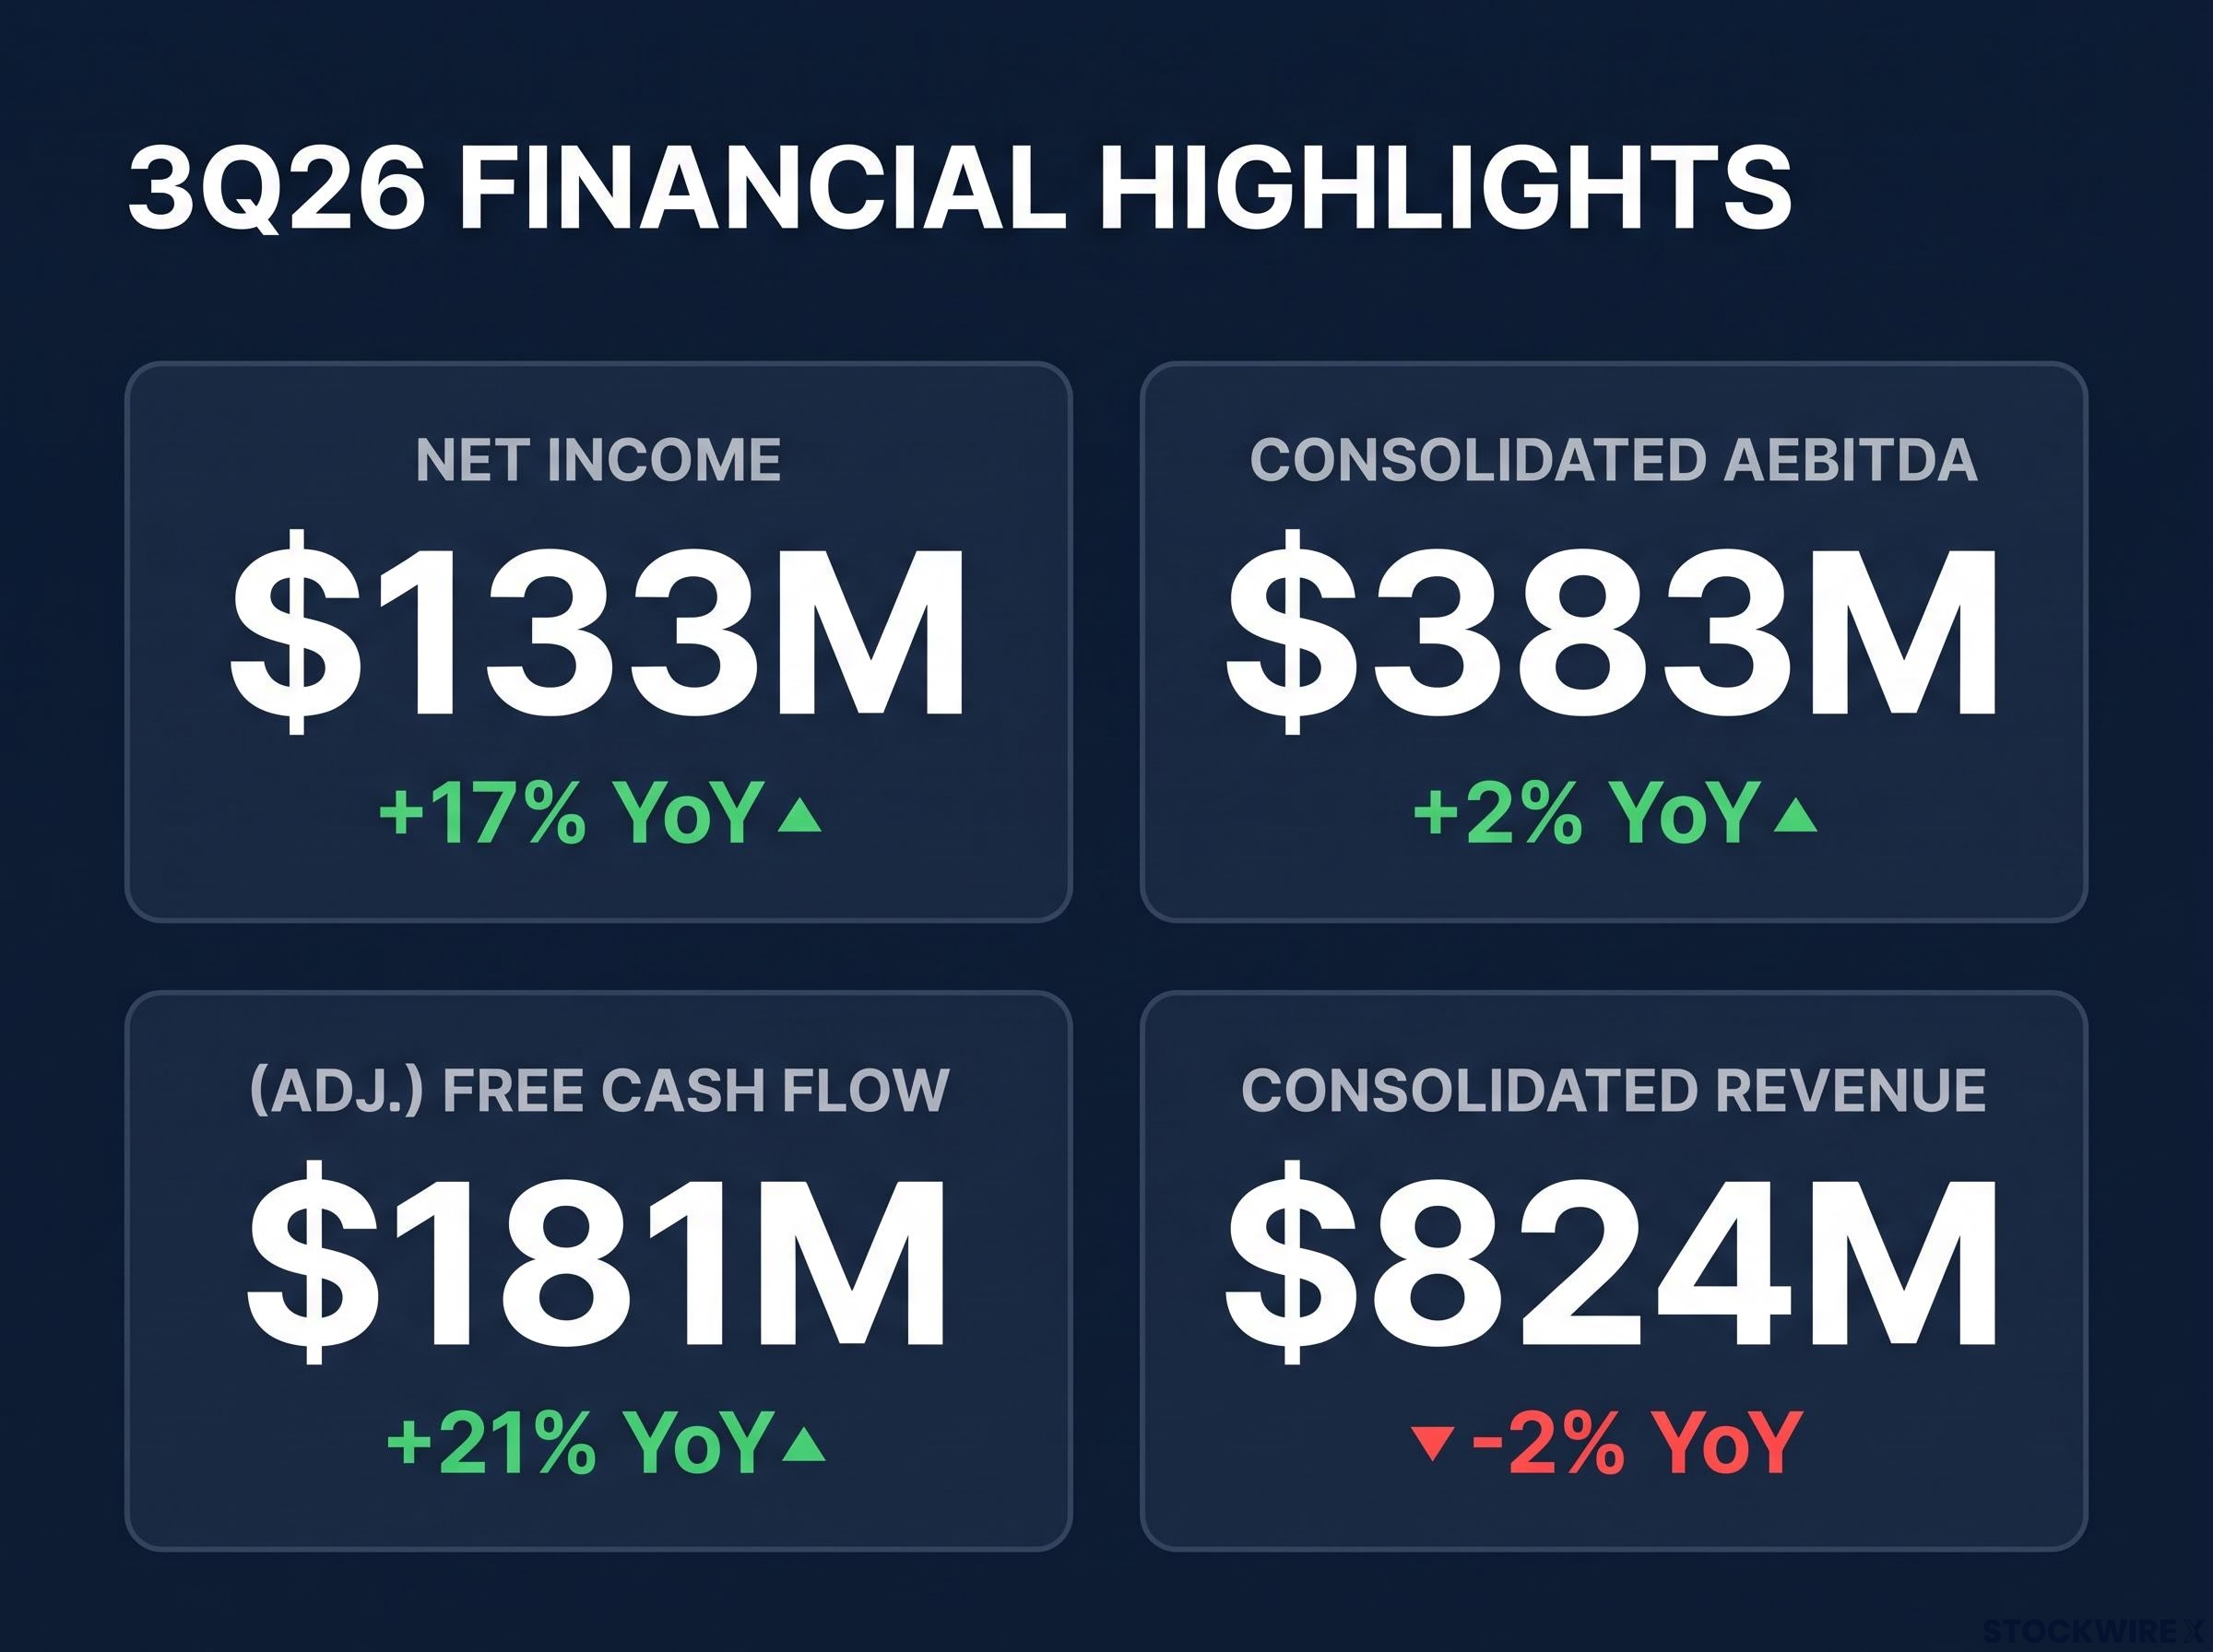
In its Third Quarter 2026 earnings presentation, delivered on 4 November 2026 in the U.S. and 5 November 2026 in Australia, Light & Wonder outlined 3Q26 net income of $133M, up 17% year on year. Management highlighted growth in earnings and cash flow despite a slight fall in revenue.
Consolidated revenue for the September quarter was $824M, down 2%. Management attributed the net income increase primarily to margin strength on a favourable revenue mix and ongoing operational efficiencies.
Key 3Q26 metrics from the presentation:
- Net income: $133M, +17% year on year
- Consolidated AEBITDA: $383M, +2%
- Adjusted NPATA: $163M, +7%
- EPSa (Adjusted NPATA per share): $2.12, +17%
- (Adj.) Free Cash Flow: $181M, +21%
For investors, the figures show earnings and cash generation growing faster than revenue in the quarter.
When big ASX news breaks, our subscribers know first
Recurring revenue and cash generation strengthen the earnings profile
Recurring revenue scale
Management highlighted that recurring revenue made up 71% of total revenue over the nine months of FY26, equal to roughly $1.7B. The company said its progression of recurring revenue focus is driving higher earnings quality, more predictable earnings and enhanced margins.
The shift has been building for several years, and the company’s second-quarter results showed recurring revenue climbing from 63% of sales in 2022 to roughly 70% by mid-year.
Recurring revenue is defined in the presentation as Gaming Operations (including Grover), ongoing Gaming systems maintenance, table services and rental agreements, SciPlay and iGaming revenues.
Cash conversion
Net cash provided by operating activities was $236M in 3Q26, up 28% year on year. Adjusted free cash flow (AFCF) conversion to Consolidated AEBITDA reached 47%, compared with 40% a year earlier, and 50% for the nine months.
Year-to-date AFCF was $545M, while last-twelve-month Adjusted FCF was $725M. Management noted that the quarter’s AFCF reflected strong underlying earnings generation, favourable timing of receivable collections and expenditures, and lower tax and interest payments.
| $ Millions, Unaudited | Q3 2026 | Q3 2025 | 9M 2026 | 9M 2025 |
|---|---|---|---|---|
| Net cash provided by operating activities | $236 | $184 | $616 | $475 |
| Free Cash Flow | $181 | $136 | $393 | $276 |
| Adjusted Free Cash Flow (AFCF) | $181 | $149 | $545 | $365 |
| AFCF / Consolidated AEBITDA | 47% | 40% | 50% | 35% |
Segment performance: Gaming, iGaming and SciPlay
| Segment | 3Q26 Revenue | YoY | 3Q26 AEBITDA | YoY |
|---|---|---|---|---|
| Gaming | $554M | -1% | $312M | +2% |
| SciPlay | $173M | -12% | $67M | -6% |
| iGaming | $97M | +13% | $37M | +9% |
Gaming
Gaming revenue of $554M fell 1%, driven by lower systems and table products sales, partly offset by growth in Gaming operations and Gaming machine sales. AEBITDA rose 2% to $312M, a margin of 56%, which management linked to favourable revenue mix shifts, a growing recurring revenue base and operational efficiencies.
Gaming operations revenue was $248M, up 3%, while Gaming systems revenue fell 24% on lower hardware sales. The North America installed base reached 49,750 units, up 5%, including Grover units.
Management noted the 25th consecutive quarter of North America premium installed base growth, with 571 units added sequentially. Average daily revenue per unit in North America was $47.98, and the global average sales price per new unit rose 5% to about $20,600.
Grover
Grover ended the quarter with an installed base of 12,776 units, adding 205 units in the quarter and 1,487 year on year. The company is targeting entry to the Maryland market in 2H27.
iGaming
iGaming revenue rose 13% to $97M, with AEBITDA up 9% to $37M. Wagers processed through the OPENGAMING System (OGS) reached a quarterly record of $31.7B, and the company recorded its 7th consecutive quarter of sequential 1PP GGR growth across the OGS network.
Management cited a #1 position in U.S. iGaming slots GGR share, according to the Eilers U.S. Online Casino Monitor, September 2026. Two headwinds were flagged: all Brazil content has been disabled following the government’s decision to ban online gambling, and the U.K. tax increase in April remains a headwind.
The company is entering the Florida PMR market, with the first games expected to launch in late 4Q26.
SciPlay
SciPlay revenue fell 12% to $173M, which management attributed to continued softness in the social casino market. Direct-to-consumer (DTC) revenue grew 33% to $53M, now 31% of SciPlay revenue, and the AEBITDA margin expanded by 3 percentage points to 39%.
What is net debt leverage and why it matters to investors
The net debt leverage ratio is net debt divided by Consolidated AEBITDA. A lower ratio generally indicates more balance sheet flexibility and lower financing risk.
At the end of 3Q26 the ratio stood at 3.3x, compared with 3.4x in 2Q26. The company paid down $156M of debt in the quarter, and Fitch upgraded its outlook rating to Positive.
Other balance sheet points highlighted:
- Principal face value of debt outstanding: $5.0B
- Effective interest cost: 6.36%
- Available liquidity: $1.1B, as of 30 September 2026
Management outlined its capital allocation priorities:
- Deleveraging first: the company is currently prioritising deleveraging over buybacks, with a preference for further debt paydown
- Buy-back capacity: $180M remains under the approved buy-back program, unchanged in 3Q
- Capital returned: $2.1B has been returned to shareholders since the repurchase program began in 2022
- CDI purchases: on-market purchases of CDIs held in trust to cover future vesting or exercise of equity awards commenced, totalling $30M in Q3
What management says happens next
The presentation set out the following forward-looking items:
- FY26 earnings growth: Consolidated AEBITDA growth is expected toward the lower end of the previously announced range of mid-to-high single digits. Adjusted NPATA is expected to grow faster than Consolidated AEBITDA, and EPSa faster than Adjusted NPATA.
- Leverage targets: The company targets a net debt leverage ratio of 3.0x by end CY26 and below 3.0x during 1H27, with the intention to move towards an investment grade level leverage profile.
- Florida: The first iGaming games in the Florida PMR market are expected to launch in late 4Q26.
- Grover: The company is targeting Maryland market entry in 2H27.
- FY28 targets: Management remains focused on targets of >US$10.55/share EPSa and $2.0B Consolidated AEBITDA.
- Modelling parameters: Combined R&D and capex is targeted at approximately 17% of consolidated revenues, with an effective tax rate of 22% to 24% in 2026 and an effective interest cost of 6% to 7%.
The leverage and FY28 figures are forward-looking non-GAAP measures, and the company noted it is not providing forward-looking quantitative reconciliations of targeted Consolidated AEBITDA, net debt leverage ratio or EPSa to the most directly comparable GAAP measures.
Don’t Miss the Next Consumer Discretionary Winner
Get FREE breaking ASX news delivered to your inbox within minutes of release, complete with in-depth analysis already done. Join 20,000+ subscribers who stay ahead of the market with Big News Blast. Click the “Free Alerts” button now to receive consumer, tech and healthcare updates the moment news breaks.