
Trajan outlines FY27 momentum and double-digit nEBITDA growth target
In its 08 October 2026 Sharewise webinar presentation, Trajan Scientific and Medical (ASX:TRJ) outlined FY27 guidance of mid-single digit organic revenue growth and double-digit nEBITDA growth over the prior comparable period (pcp). CEO and Managing Director Stephen Tomisich led the session.
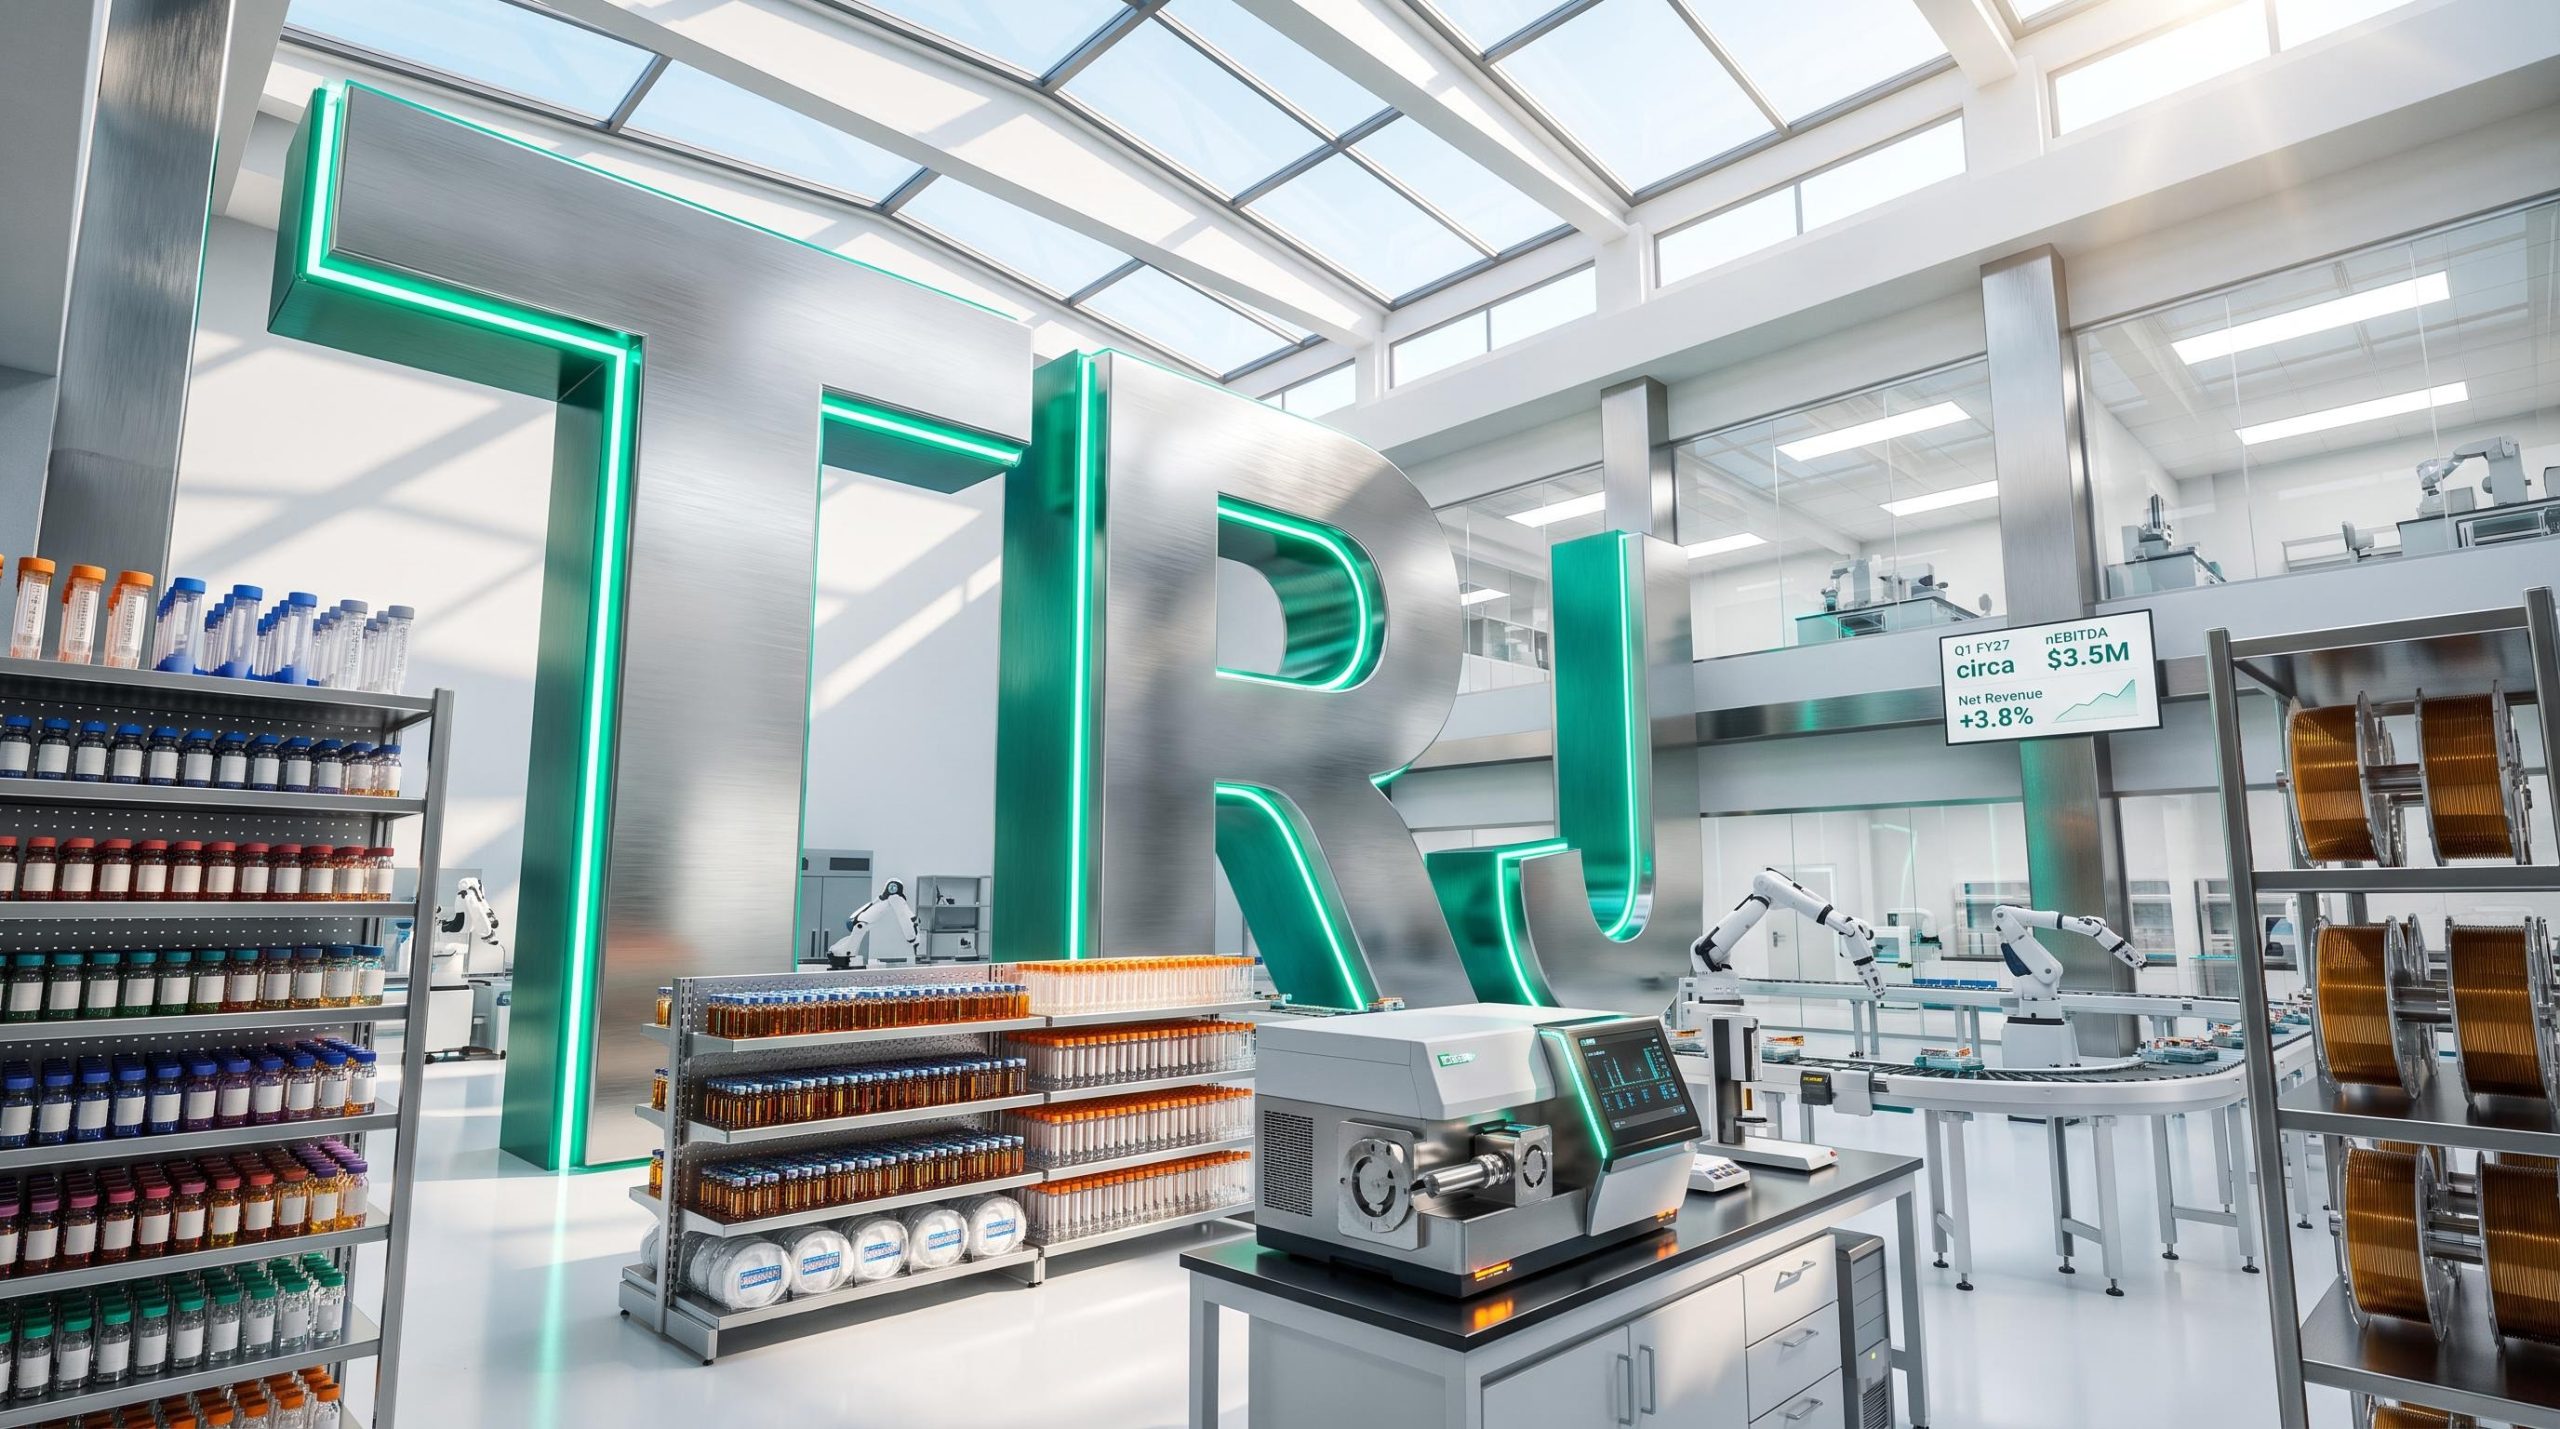
Management also pointed to a Q1 FY27 nEBITDA result of circa $3.5M, taking rolling 12-month nEBITDA to $16.2M. The Q1 FY27 figures are unaudited management accounts.
For investors, the presentation suggests the narrative is moving from cost reduction towards growth, with management citing momentum building since Q2 FY26.
When big ASX news breaks, our subscribers know first
FY26 results and the H2 recovery
FY26 financial summary
The presentation detailed the FY26 results below. nEBITDA is statutory EBITDA excluding restructuring costs, acquisition costs and the impact from FECs revaluation.
| Metric | FY26 | PCP | Change |
|---|---|---|---|
| Group Revenue | $161.4M | $166.5M | Down 3.1% |
| Group nEBITDA | $13.2M | $15.5M | Down 14.7% |
| Proforma Gross Margin | 38.9% | 39.8% | Down 0.8pts |
| Operating NPATA | $2.2M | $0.8M | Up 191.3% |
| Cash | $12.6M | $11.9M | Up 6.5% |
| Net Debt | $34.6M | $29.5M | Up 17.0% |
Reported revenue declined due to forex volatility, according to the presentation. Operating NPATA is statutory NPAT excluding restructuring costs, acquisition costs, the impact from FECs revaluation and amortisation of acquired intangible assets.
Second-half improvement
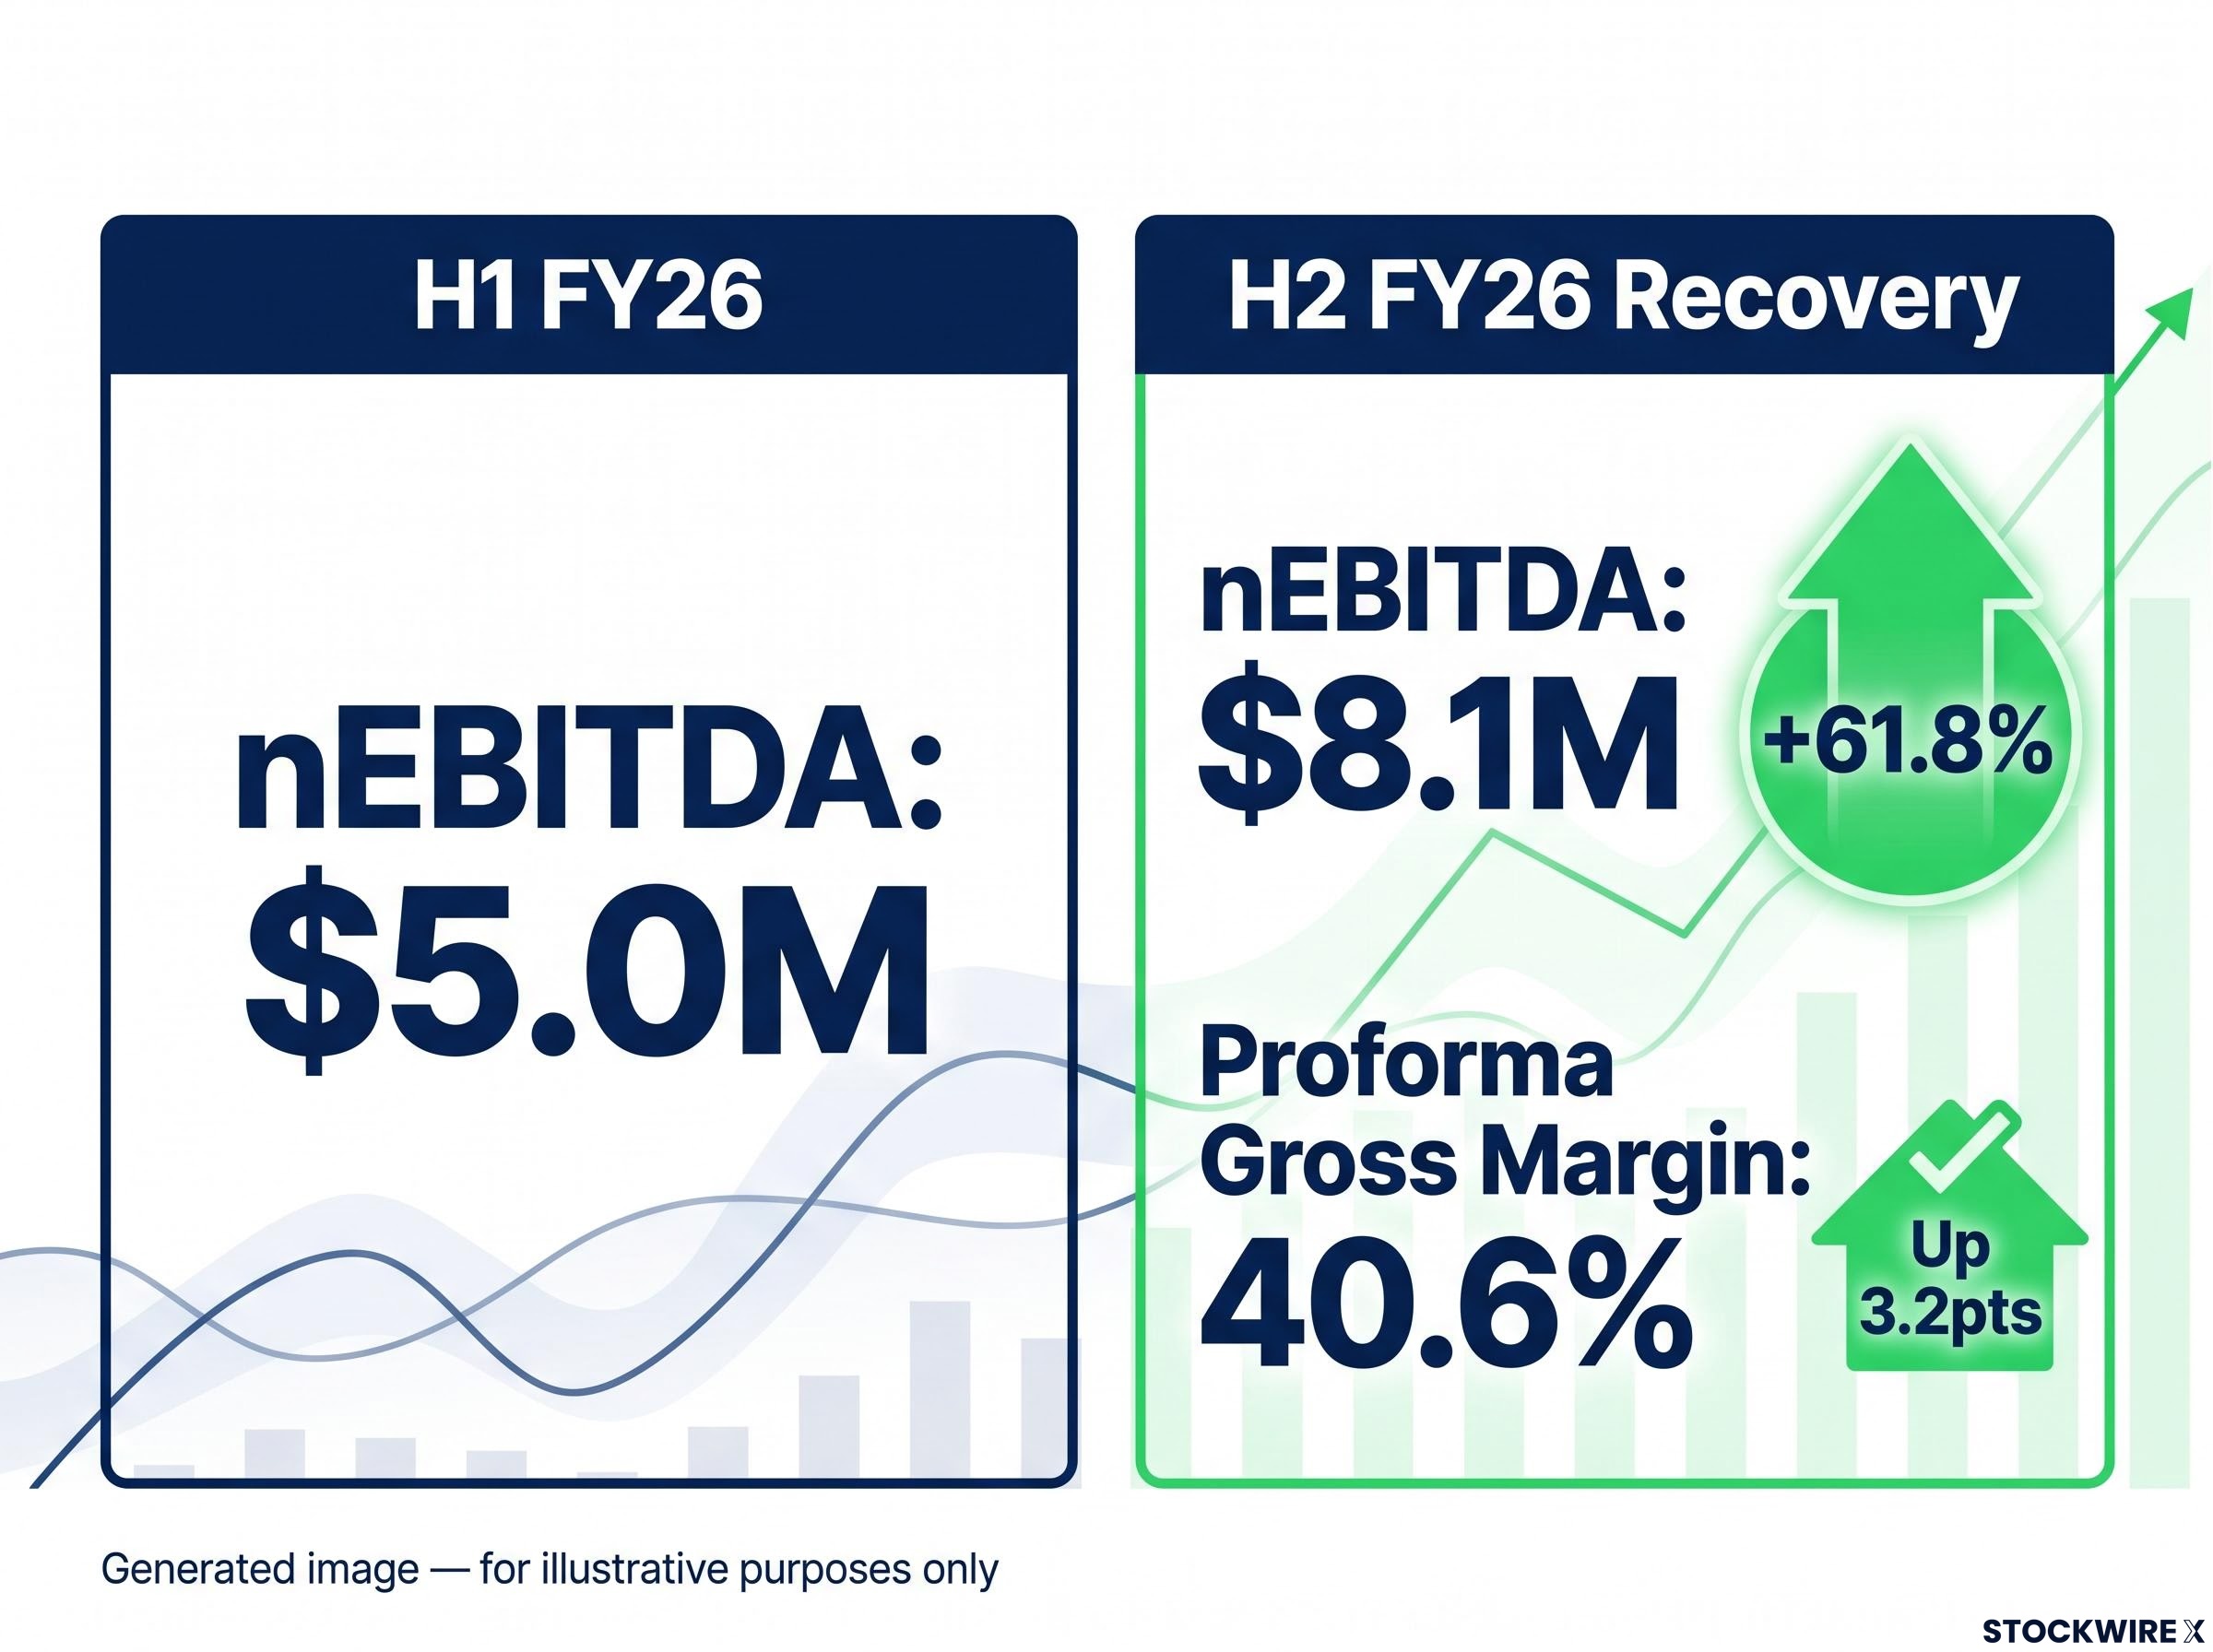
H2 FY26 nEBITDA rose to $8.1M, up 61.8% from $5.0M in H1 FY26. On a fixed currency basis (AUD adjusted to H1 forex rates), group H2 nEBITDA was $10.5M.
The H1 FY26 results showed nEBITDA compressed to $5.0M despite record Q2 revenue, setting a low base against which the second-half cost and pricing initiatives were later measured.
Proforma gross margin reached 40.6% in H2, up 3.2pts on H1. Underlying H2 FY26 revenue was impacted by circa $5.0M due to AUD appreciation, and approximately 85% of Trajan’s revenue is derived in USD and EUR.
What drove the uplift
Management attributed the H2 improvement to four operational initiatives:
- Project Neptune headcount and facilities cost reductions gave an uplift of $1.2M in H2.
- Corporate Services headcount reduction achieved a further uplift of $1.2M in H2.
- Pricing actions effective 01 January 2026 contributed to a gross margin increase of 3.2pts in H2 over H1.
- A supply chain growth initiative contributed a reduction of approximately $0.9M in H2.
Full-time equivalent (FTE) staff reduced by 45.4 from September to June 2026, and Trajan entered FY27 under 600 FTE.
Q1 FY27 segment trends
Management accounts indicated net revenue was up 3.8% on Q1 FY26. Segment results were:
- Components & Consumables: up 5.2%
- Disruptive Technologies: up 12.7%
- Capital Equipment: down 1.2%, described by management as “still challenged”
Net debt was reduced by $1.6M in Q1.
Components & Consumables is the largest segment at approximately 70% of revenue. Based on annualised revenue at monthly resolution and fixed forex rates, management said growth is back to normal following destocking in March 2024.
Understanding Trajan’s business model
Trajan is a developer and manufacturer of analytical and life science products and devices. Its products are used in the analysis of biological, food and environmental samples.
The company reports three segments, shown here by approximate share of revenue:
- Components & Consumables (70%): recurrent revenue, multiple channels to market
- Capital Equipment (30%): software, customised automation and sample analysis equipment
- Disruptive Technologies (<1%): decentralised analytical sample monitoring
Trajan has approximately 600 people across ten sites in the US, Australia, Europe and Asia, with more than 8,000 SKUs. More than 95% of revenue is generated outside Australia.
Founded in 2011 and listed on the ASX in 2021, Trajan has grown through organic and acquired expansion. Management described a step-wise approach to acquisitions and subsequent integrations.
Management said manufacturing scale across multiple geographies and global diversification support its ability to pivot to “in-region, for-region” manufacturing.
What investors should watch next
Management anticipates providing more specific FY27 revenue and nEBITDA guidance at the Annual General Meeting on Wednesday 28 October 2026 at 10:00 am (AEDT).
Key watch points include the recovery of Capital Equipment, the impact of AUD appreciation and further net debt reduction. The presentation positions the investment case around a reset cost base, margin recovery and building momentum.
Stay Ahead on Healthcare News Before the Market Moves
Get FREE breaking ASX announcements delivered to your inbox within minutes of release, with in-depth analysis already done. Join 20,000+ subscribers receiving real-time alerts from Big News Blast. Click the “Free Alerts” button now to see market-moving healthcare and tech news the moment it breaks.