Ryman Healthcare Details First Positive Free Cash Flow in a Decade at $188M
Ryman Healthcare posts $188m free cash flow in landmark FY26 turnaround
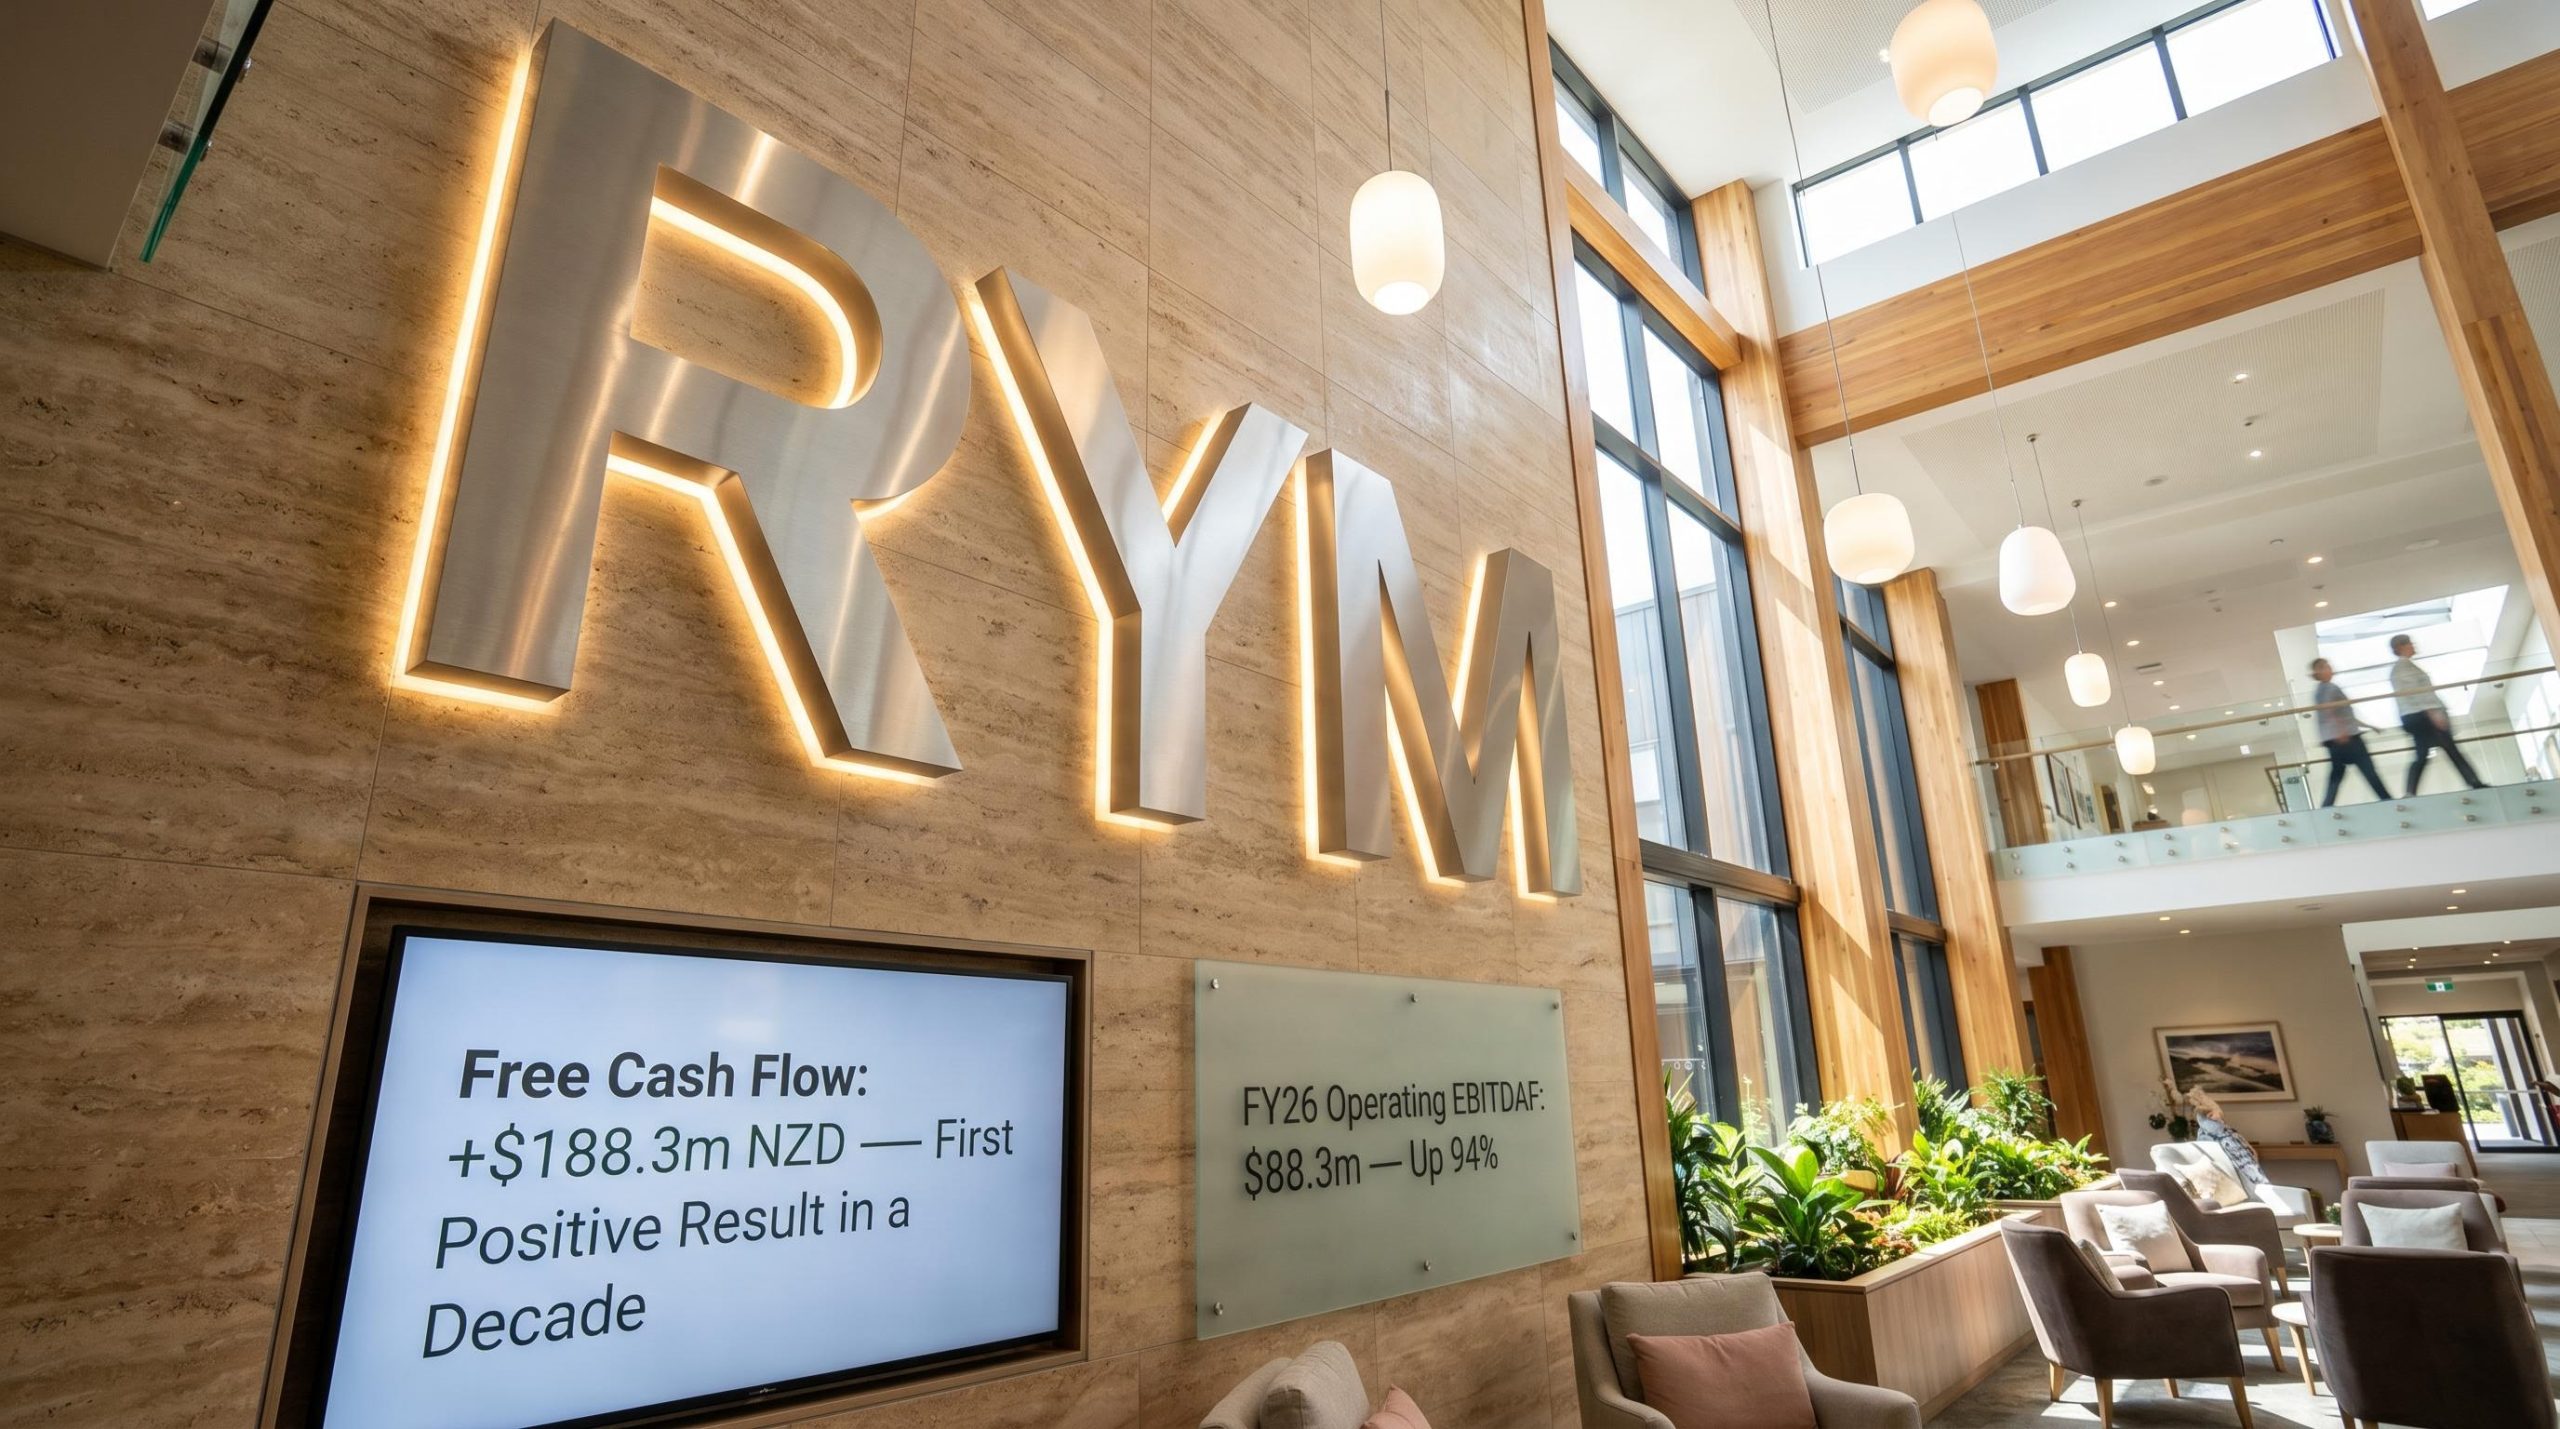
In its full-year results presentation delivered on 26 May 2026, [Ryman Healthcare](https://stockwirex.com/asx-stocks/biotech-health/RYM-ryman-foreign exempt-nzx/) (ASX: RYM) outlined a significant financial turnaround for the twelve months ended 31 March 2026. All figures are in New Zealand dollars (NZD) unless otherwise stated. The headline result: free cash flow of $188.3m, described by management as the first positive result in a decade, swinging from -$94.2m in FY25, a $282.5m year-on-year improvement. CEO Naomi James and CFO Matt Prior presented results across three interlocking themes: a sharp financial recovery, operational momentum led by aged care, and a clear strategic roadmap toward FY29 targets.
When big ASX news breaks, our subscribers know first
Financial performance: from loss to positive cash generation
Revenue and earnings
Operating revenue rose 10% to $849.1m (FY25: $771.1m), driven by growth in care and village fees as resident numbers increased 2.6% and fee growth flowed through across both segments. Operating EBITDAF nearly doubled, rising 94% to $88.3m from $45.5m in FY25, reflecting disciplined cost control and margin expansion.
The company remains in a net loss position at the NPAT level. Net loss after tax came in at -$171.3m, improved 67% from -$513.7m in FY25, while profit before tax and fair value movements (PBTF) per share narrowed sharply to -7.2 cents from -54.1 cents, an 87% improvement. The trajectory is unambiguously positive, even as full profitability has not yet been restored at the NPAT level.
Free cash flow returns positive for the first time in a decade
The most significant milestone from the presentation was the return to positive free cash flow, which management described as the “first positive result in a decade” at $188.3m (FY25: -$94.2m). This is a return to positive territory after a prolonged period of negative results, not a first-ever achievement.
Two primary drivers were highlighted. First, development capital expenditure fell 59% to $221.8m from $535.9m in FY25, reflecting a deliberate wind-down from seven active construction sites to two. Second, cash flow from development activity (CFDA) surged to $222.2m (FY25: $13.3m), underpinned by strong new sales receipts and broadly stable care capital inflows. Cash flow from existing operations (CFEO) improved to -$33.9m from -$107.5m, a $73.6m gain.
| Metric | FY25 | FY26 | Change |
|---|---|---|---|
| Operating Revenue | $771.1m | $849.1m | +10% |
| Operating EBITDAF | $45.5m | $88.3m | +94% |
| Free Cash Flow | -$94.2m | $188.3m | +$282.5m |
| Net Interest-Bearing Debt | $1,665m | $1,571m | -$94m |
| Gearing | 28.5% | 27.8% | -0.7ppts |
Cost discipline delivers $57m in savings
The cost-out programme continued to deliver tangible results across the two-year restructuring period:
- $57m gross annualised cost savings achieved over two years, in line with the $50–60m guidance range
- Non-village headcount reduced approximately 40% since FY24, falling from 620 to 377
- Normalised gross non-village costs reduced from $145.5m (FY24) to $108.6m (FY26)
- Net debt reduced by $94m to $1,571m; gearing of 27.8% is the lowest among NZX-listed peers
- Weighted average cost of debt fell to 5.9% (down 30 basis points); 77% of drawn debt is now on fixed rates
Operational progress — aged care leads the way
Aged care EBITDAF per bed surges 31% half-on-half
Aged care was the primary driver of second-half momentum. Operating EBITDAF per aged care bed rose to $17.7k for the full year, with a pronounced acceleration through the year: $15.3k in the first half, climbing to $20.1k in the second half, a 31% half-on-half improvement.
The geographic split was notable. Australian care beds delivered $32.7k per bed compared with $15.1k per bed in New Zealand, reflecting the benefit of aged care funding reforms that took effect in Australia during the period. Total aged care occupancy improved to 92.0% (FY25: 90.9%), with revenue per bed per day rising 6% in New Zealand and 9% in Australia.
New resident room premiums in New Zealand increased 13%, and the average incoming refundable accommodation deposit (RAD) for new Australian residents rose 6%. Occupancy gains at developing villages provided additional evidence of a maturing portfolio. Bert Newton improved from 29% to 90% over the year, while Kevin Hickman moved from 0% to 96% following the opening of its main building in July 2025. Management has set targets of $20–25k per bed for FY27, rising to $25–30k by FY29.
Retirement living — contract reset taking hold
The retirement living segment is in the midst of a deliberate contract repricing that is beginning to generate meaningful revenue uplift. The average contracted deferred management fee (DMF) for new residents rose to 30% in FY26, up from 22% in FY25, an 8 percentage point improvement.
Weekly fees for incoming independent unit residents averaged $209 per week in FY26, compared with $128 per week for vacating residents, a 63% uplift on turnover. Approximately 17% of the portfolio is now operating under the new weekly fee terms, with management targeting ~50% by FY29. A further positive signal emerged in the fourth quarter: net resales applications exceeded turnover for the first time since pricing model changes were implemented in October 2024. Resale contracts settled within 90 days also improved, lifting to approximately 50% of settlements in the second half of FY26.
CEO Naomi James
“Ryman enters FY27 with a stronger and more resilient business than two years ago, with prudent gearing, long-tenored debt, improved operating performance and significantly reduced development commitments.”
What is deferred management fee (DMF) — and why does it matter?
For investors less familiar with the retirement village model, the deferred management fee is a core revenue mechanism. Here is how it works:
- A new resident enters a Ryman village and pays an occupation right agreement (ORA) price for their unit.
- The resident lives in the village and pays ongoing weekly fees for services and amenities.
- When the resident departs (or passes away), the ORA is repaid to the resident or their estate.
- Ryman retains the DMF, calculated as a percentage of the original ORA price, as its share of the capital gain and service provision over the residency.
A higher contracted DMF rate directly increases the cash Ryman retains on each resident departure. At 30% versus the prior 22%, the uplift is material on an individual unit basis and compounds across thousands of unit turnovers each year.
The FY29 investment thesis centres on this compounding effect. As roughly half the portfolio rolls onto 30% DMF contracts by FY29, the earnings tailwind from each departing resident will be significantly larger than it is today. This benefit is largely not yet reflected in current results, meaning the DMF reset represents a forward earnings driver that builds progressively as the portfolio turns over.
The next major ASX story will hit our subscribers first
Strategy and outlook — building toward FY29
Progress against FY29 targets
Management presented the following FY29 roadmap and FY26 progress against each target:
- $150m CFEO improvement target — $47m delivered in FY26 (first year of the programme)
- $500m combined cash release (CFDA plus resales) — $169m released in FY26
- Aged care EBITDAF per bed of $25–30k — $17.7k in FY26, targeting $20–25k in FY27
- Gross non-village costs below $100m — $108.6m in FY26, with trajectory moving in the right direction
Capital management and path to dividends
The balance sheet reset is now complete. Ryman refinanced $2 billion in bank facilities during the period, with no bank debt maturities until FY31 and $675m in liquidity headroom at year end. Gearing of 27.8% is the lowest among NZX-listed peers, per presentation data.
Management flagged a path to dividends in FY28. The Board has set a high threshold for new investments while shares trade at a significant discount to net tangible assets (NTA). NTA was reported at $4.00 per share (400.5 cents) at 31 March 2026.
On land divestments, the target was lifted from at least $200m to approximately $250m. As at the presentation date, $147m had been contracted and $72m in cash proceeds received. Options for the retail bond maturing December 2026 ($150m) are under consideration to maintain diversified debt sources.
FY27 guidance snapshot
Management provided the following FY27 guidance:
- Retirement living: Targeting a reduction in total vacant stock and lifting the resales rate (occupation basis) to match turnover by the end of FY27
- Aged care: Targeting $20–25k operating EBITDAF per bed
- Build rate: 157–168 units and beds, comprising 60 care beds and 97–108 retirement village units
- Total capex: $150–180m, including $90–110m on development activity and $60–70m on existing operations
Ryman enters FY27 with a strengthened balance sheet, substantially reduced development commitments, and a clear roadmap toward recurring cash generation. Management’s commentary points to continued improvement in aged care earnings, progressive retirement living stock reduction, and ongoing capital release as the key pillars of near-term execution.
Don’t Miss the Next Healthcare Turnaround Story
Breaking ASX healthcare news lands in your inbox within minutes of release, complete with in-depth analysis, through the FREE Big News Blast alert service. Join 20,000+ subscribers already ahead of the market and never miss a market-moving announcement. Click the “Free Alerts” button to start receiving real-time coverage today.