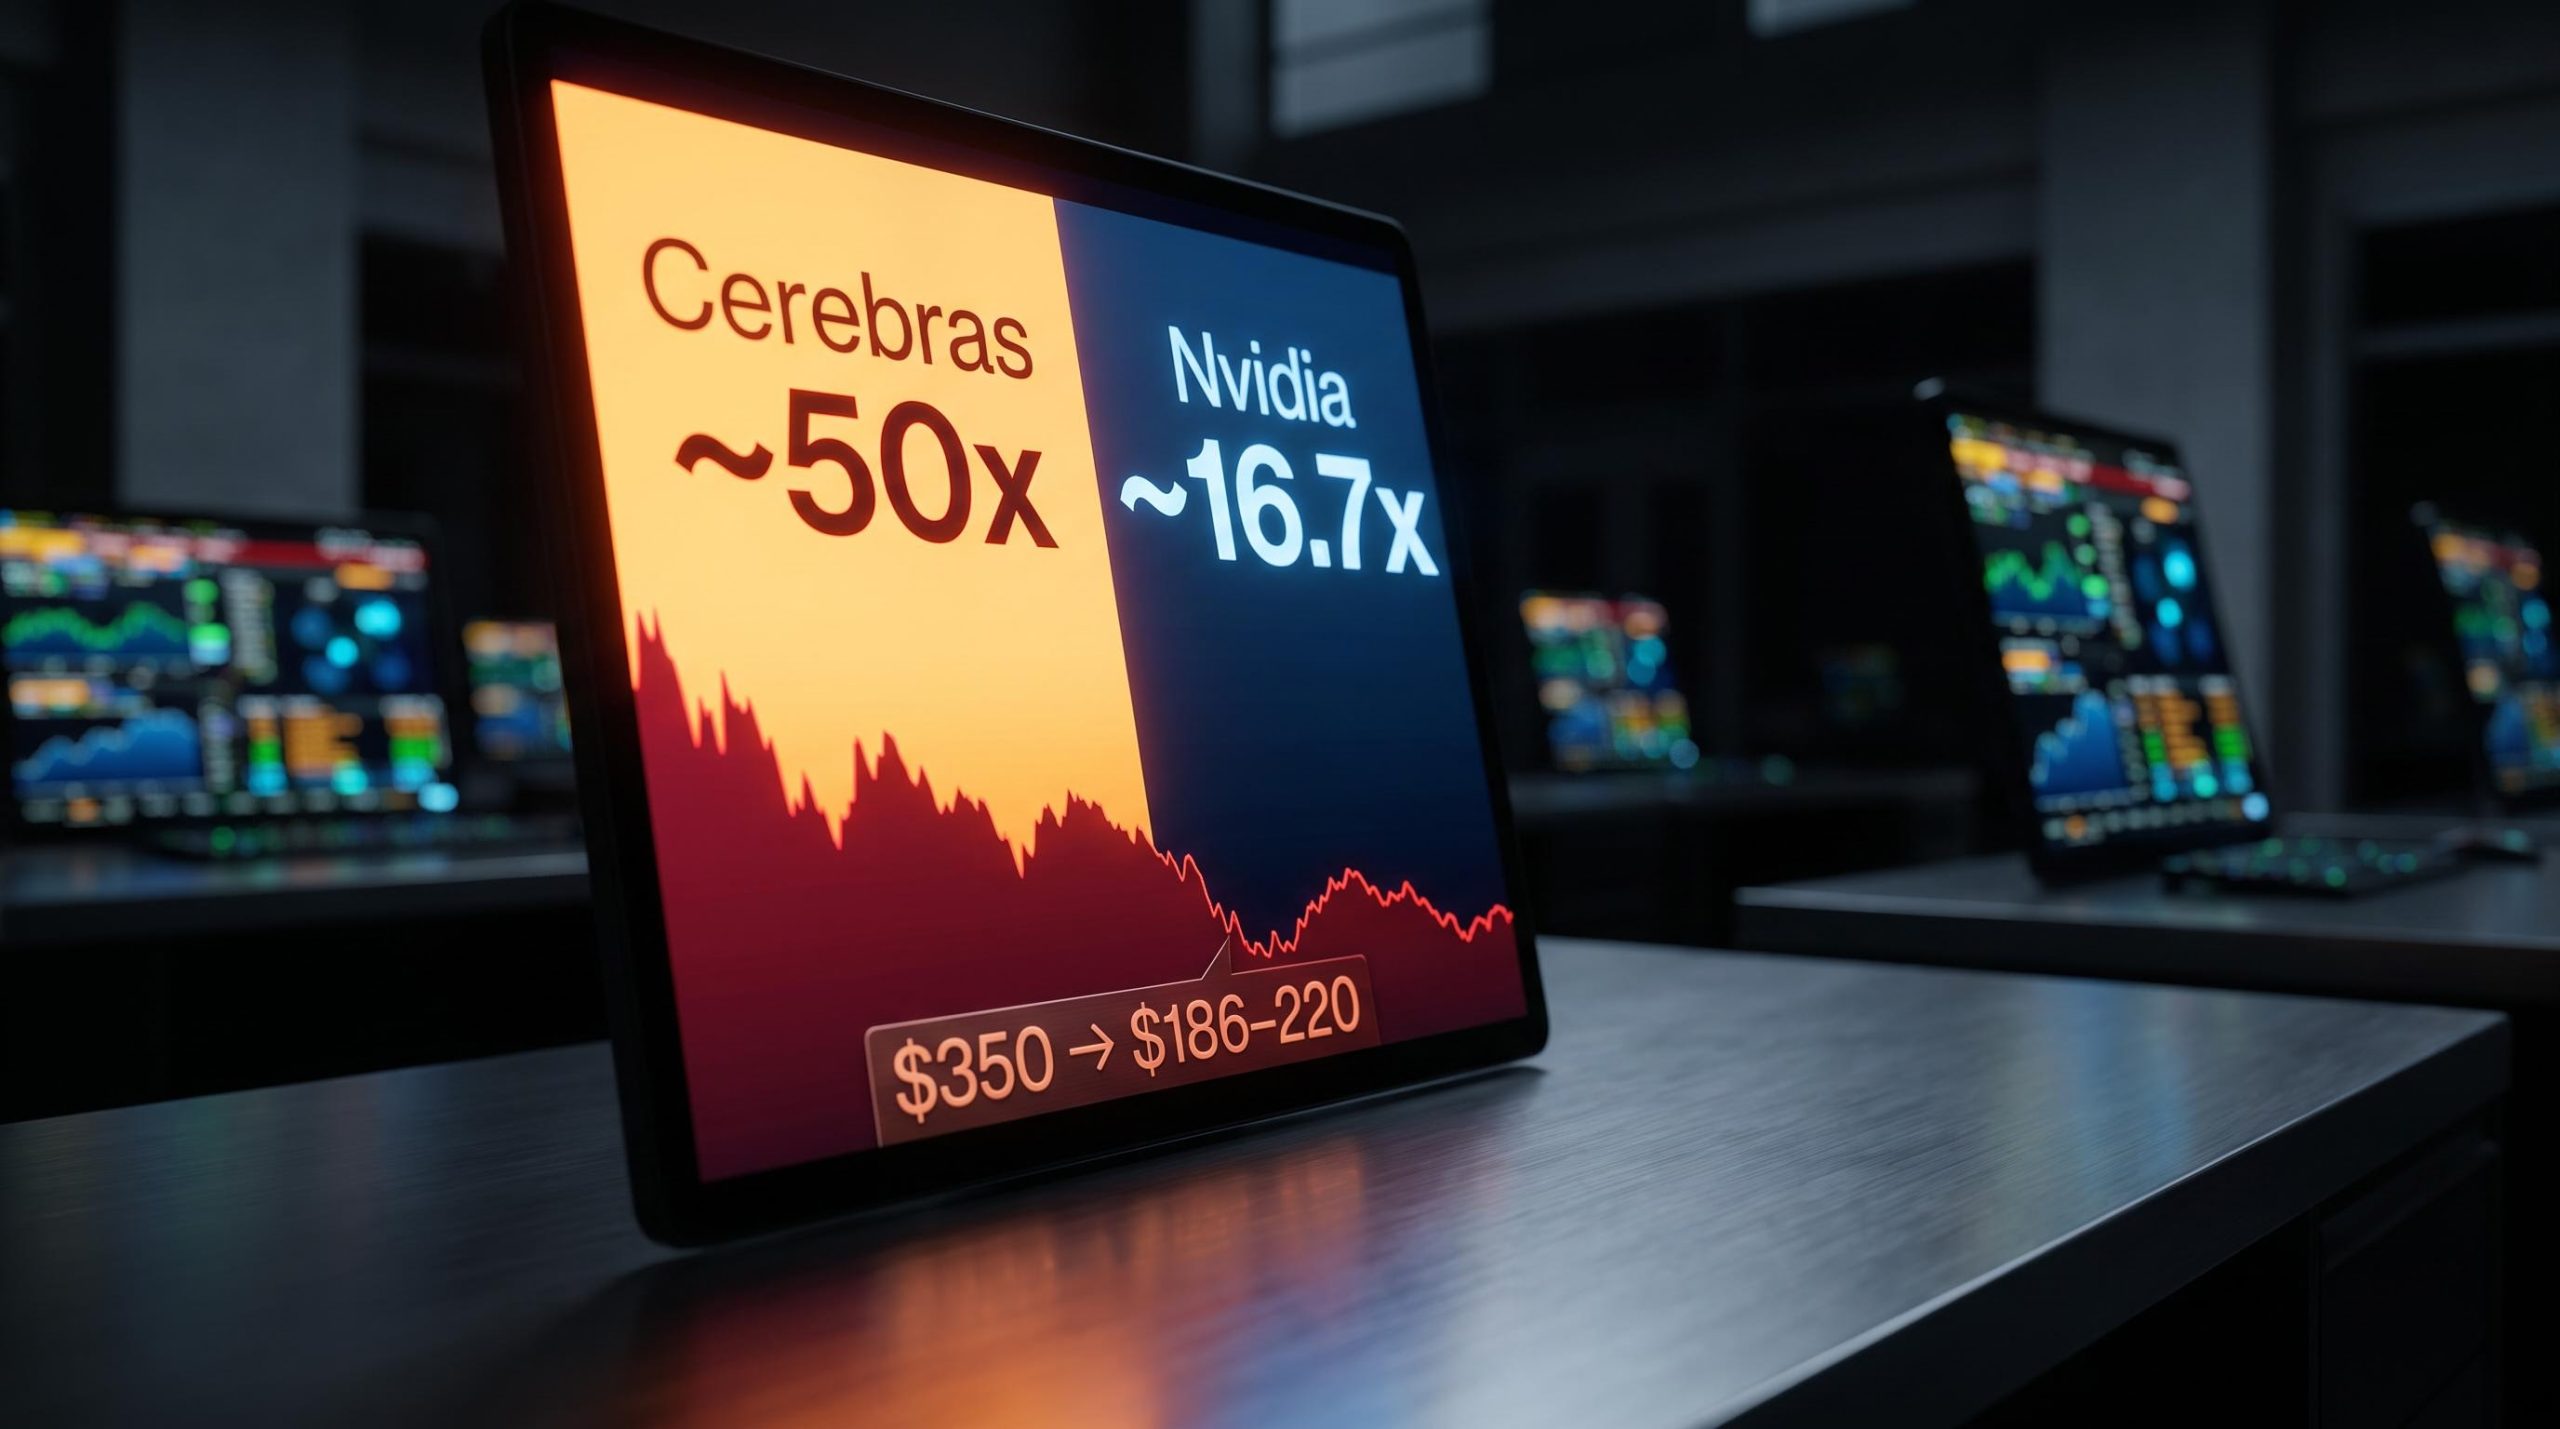
Cerebras shares climbed 60% on their first day of trading, opening at $350 and closing at $311.07, briefly pushing the company’s market capitalisation toward $95 billion. Within weeks, before most retail investors had even seen a quarterly filing, the stock had fallen roughly 40% to settle in the $186-220 range.
That decline was not a correction. It was price discovery, delayed. The first post-IPO 10-Q exposed what the listing-day enthusiasm had priced over: customer concentration skewed heavily toward two UAE-linked entities, a top line inflated by pass-through revenues carrying a 3% markup, and a blended gross margin sitting closer to a hardware assembler than an AI platform company. The market cap, now roughly $44-52 billion, still sits against sub-$1 billion near-term core revenue guidance.
Here is a framework for evaluating whether Cerebras, or any high-growth AI IPO, is priced for demonstrated performance or for a future that has not arrived. The methodology is replicable with public data, and it produces specific price thresholds you can act on.
The valuation gap that survived the post-IPO selloff
At IPO-day peak, Cerebras carried a trailing revenue multiple well above 180x. A market cap near $95 billion against 2025 full-year revenue of approximately $510 million placed it in territory that only a handful of technology companies have ever occupied, and none of those companies had this revenue profile when they got there.
The 40% decline sounds like a reset. It was not. The stock moved from extraordinary to still-extraordinary. The current trailing price-to-sales ratio sits at approximately 65.6-65.7x, a figure that remains several times the valuation of the company it is most often compared to.
Nvidia, a faster-growing and far more profitable AI chip company, trades at an SVR of approximately 16.7. Cerebras trades at several times that level.
The disruptive-technology catalogue average SVR (a company’s market capitalisation divided by its annualised revenue) sits at approximately 8. Cerebras trades at roughly eight times that benchmark, even after the post-IPO pullback.
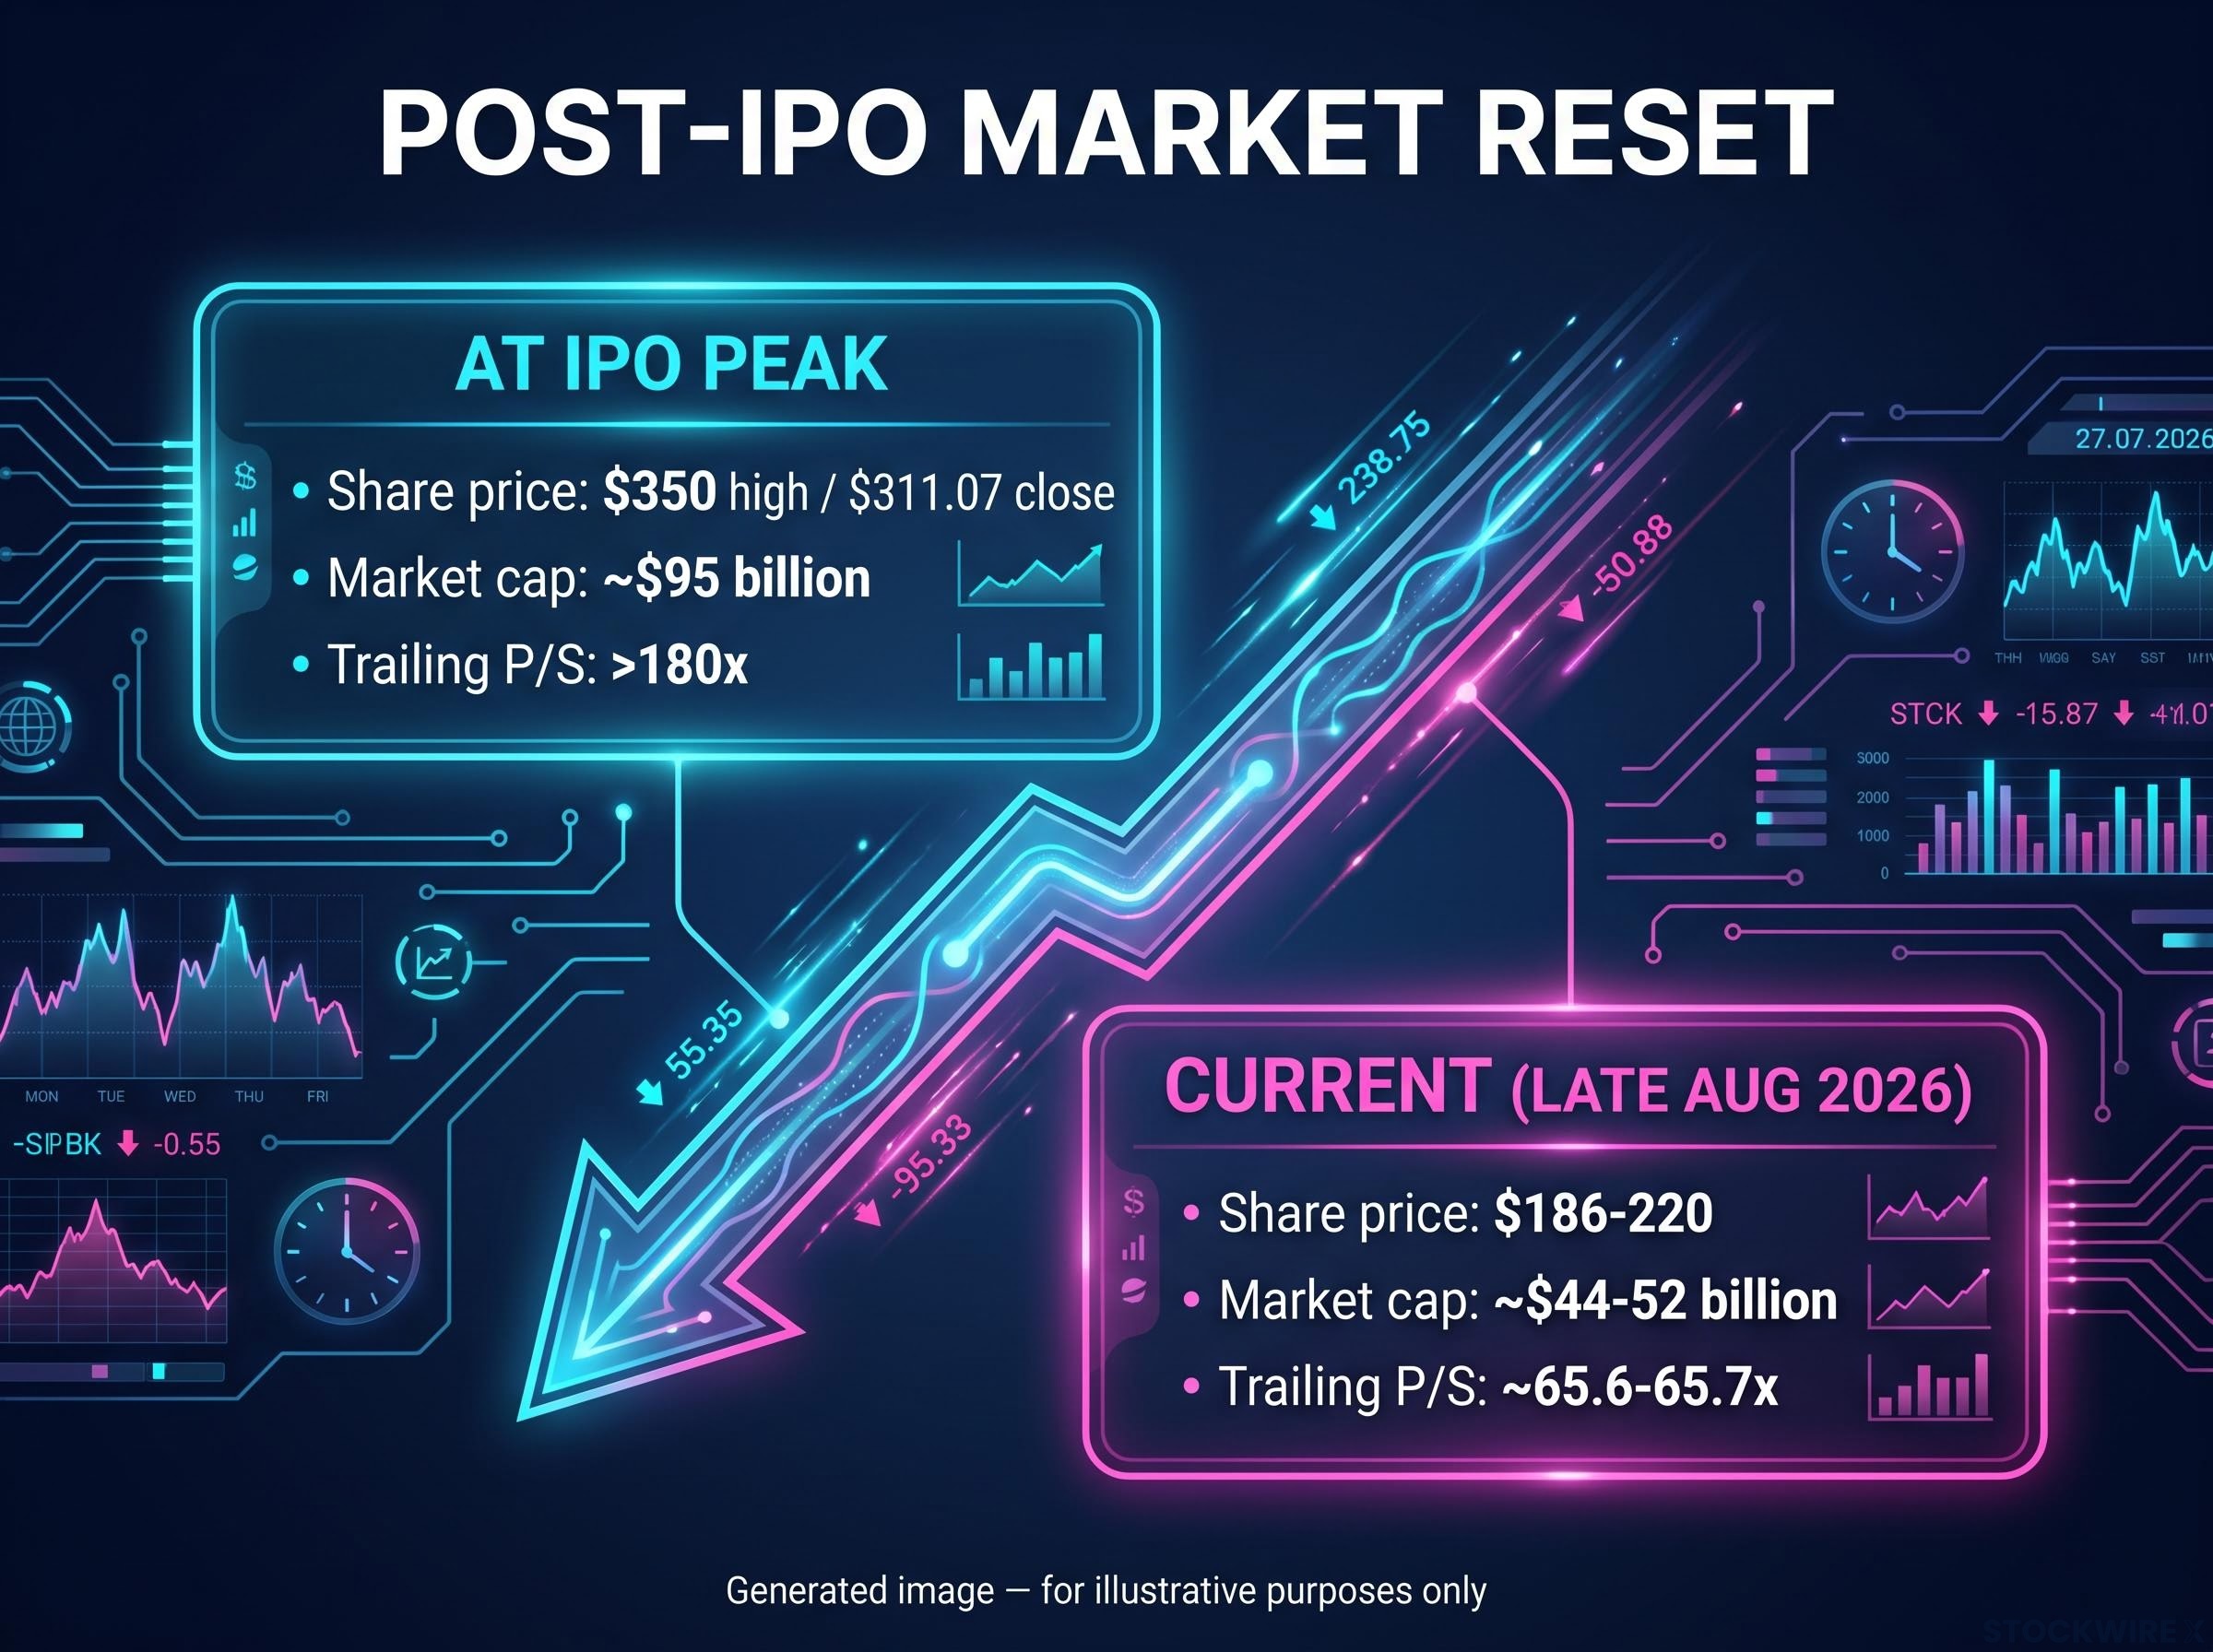
For context, here is where the numbers stood at peak versus where they sit now:
At IPO peak:
- Share price: $350 (intraday high), $311.07 (close)
- Market cap: approximately $95 billion
- Trailing revenue multiple: above 180x
Current (late August 2026):
- Share price: $186-220
- Market cap: approximately $44-52 billion (mid-$40 billions as central estimate)
- Trailing P/S: approximately 65.6-65.7x
Moving from 180x to 65x trailing revenue is not a valuation reset. It is the difference between paying for a decade of flawless execution and paying for half a decade of flawless execution. Both figures sit well above what any disciplined buyer would accept for a sub-$1 billion revenue business.
The 40% post-listing decline Cerebras experienced is structurally consistent with what research on IPO performance factors shows: companies priced at a substantial premium to peers face near-zero tolerance for execution variance, meaning ordinary quarterly shortfalls trigger compounding re-ratings rather than one-time corrections.
When big ASX news breaks, our subscribers know first
What the revenue number is actually telling you
Cerebras reported 2025 full-year revenue of approximately $510 million, up roughly 76% year over year. That growth rate is real, and it is the number most frequently cited in bullish coverage. What it does not tell you is what is inside the figure.
Starting in Q1 2026, Cerebras began including revenues tied to a data centre build-out for OpenAI in its reported figures. Under the terms of that arrangement, Cerebras constructs data centre infrastructure and recovers those costs from OpenAI with a 3% margin applied on top. These revenues inflate the reported top line without materially improving underlying economics. When you see total reported revenue, you are looking at a number that includes items where Cerebras functions as a cost-plus contractor rather than a technology vendor.
Management’s 2026 core revenue guidance of $880-890 million already strips these pass-throughs out, and that is the figure any honest valuation exercise should use.
| Revenue Metric | Trailing Figure | Forward Guidance | Analytical Implication |
|---|---|---|---|
| Total reported revenue (2025) | $510M | Higher (includes pass-throughs) | Headline figure overstates core economics |
| Core revenue (ex-pass-through) | $510M (2025) | $880-890M (2026) | The figure that matters for valuation |
| Annualised quarterly revenue | $720M ($180M × 4) | N/A | Basis for trailing SVR of approximately 71 |
| SVR | Approximately 71 (trailing) | Approximately 50 (forward) | Both figures far exceed sector benchmarks |
Customer concentration and what the backlog does (and does not) resolve
The reported backlog of $25.4 billion in Remaining Performance Obligations (RPO, the total value of contracted but not yet delivered orders) sounds like a demand story that resolves the growth question. It does not resolve the concentration question.
In 2025, approximately 86% of Cerebras’ revenue reportedly came from two UAE-linked entities, MBZUAI and G42 (this figure has not been independently verified and should be treated with appropriate caution). That level of concentration means the revenue base is structurally fragile regardless of what the backlog promises. A $25.4 billion order book improves revenue visibility, but it does not diversify the customer base, and it does not guarantee that the margins on those contracts will improve.
Services already account for approximately 42% of total revenues, carrying a 32% gross margin that drags the blended figure well below hardware-only economics. When a company’s top line is concentrated in two customers, inflated by pass-throughs, and weighted toward a lower-margin services mix, the growth rate becomes a signal that requires verification rather than a fact that justifies the price.
Margins, Nvidia, and the profitability gap that matters for valuation
At a blended level, Cerebras’ gross margin comes in at approximately 46%, and that figure rises only marginally once the low-margin pass-through activity is excluded from the calculation. That blend comes from two very different businesses running under one roof: hardware at roughly 59% gross margin and services at roughly 32%.
Nvidia, the company Cerebras is most frequently benchmarked against, currently delivers gross margins of approximately 75% and operating margins near 64%. The gap is not small. It is 29 percentage points on gross margin and the operating margin comparison is starker still, because Cerebras has not yet reported consistent operating profitability.
| Metric | Cerebras Current | Cerebras Long-Term Target | Nvidia Current |
|---|---|---|---|
| Gross margin | ~46% (blended) | 60% | ~75% |
| Operating margin | Negative/minimal | 40% | ~64% |
| SVR | ~50 (forward) | N/A | ~16.7 |
| Revenue growth (YoY) | ~76% | N/A | Strong (sector-leading) |
A company priced at several times Nvidia’s revenue multiple currently delivers less than two-thirds of Nvidia’s gross margin.
The Nvidia valuation analysis that grounds this comparison is worth examining in detail: a ten-year DCF model spanning three scenarios produces intrinsic value estimates from $73 to $738, which illustrates precisely why the margin, growth trajectory, and multiple that Cerebras is being benchmarked against are themselves contested rather than fixed reference points.
Management has stated long-term targets of 60% gross margin and 40% operating margin. Those are aspirations, not near-term guides. 2026 gross margin guidance tracks toward the low-to-mid 40% range, meaning the margin profile is moving in the right direction but remains years away from the level that would support a premium multiple.
The valuation argument is straightforward: a stock trading at several times a sector leader’s multiple should, at minimum, be approaching the sector leader’s margin profile. Cerebras is currently heading toward it, not at it. The market is pricing the destination before the company has demonstrated it can complete the journey.
Applying a valuation ratio: what a disciplined price bracket looks like
The Simple Valuation Ratio, or SVR, is a company’s market capitalisation divided by its annualised revenue. It strips valuation down to a single question: how many dollars of market value is the market assigning per dollar of revenue? For pre-earnings companies where discounted cash flow models require too many assumptions to be reliable, SVR offers a practical, replicable alternative that any investor can calculate with public data.
Here is the three-step process:
- Find annualised revenue. Use either the most recent quarterly revenue multiplied by four (trailing SVR) or forward revenue guidance (forward SVR). For Cerebras, the 2026 core revenue guidance midpoint of approximately $885 million is the more appropriate base.
- Choose your SVR ceiling. The benchmark SVR for a broad basket of high-growth technology stocks sits at roughly 8, with Nvidia at approximately 16.7. Applying scalar multiples of that baseline (such as 3x, 4x, or 5x) produces a set of structured, defensible price ceilings.
- Derive implied market cap and per-share price. Multiply the SVR ceiling by annualised revenue, then divide by shares outstanding (approximately 220-238 million for Cerebras) to get an implied share price.
The SVR framework applied here is one entry point into growth-expectation analysis; the implied growth rate embedded in any share price converts the market cap into a concrete forward revenue demand the company must meet, which is the more granular stress test that disciplined buyers apply before committing capital.
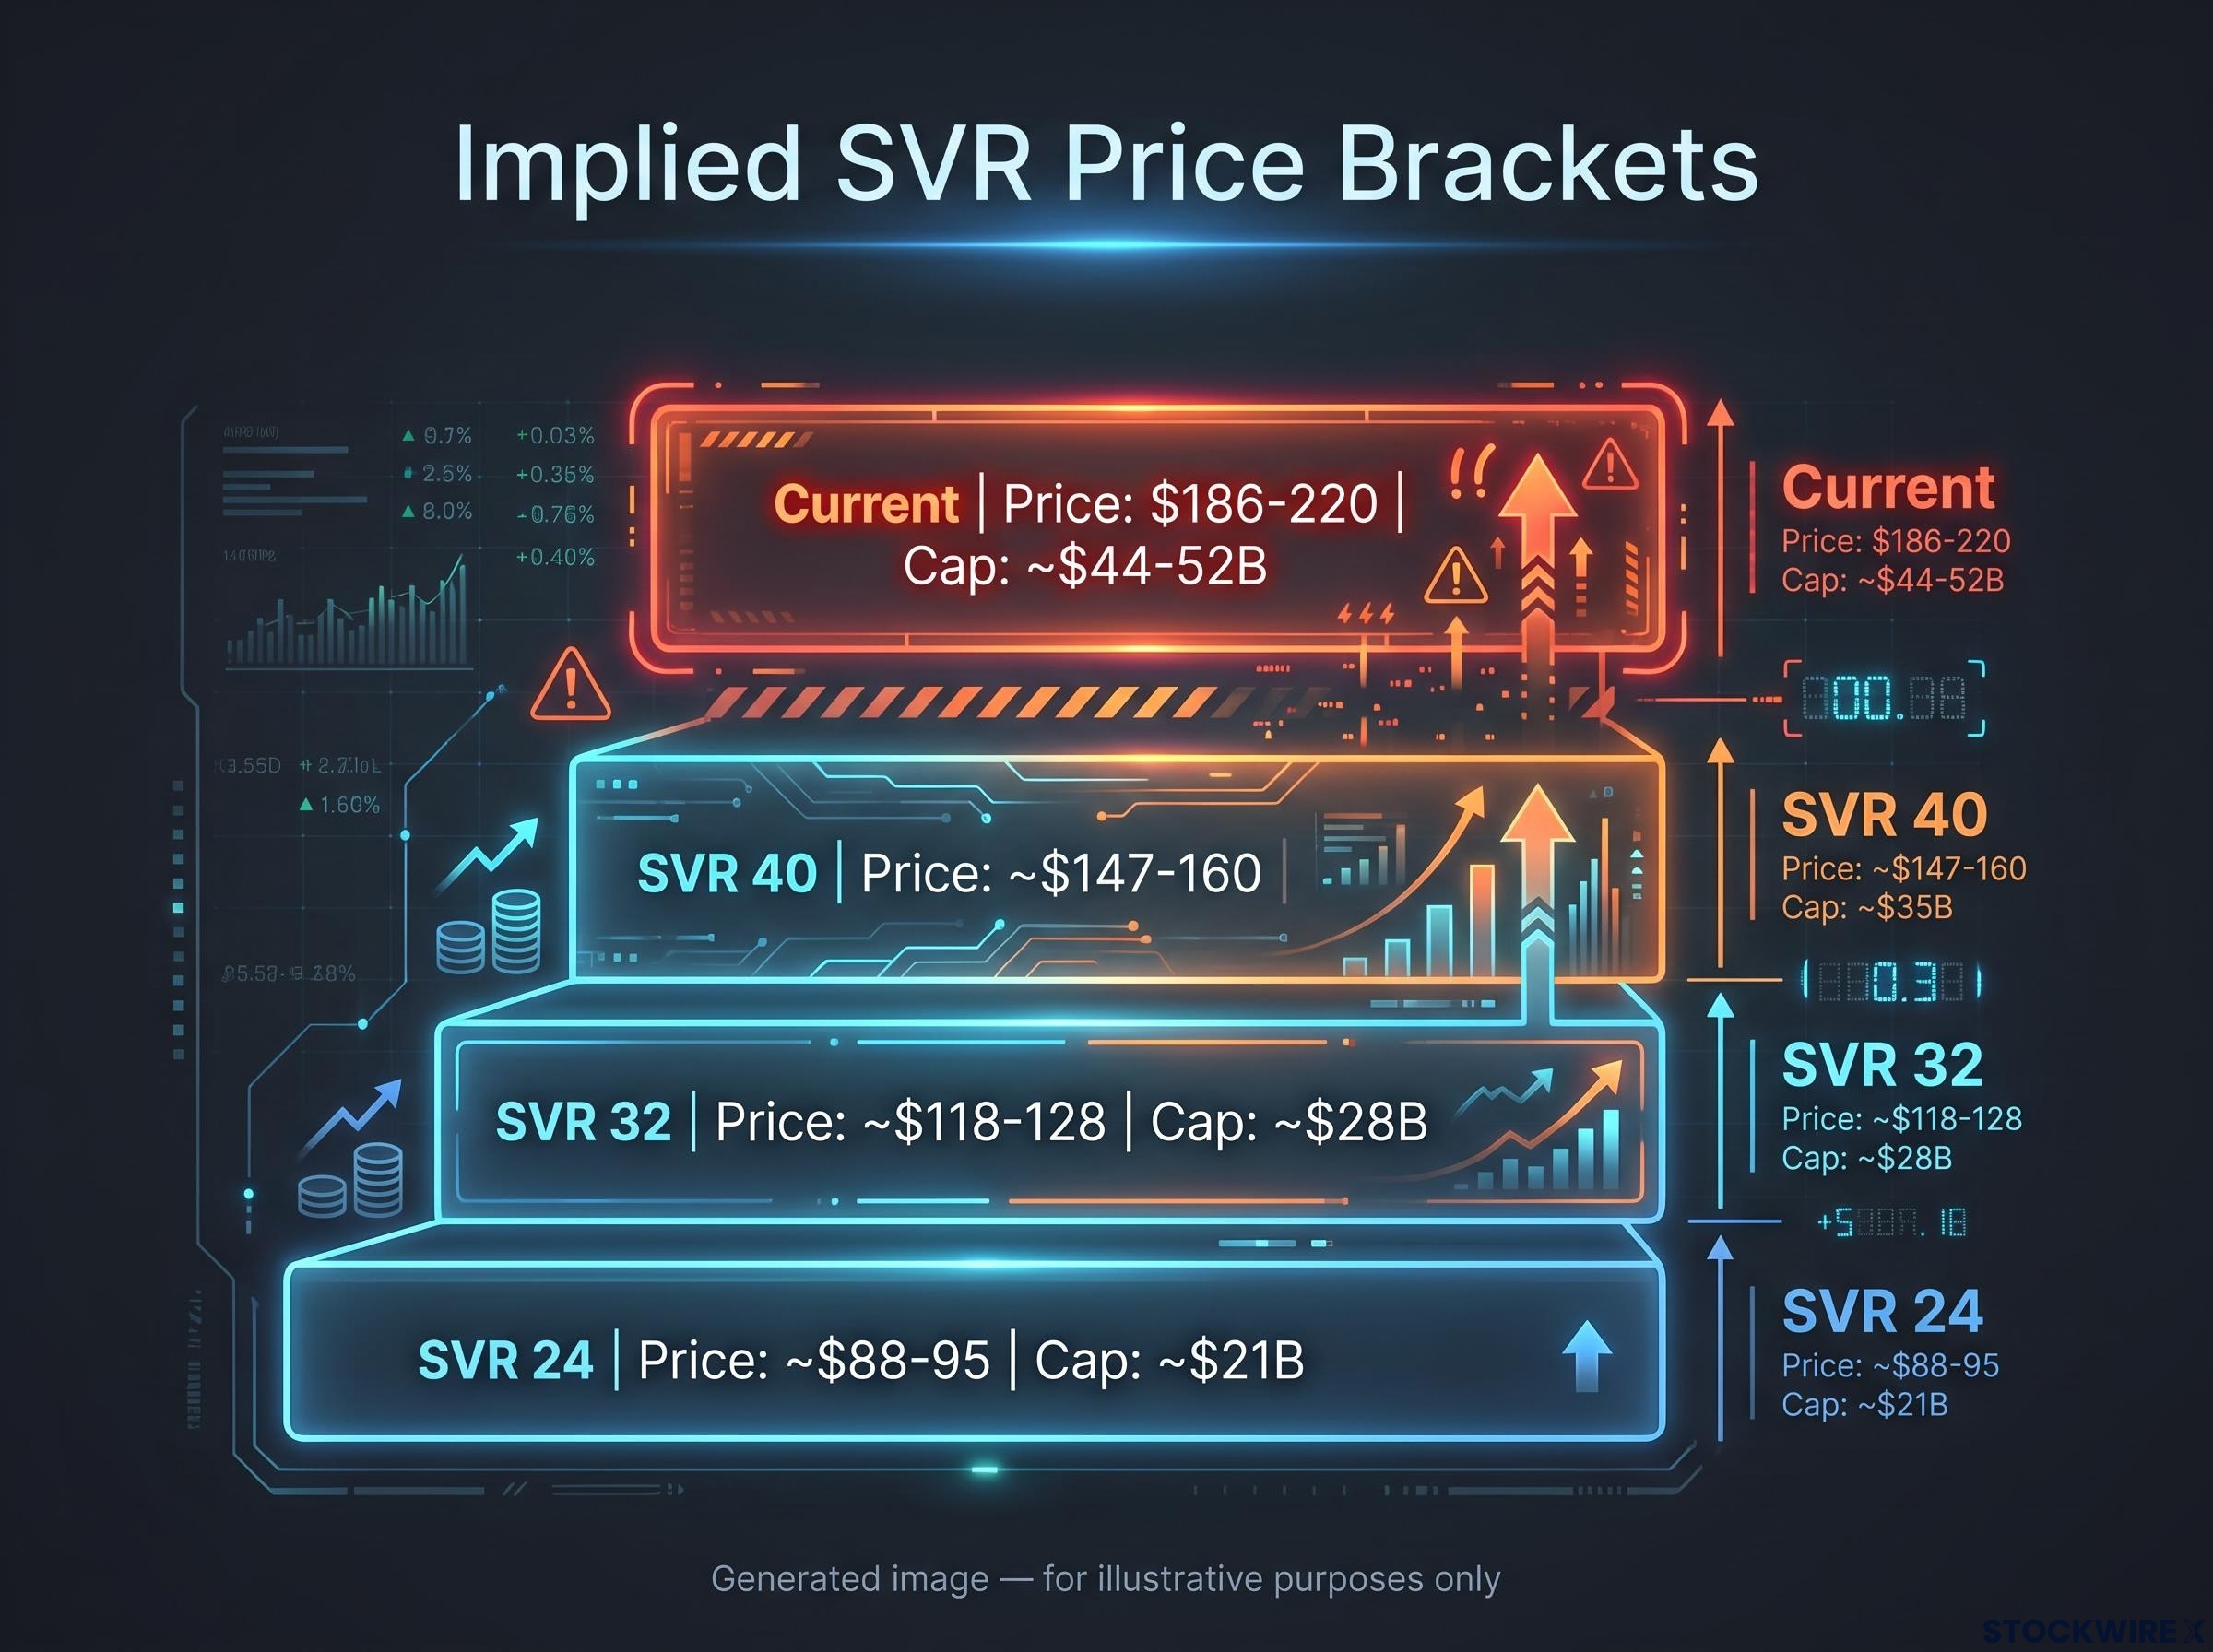
| SVR Level | Rationale | Implied Market Cap | Implied Share Price | Gap to Current Price |
|---|---|---|---|---|
| SVR 24 | 3× catalogue average | ~$21B | ~$88-95 | ~55-60% below $186-220 |
| SVR 32 | 4× catalogue average | ~$28B | ~$118-128 | ~35-42% below $186-220 |
| SVR 40 | 5× catalogue average | ~$35B | ~$147-160 | ~14-27% below $186-220 |
| Current | Forward SVR ~50 | ~$44-52B | $186-220 | Above all SVR ceilings |
At a forward SVR of approximately 50, the stock is trading at roughly double the level where a disciplined valuation framework would place its upper ceiling. An SVR of 24 (three times the broad technology benchmark) is the point at which a buyer begins paying for growth that has not yet been delivered; the current price sits far above that threshold. One independent fair-value analysis, which has not been independently verified, triangulates to a $100-130 per share band, directionally corroborating the SVR framework’s conclusion.
The post-IPO filing discipline reinforces the point. The 40% decline between IPO day and the first 10-Q filing is a concrete example of what happens when price discovery is deferred. The data shows that holding off until a company has lodged at least one quarterly report with the SEC is not excessive caution; it is a straightforward, evidence-backed discipline.
What it would take for the current price to make sense
The bull case for Cerebras is not imaginary. The company has real technology differentiation in wafer-scale AI chip design. Revenue grew 76% year over year in 2025. The reported backlog of $25.4 billion supports a multi-year demand story. The AI infrastructure market genuinely needs alternatives to Nvidia’s dominance.
- Real technology differentiation in wafer-scale chip architecture
- 76% year-over-year revenue growth in 2025
- $25.4 billion reported backlog supporting multi-year visibility
None of that is in dispute. The question is whether those factors justify a $44-52 billion market cap today.
Consider the optimistic scenario: Cerebras reaches $3 billion in high-margin core revenue by 2029, with gross margins at the company’s stated 60% long-term target. At today’s market cap of roughly $48 billion (midpoint), that $3 billion revenue figure would imply a 2029 SVR of approximately 15-17x. That is Nvidia’s current multiple, not a growth premium above it.
Even if Cerebras reaches $3 billion in high-margin core revenue by 2029, today’s market cap implies a 2029 SVR of approximately 15-17x. That is Nvidia’s current multiple, not a growth premium.
The buyer at $200 today is paying for a scenario where everything goes right over three-plus years, customer concentration reduces, margins expand by 14 percentage points on the gross line, and AI infrastructure competition does not erode pricing power. If all of that happens, the reward is arriving at a multiple that Nvidia already trades at today, a company with 75% gross margins, 64% operating margins, and a vastly larger revenue base.
Investing in a good company and investing in a good stock at a good price are different decisions. The SVR framework exists precisely to hold them apart. The post-IPO decline from above $350 to the $186-220 range is a real-time lesson in what happens when that distinction collapses.
Cerebras the company versus Cerebras the stock
Four analytical layers point in the same direction. The valuation gap survived a 40% post-IPO decline and remains extreme at 65x trailing revenue. The headline revenue figure includes pass-through items and relies on two customers for the overwhelming majority of its base. The margin profile sits well below the sector leader whose multiple Cerebras trades at several times over. And the SVR price brackets show that the current price of $186-220 sits above even the most generous disciplined ceiling at SVR 40.
At a forward SVR of 24, which corresponds to approximately $88-95 per share based on 2026 core revenue guidance, the stock would reach a level where the entry price carries a genuine margin of safety relative to demonstrated fundamentals. At $186-220, no such margin exists. That gap implies approximately 55-60% downside to that entry point. One independent analysis, not independently confirmed, places fair value in the $100-130 band, directionally consistent with the framework.
The concept of margin of safety is the structural reason why the SVR ceiling matters: a disciplined buyer does not pay the intrinsic value estimate but rather a price meaningfully below it, ensuring that estimation errors and execution shortfalls do not eliminate the investment thesis before the underlying business has a chance to deliver.
Even at the right price, a buyer would want to see specific conditions met before committing capital:
- Gross margin clearly trending toward 60% on a sustained basis, with quarterly results confirming the trajectory rather than merely pointing to a long-term aspiration
- Customer revenue distribution shifting materially, with no single entity or related group accounting for anything close to the reported 86% share
- A track record of at least two post-IPO quarterly filings, establishing enough operational history to assess execution reliability
- Pass-through revenues consistently and transparently ring-fenced from core revenue in all reported financial results
Cerebras is building real technology for a real market. That makes it a company worth watching. It does not, at this price, make it a stock worth owning. The framework above works for Cerebras today and for the next AI IPO that trades at 50x forward revenue on listing day. The principle does not change: know the price at which the company’s demonstrated economics justify a position, and do not pay more than that.
This article is for informational purposes only and should not be considered financial advice. Investors should conduct their own research and consult with financial professionals before making investment decisions. Past performance does not guarantee future results. Financial projections are subject to market conditions and various risk factors.
—