Goods prices have cooled. Core CPI came in at just 2.6% in September 2026. Yet the slice of inflation the Federal Reserve watches most closely for domestic pressure, the CPI “supercore”, ran at 3.2%. That gap is the clearest sign that sticky services inflation, not goods, now decides how quickly US rates can fall.
The economy behind that gap is not slowing. Real GDP grew 3.4% annualised in the third quarter, and business equipment investment jumped 20.9%, much of it tied to AI infrastructure.
TD Securities economists Oscar Munoz and Eli Nir argue that this mix of AI-linked capital spending and resilient services demand makes a smooth return to the Fed’s 2% target unlikely. Their view was relayed by FXStreet on 30 October 2026, two days after the Fed held its target range at 3.75%-4.00% on a 10-2 vote. Both dissenters wanted a hike.
Here is why services prices are proving so stubborn, what TD expects the Fed to do next, and how that could flow through to Treasury yields and equity valuations.
What is TD Securities arguing, and what does it expect from the Fed?
TD’s case runs as a chain, and each link matters. AI-related capital spending and a resilient consumer drove third-quarter growth. That growth helps the economy in the near term, but it keeps demand running hot in services, which TD says is keeping supercore inflation elevated.
The economists separate goods from services. Real goods spending has largely normalised, in TD’s assessment, while real services spending has not. Setting energy and tariffs aside, persistent services price pressure is the problem the Fed still has to solve.
TD does not expect the consumer to keep sprinting. September was weak, which leaves little momentum carrying into the fourth quarter, and October spending appears to be settling after a strong summer.
| Measure | TD Securities view |
|---|---|
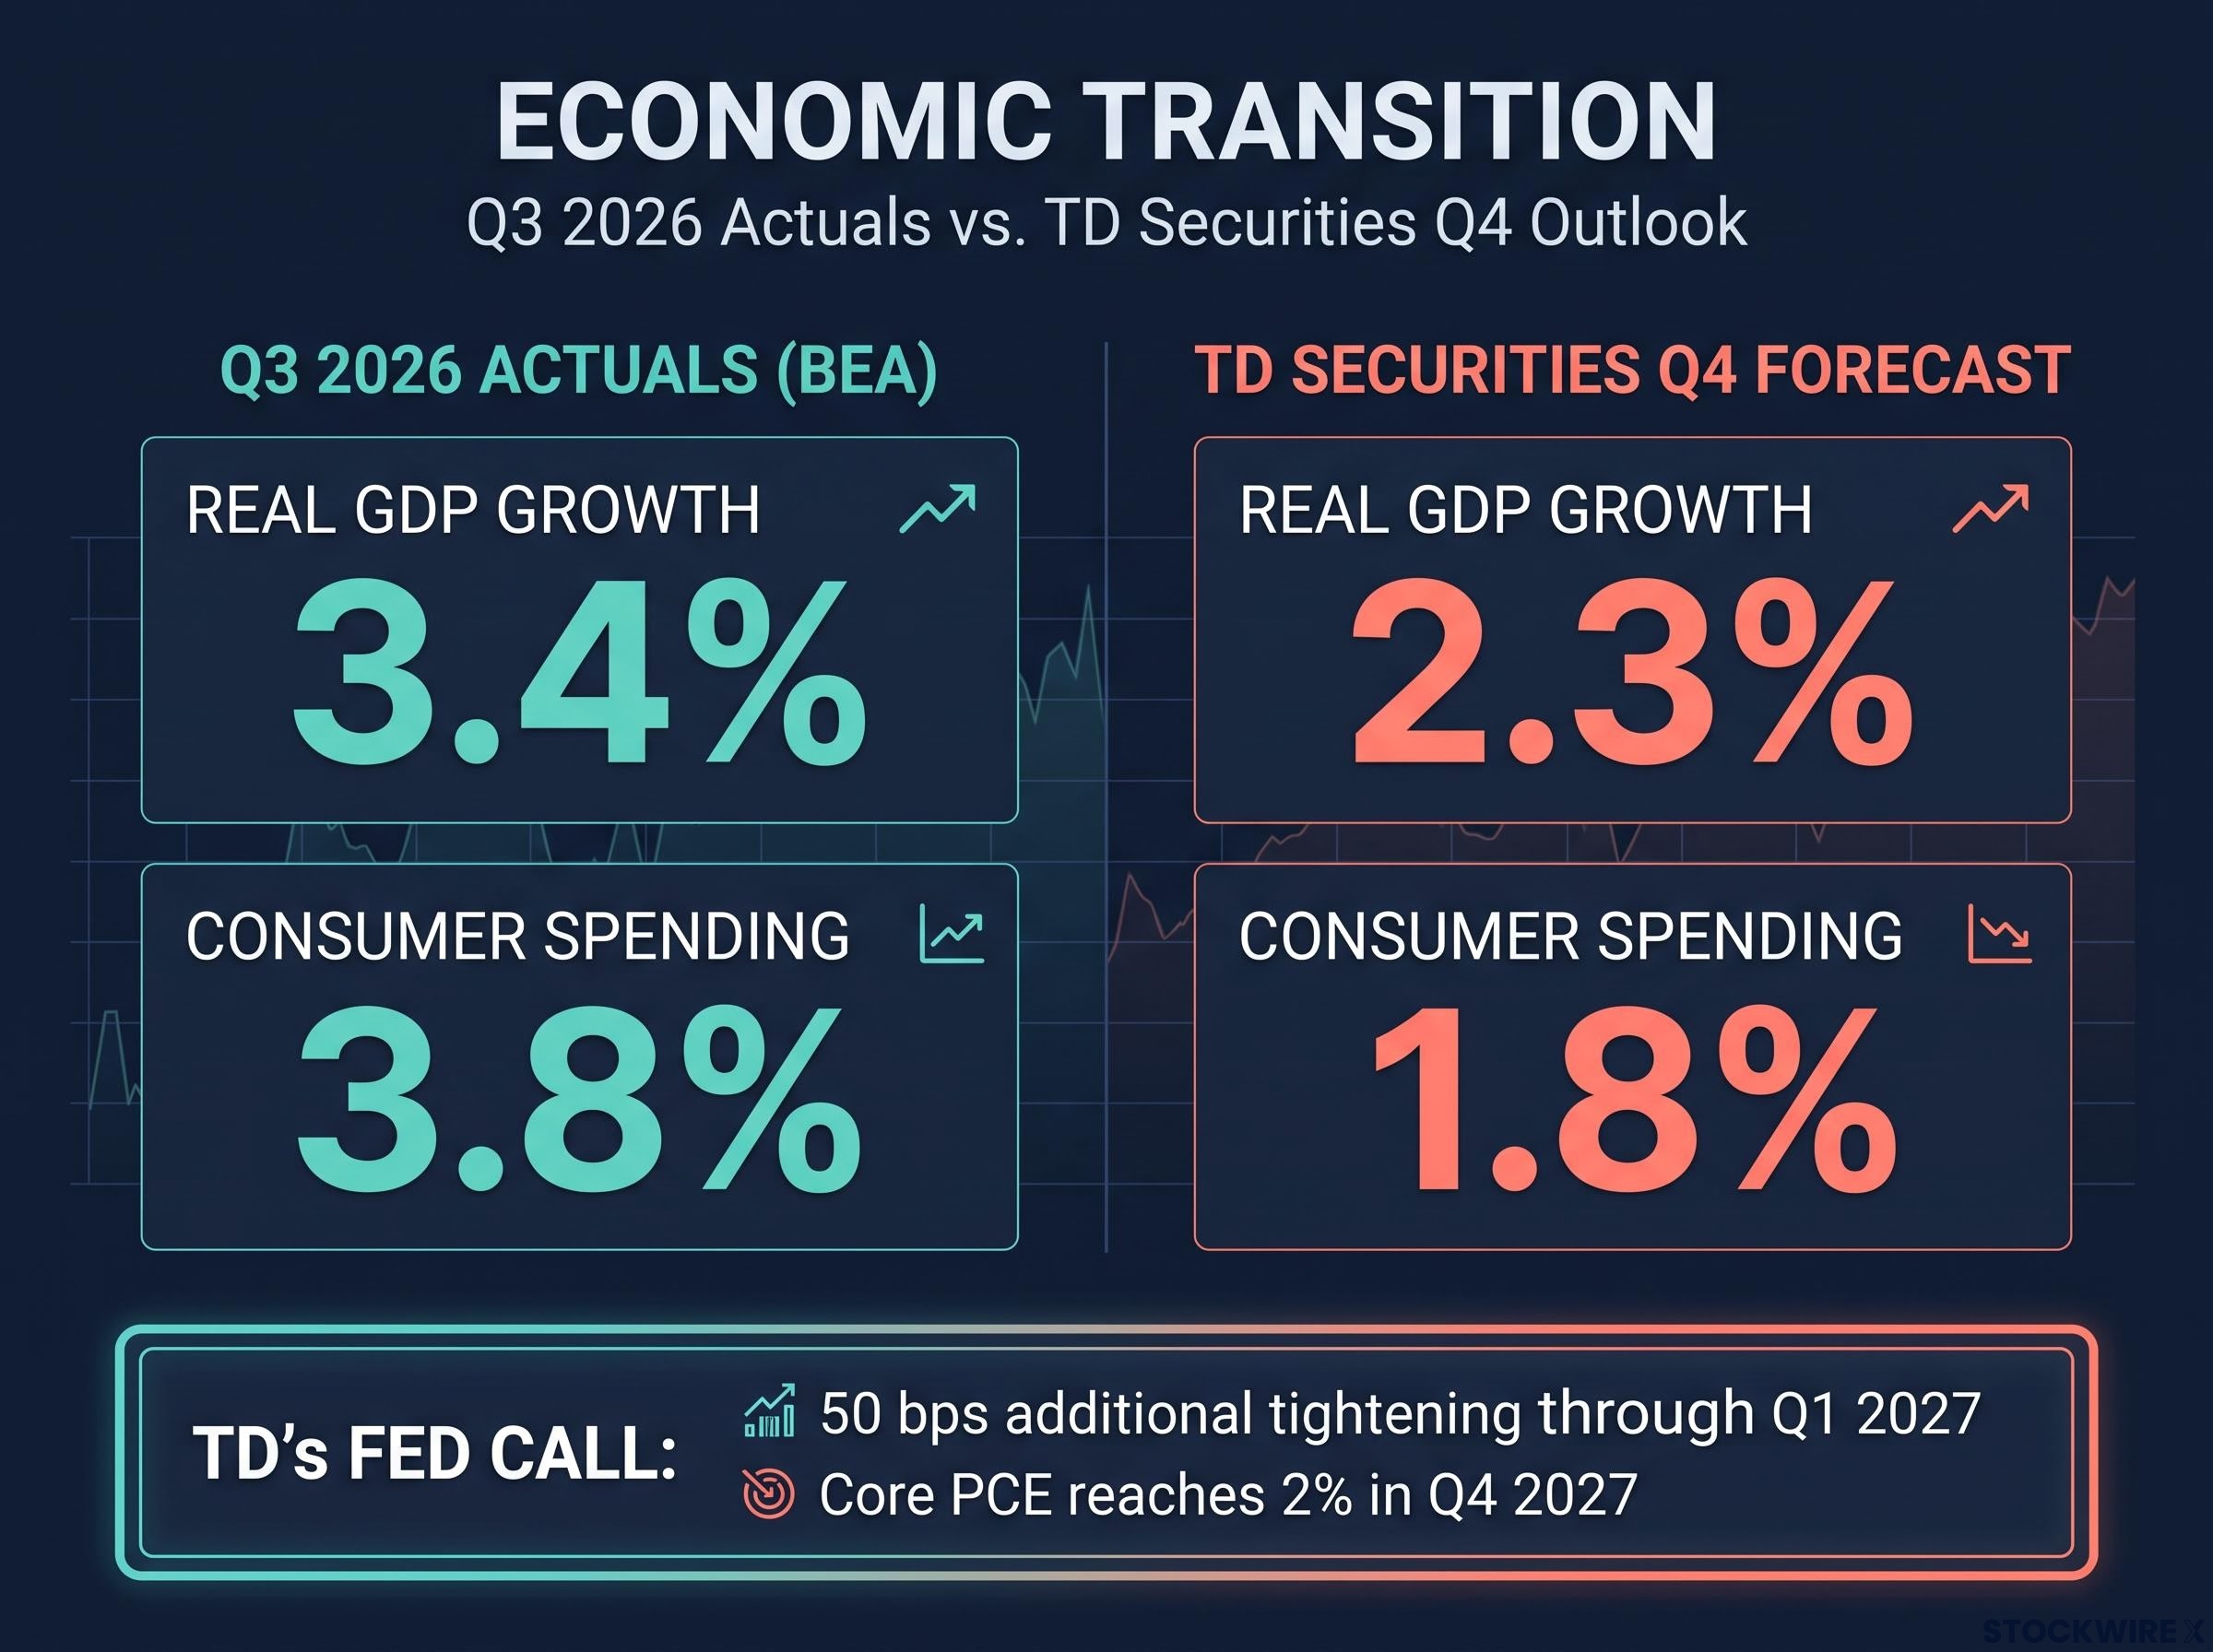
| Q4 real consumer spending growth | 1.8% annualised |
| Q4 real GDP growth | 2.3% annualised (trend-like) |
| Additional Fed tightening | 50 bps through Q1 2027 |
| Core PCE reaching 2% | Q4 2027 |
Source: TD Securities, relayed by FXStreet, 30 October 2026.
TD’s Fed call
The conclusion follows from the chain. If financial conditions stay broadly supportive, TD expects demand to hold up and inflation to stay above target, so the Fed will likely need another 50 basis points of tightening (a basis point is one hundredth of a percentage point) between now and Q1 2027.
TD’s separately published forecast, updated on 26 October 2026, made the same point more bluntly: a “one and done” hike would not sufficiently reinforce the Fed’s inflation commitment.
For you, the point is that TD is not predicting a boom. It is arguing that even trend-like growth is still too strong to bring services inflation down on its own. These are forecasts, and past performance does not guarantee future results.
When big ASX news breaks, our subscribers know first
What do the Q3 numbers and the AI spending boom actually show?
The Bureau of Economic Analysis (BEA) advance estimate, released on 29 October 2026, gives TD’s thesis much of its weight.
What BEA reported
| Q3 2026 measure | Result |
|---|---|
| Real GDP growth | 3.4% annualised |
| Consumer spending | 3.8% annualised |
| Business equipment investment | +20.9% annualised |
| Information-processing equipment | +37.4% |
| Industrial equipment | +24.7% |
Equipment investment added 1.16 percentage points to growth, the largest contribution in six years, according to Reuters. Information-processing equipment, which includes computers and peripherals tied to AI infrastructure, led the surge, although part of that figure reflects imports.
On the consumer side, healthcare, hospitals and outpatient care, and food services and accommodation drove spending. Those are precisely the labour-heavy services where prices tend to move slowly.
Why AI spending can push prices up
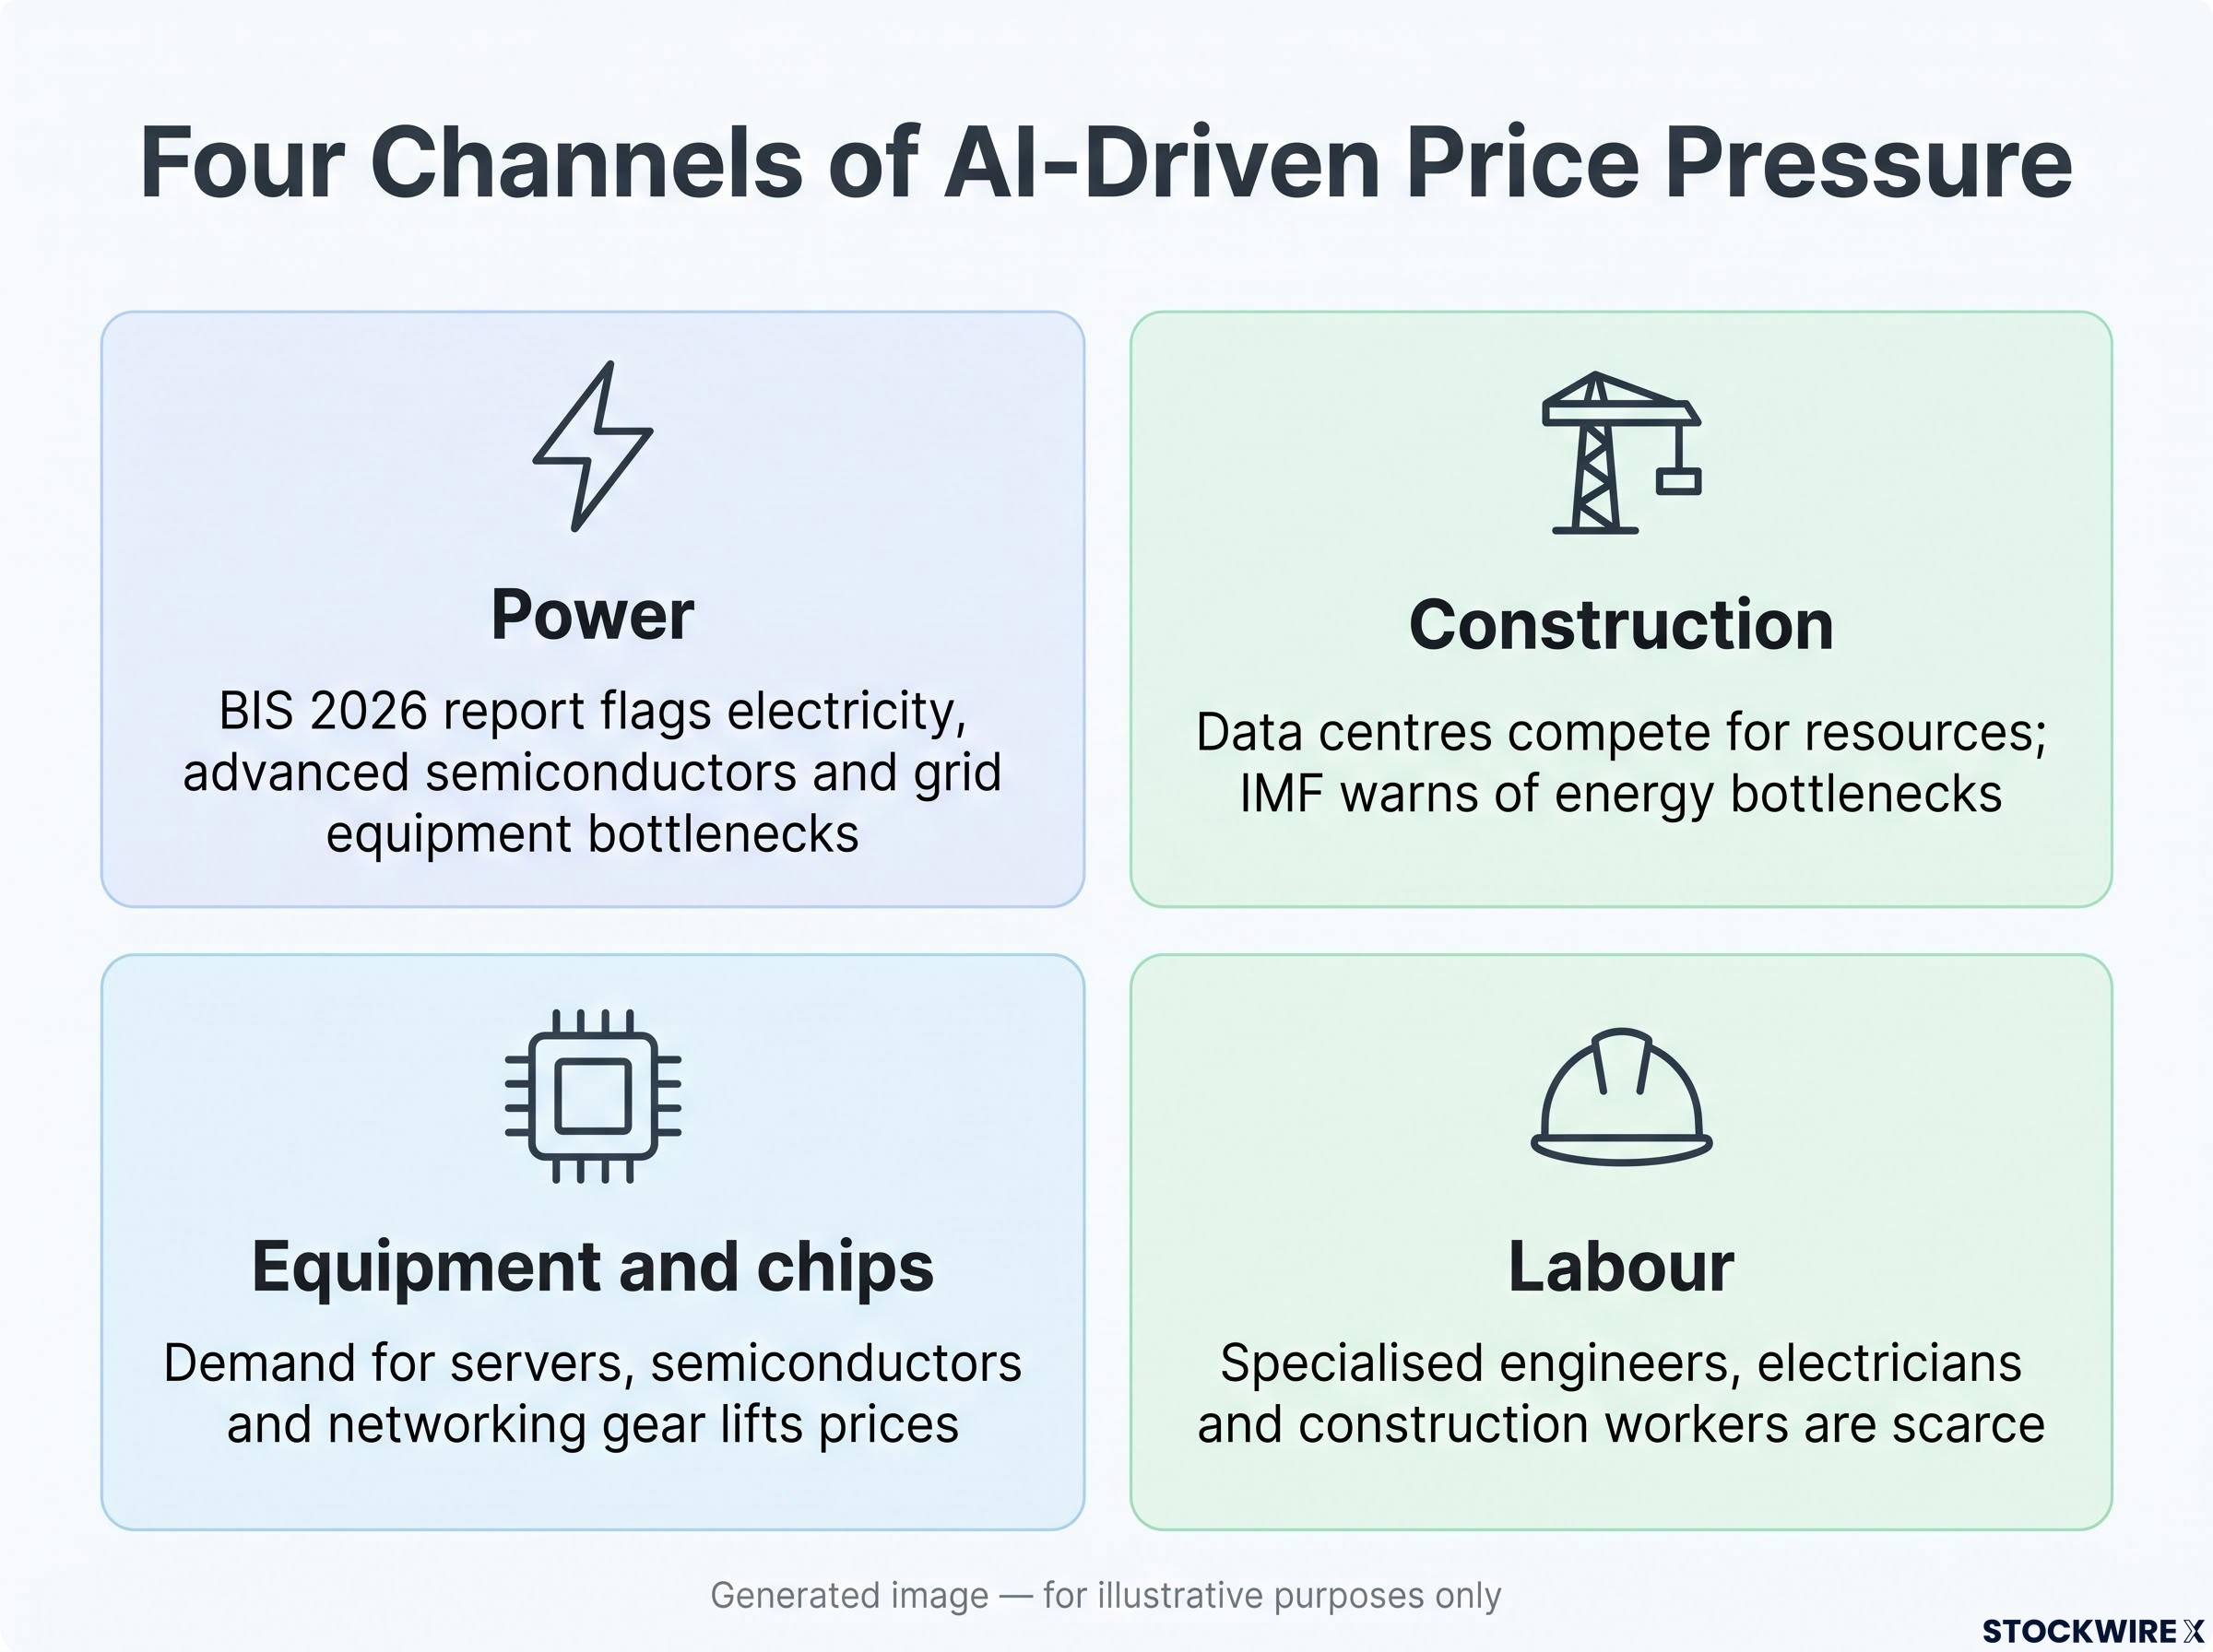
The mechanism is timing. Building AI capacity creates demand immediately, while any efficiency gains arrive later and remain uncertain. The pressure points fall into four channels:
- Power: The Bank for International Settlements (BIS) 2026 annual economic report flags electricity, advanced semiconductors and grid equipment as emerging bottlenecks that raise power prices and input costs.
- Construction: Data centres compete for land, engineers, contractors and transformers. The International Monetary Fund (IMF) has warned that energy bottlenecks could anchor core inflation at a higher level.
- Equipment and chips: Demand for servers, semiconductors and networking gear can lift prices and pull resources from other industries.
- Labour: Specialised engineers, electricians and construction workers are scarce, so wage pressure can spill into other sectors.
IMF chief economist Silvana Tenreyro argued in research reported in August 2026 that investment and household spending can run ahead of productivity, creating supply shortages that force rates higher.
The data has a limit, though. BEA does not isolate AI as a GDP category, so the AI share of growth is inferred rather than measured. This tells you that part of today’s inflation pressure comes from the build-out itself, not from AI’s eventual payoff.
AI infrastructure investment is now large enough to shape the Fed’s reaction function, since the central bank has no reliable model yet for separating a lasting growth engine from front-loaded demand that eventually fades.
Why does sticky services inflation resist higher rates?
Look at September’s inflation screen and one number refuses to behave. Headline CPI was 3.7%, core CPI was 2.6%, but supercore sat at 3.2%, rising 0.3% in the month alone.
Supercore is core services inflation excluding shelter. It strips out volatile food and energy, goods and housing costs to isolate prices set mainly by domestic demand and wages. Policymakers watch it because it shows whether inflation is being generated at home rather than imported.
Headline readings can mislead in both directions, and headline inflation distortions from gasoline spikes and one-off wireless price jumps are a reminder of why supercore and core measures carry more weight in policy decisions.
| Measure | September 2026 reading | Source |
|---|---|---|
| Headline CPI, y/y | 3.7% | BLS |
| Core CPI, y/y | 2.6% | BLS |
| CPI supercore, y/y | 3.2% | Gianluca Benigno analysis of BLS data |
| Core PCE, y/y | 3.1% | BEA |
| Core PCE services ex-housing, y/y | 3.6% | 247WallSt, reporting BEA data |
Core PCE (personal consumption expenditures) is the Fed’s preferred inflation gauge. Its services-ex-housing component at 3.6% tells the same story as supercore from a different angle.
TD links this to spending patterns: goods demand has normalised, while services demand remains above its pre-pandemic path. That assessment is qualitative, as no numerical measure of the gap was available. Six structural reasons help explain why services prices adjust so slowly:
- Labour intensity: Healthcare, hospitality and personal services cannot easily swap workers for machines, so wages pass straight into prices.
- Shelter lags: Rents and leases reset gradually, so softer new-tenant rents take time to show up.
- Insurance and healthcare: Premiums, medical care and repair costs have risen sharply and respond little to interest rates.
- Wealth effects: Households with equity gains keep spending on travel, restaurants and entertainment despite higher borrowing costs.
- AI spillovers: Data-centre investment lifts demand for construction, utilities and engineering, supporting wages outside tech.
- Slow adjustment: The services sector responds only gradually to tightening.
Reuters captured that last point in economist Reinhart’s description of the sector:
The large US services sector continues to “trundle along,” adjusting only slowly to tighter policy.
KPMG chief economist Diane Swonk added that the PCE details showed persistent inflation, particularly in services. You should read a 3.2% supercore print as a sign that domestic, wage-sensitive pricing is not yet cooling, whatever the headline does.
Is TD’s view the consensus, or is AI a disinflationary force?
The surprising thing about this debate is how much the sides agree on. Almost nobody disputes that AI could eventually lower inflation. The fight is over when.
| View | Who holds it | Core argument |
|---|---|---|
| AI becomes disinflationary | Fed Chair Kevin Warsh; Governor Lisa Cook | Productivity lifts output per worker and lowers unit labour costs, over time |
| Demand arrives first | TD; Tenreyro (IMF); Cook | Spending and bottlenecks precede productivity gains |
| Demand may cool | Reuters reporting | Heavy AI borrowing and an uncertain payoff could stall equipment investment |
| Policy could overshoot | Reuters; some Fed commentators | Hikes hit housing and non-AI firms while cash-rich tech is insulated |
Warsh has described AI investment as a shock to prices and demand, while expecting productivity and wealth benefits later. Cook sits on both sides of the timing question: she sees possible disinflation eventually but worries that supply bottlenecks arrive first.
The cooling case deserves weight. If equipment investment slows, a major growth engine disappears, and rate hikes could slow housing and smaller businesses without quickly resolving services pressure.
Where the Fed itself stands
The 28 October statement said inflation “remains elevated” and upgraded its description of activity to a strong pace. Cook and Cleveland Fed President Beth Hammack dissented in favour of a 25 bp hike.
Economists are leaning the same way. A Reuters poll reported on 28 October found 94 of 100 expected the October hold, and every respondent expected a December hike. Rate cuts remain possible later if productivity expands supply, though TD does not see core PCE at 2% until Q4 2027.
This means you should treat a further hike as a live scenario with real institutional support, not a fringe forecast.
What could this mean for yields, equities and rate expectations?
History does not repeat neatly, but two episodes offer a useful frame.
The late-1990s parallel
The late-1990s technology boom is the closest precedent for investment-led growth built on productivity optimism. It powered strong GDP, rising equity valuations and heavy demand for capital goods. The lesson came at the end: when investment ran too far, tighter financial conditions exposed weak projects and equities corrected sharply.
The 2022-2024 services lesson
After the pandemic, goods inflation fell quickly once supply chains healed, while services inflation lagged because of wages, rents and contracts. That mirrors TD’s split between normalised goods and excessive services demand. A falling headline number did not guarantee a quick return to 2%, and yields stayed elevated while core services stuck.
Translated into scenarios rather than forecasts, the implications look like this:
- Equities: AI leaders can keep outperforming, but concentration and valuation risk rise. If rate cuts are delayed, restrictive policy can compress valuations.
- Bonds: Stronger growth and sticky inflation tend to push Treasury yields higher, especially at short and intermediate maturities.
- Rates: The Fed may need to stay restrictive for longer, even if tech looks resilient.
The current data fits this frame uncomfortably well. With GDP at 3.4%, consumption at 3.8% and supercore near 3.2%, the demand slowdown needed for a smooth return to target has not yet arrived. These scenarios are speculative and subject to change as data develops.
For your portfolio, the key variable is how long restrictive rates last, since that drives how bond yields and equity valuations adjust.
For investors weighing a longer restrictive period, defensive portfolio positioning typically means shortening bond duration, tilting equities toward quality large caps over high-beta tech, and holding tactical cash to preserve flexibility.
Three signals that will show whether TD’s tightening call holds
TD’s case rests on two pillars: strong AI investment and services demand that refuses to cool. Few dispute the direction; the timing is the argument. The December FOMC meeting is the next decision point, with Reuters-polled economists unanimously expecting a hike.
Watch these three signals:
- Supercore and core PCE services readings: Sustained prints above 3% would support TD’s 50 bps call through Q1 2027.
- Q4 consumer spending: Whether it moderates toward TD’s 1.8% forecast or keeps running hot.
- Equipment investment: Whether AI-linked spending holds up or begins to fade.
Two caveats apply. TD’s note reached the public via FXStreet rather than directly, and BEA does not isolate AI spending. You can use these three signals to judge whether markets are underpricing the risk of a longer restrictive period.
This article is for informational purposes only and should not be considered financial advice. Investors should conduct their own research and consult with financial professionals before making investment decisions.