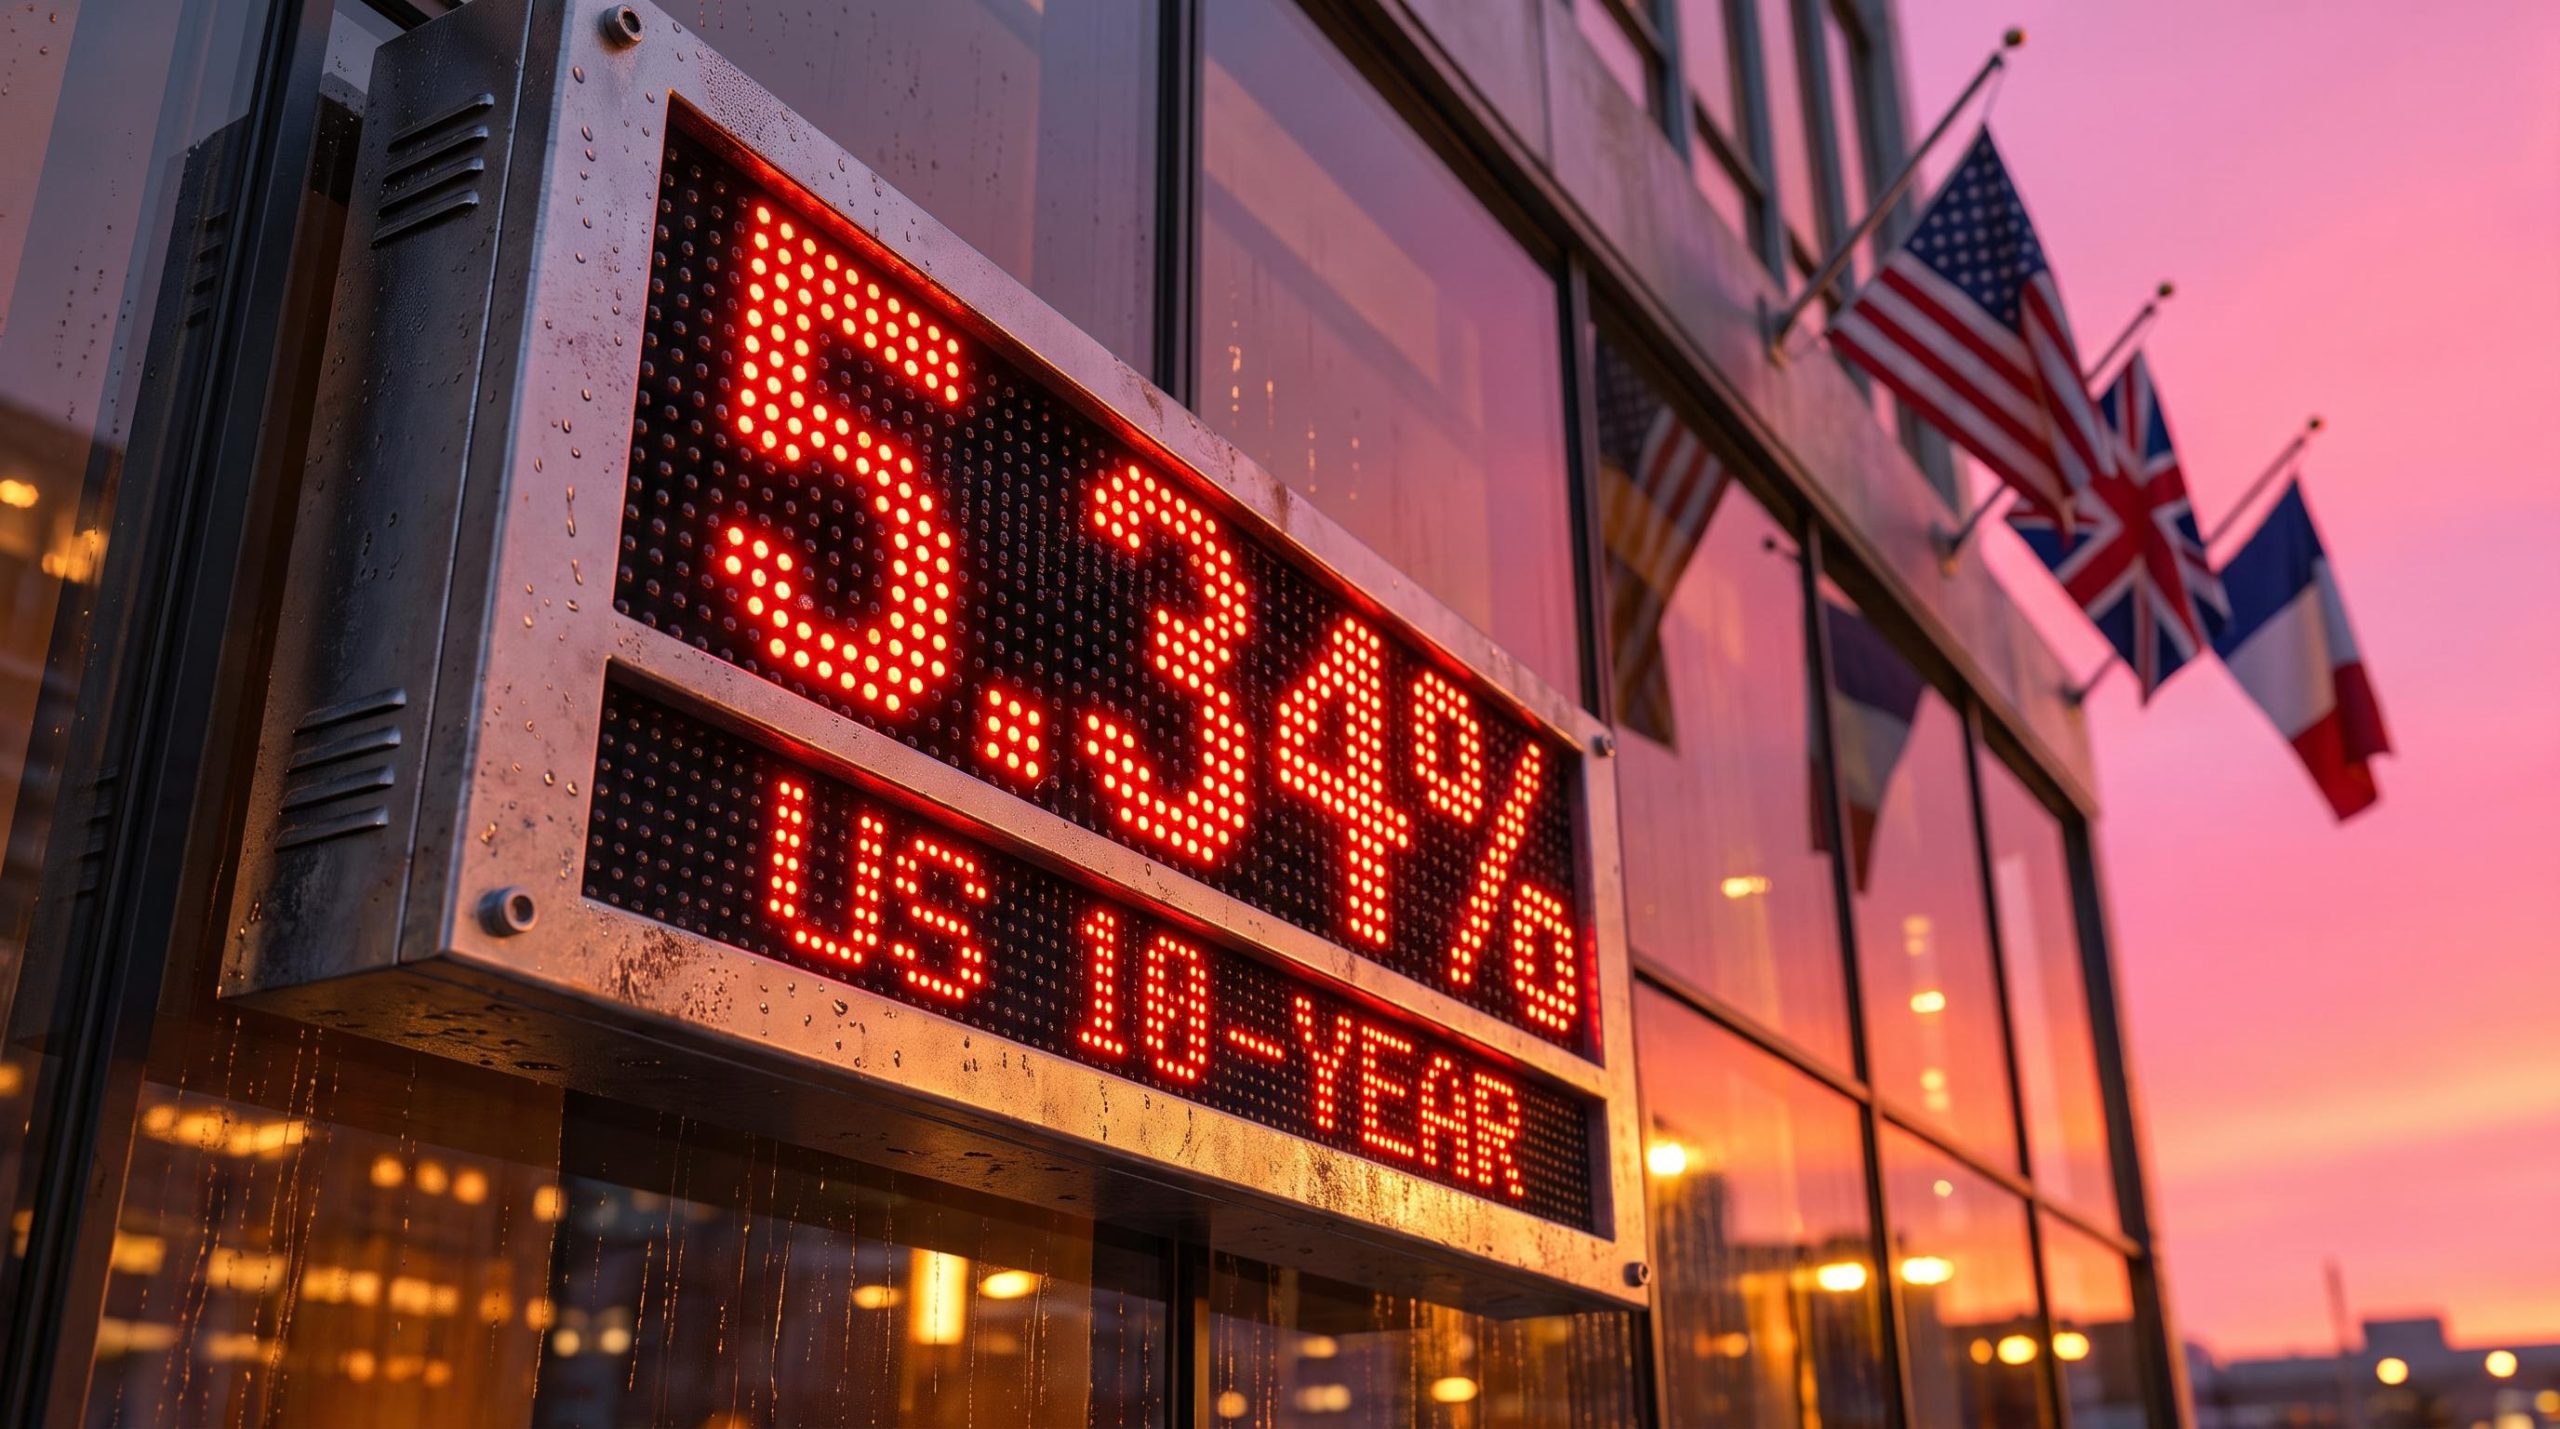
A clean chart pattern looks like a self-contained signal. Right now it is not. The 10-year Treasury yield is sitting near 5.29%, above its 2007 high of about 5.289%, and that rate backdrop may matter more to any head and shoulders trading strategy than where the neckline is drawn.
Drew Dosek of Verified Investing has flagged inverse head and shoulders setups in SpaceX (SPCX), Constellation Energy (CEG), Micron (MU) and SanDisk (SNDK). These patterns are forming as bond yields reach their highest levels since 2002, by his reading.
The opportunity is a repeatable method for setting targets and exits. The risk is trading breakouts without checking whether rising rates are about to pull valuations lower underneath them.
All ticker-level prices and targets below come from Dosek’s recent ProCharts video. Treat them as one analyst’s claims, not verified facts. You will come away with a measured-move formula, an invalidation rule and a rate-risk check you can apply to any chart.
How do you calculate a head and shoulders measured-move target and invalidation point?
The calculation
A head and shoulders pattern is a reversal shape with three peaks: a higher middle peak (the head) between two lower ones (the shoulders). The neckline is the line joining the low points between them. The inverse version flips the shape upside down and signals a possible move higher.
The arithmetic takes four steps:
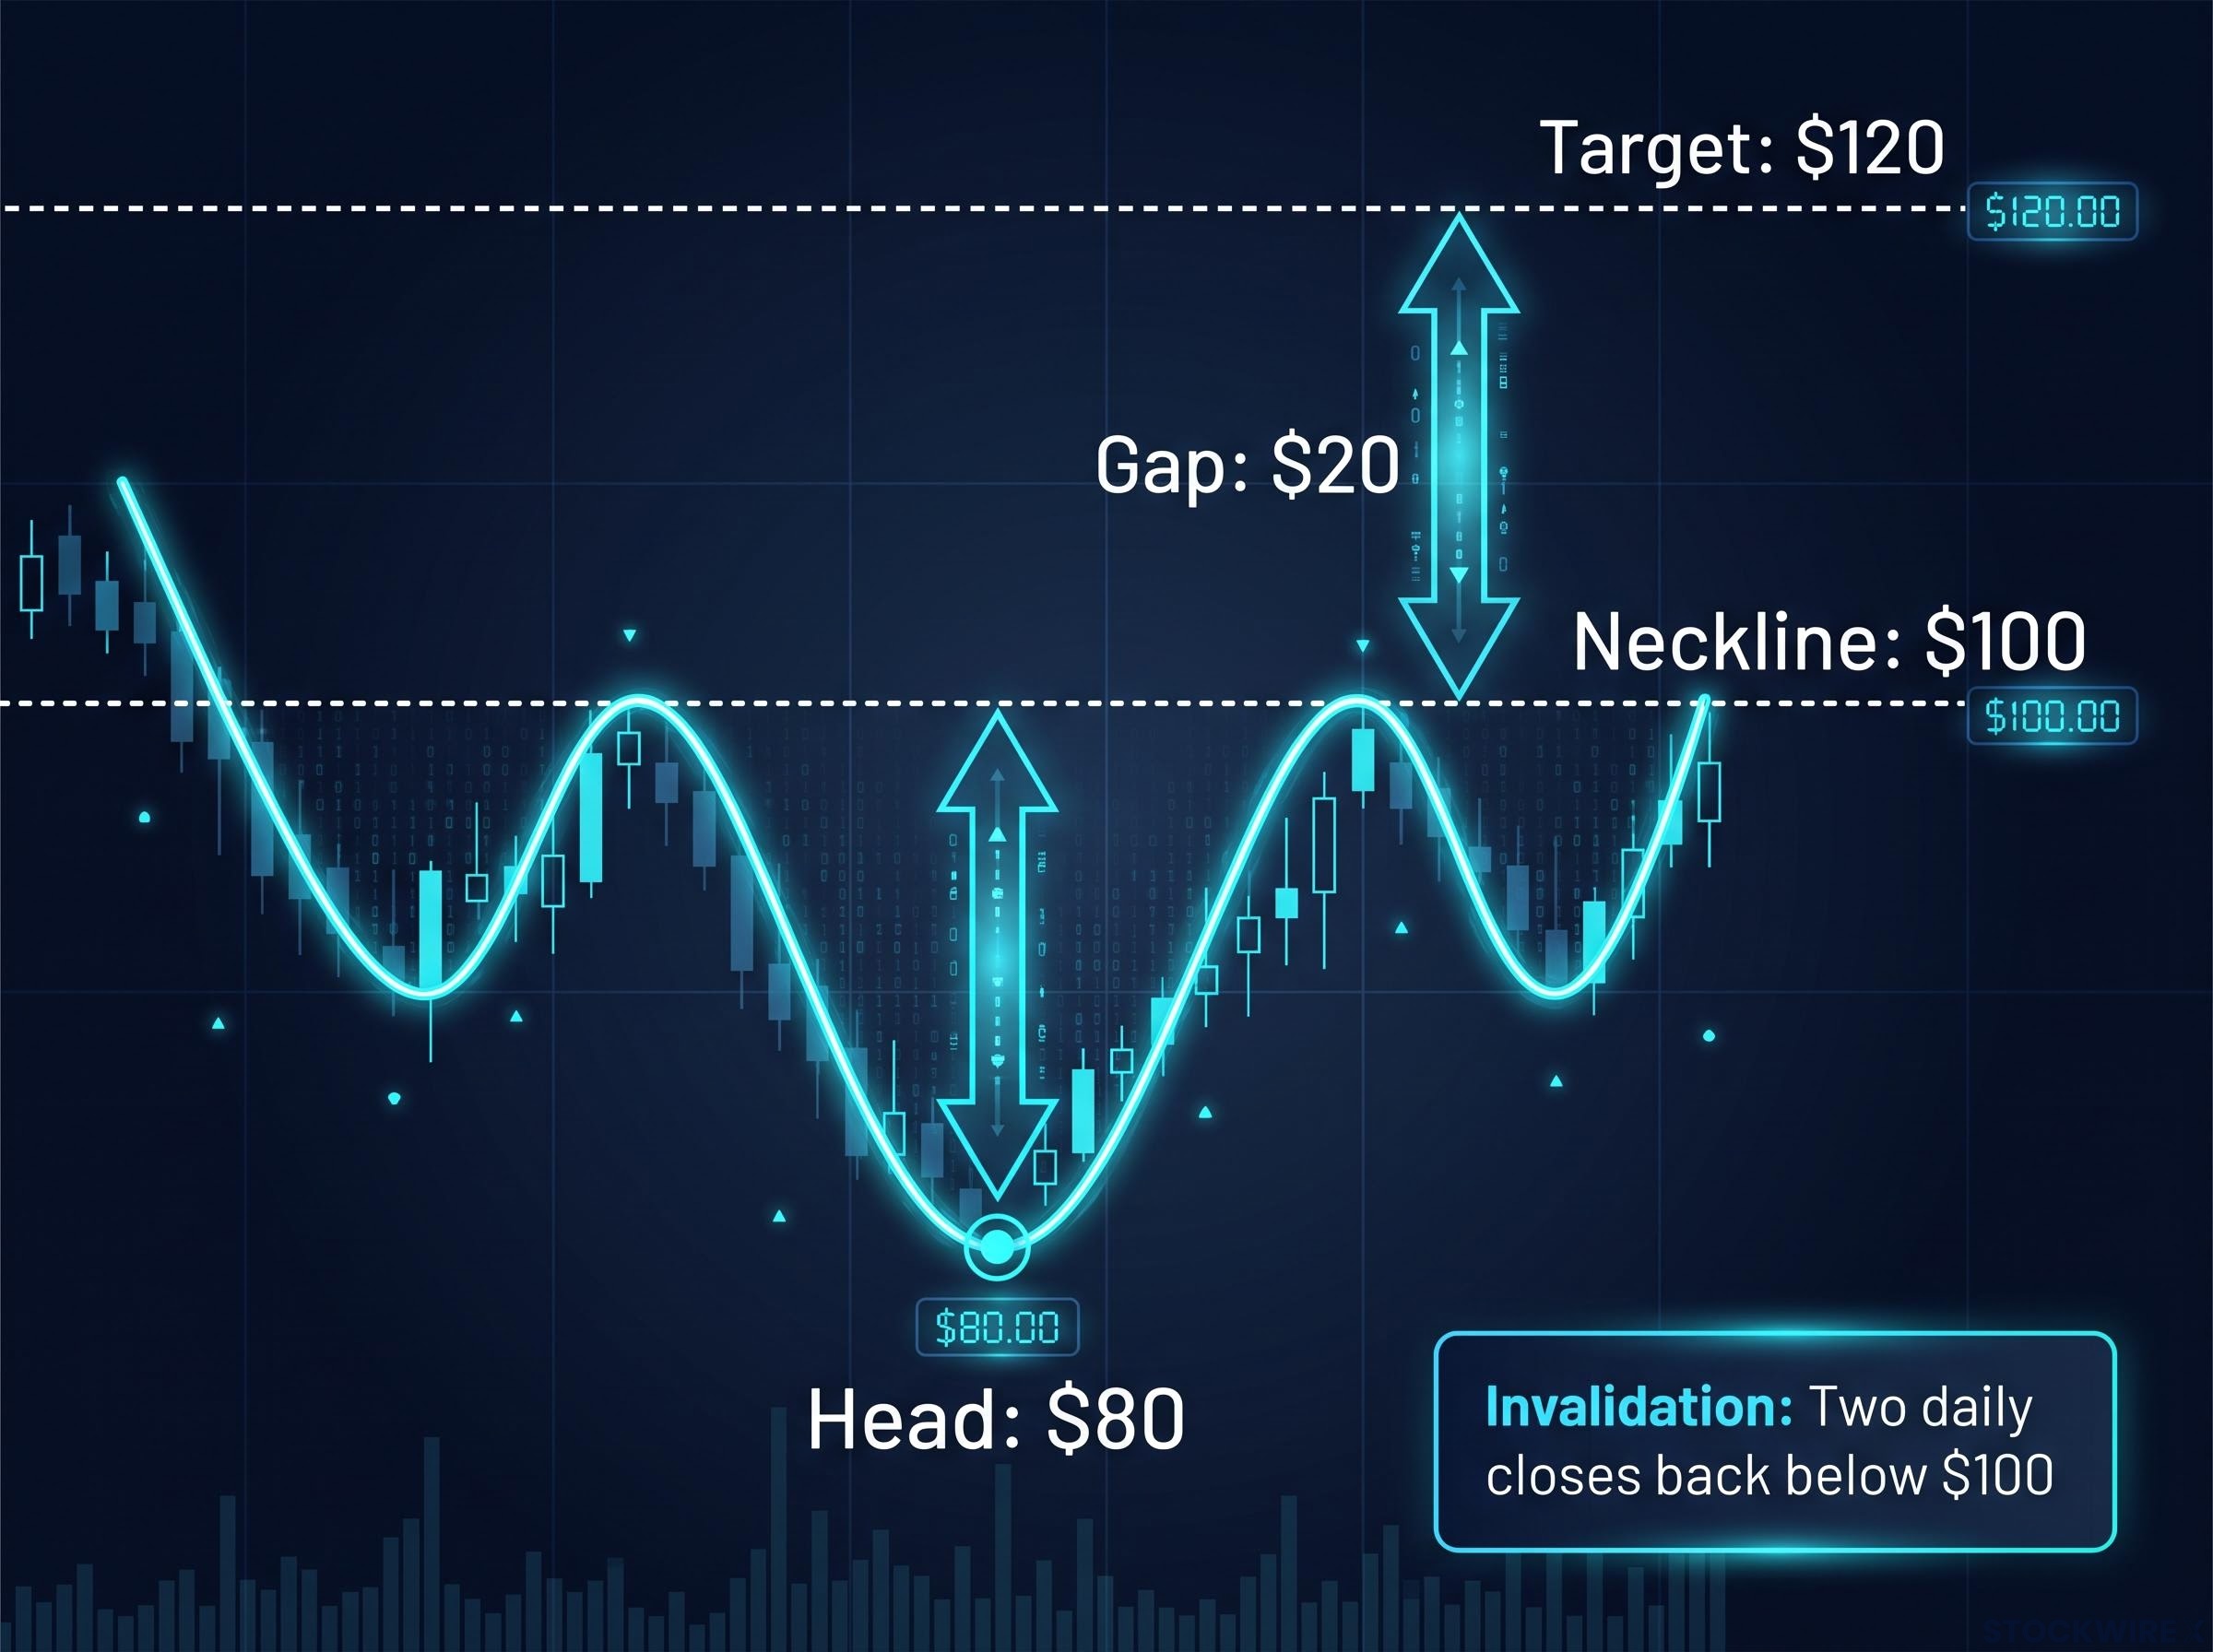
- Identify the head’s extreme point (the lowest low, for an inverse pattern).
- Measure the vertical distance from that point to the neckline.
- Project that same distance from the breakout point to set the target.
- Set your invalidation: in Dosek’s framework, two daily closes back through the neckline negate the pattern and cancel the target.
Take an inverse pattern with a head at $80 and a neckline at $100. The gap is $20, so a breakout at $100 implies a target of $120. Two daily closes back below $100 would kill the trade.
Educators broadly treat that target as a minimum objective, not a ceiling. They also treat retests of the neckline as normal behaviour and favour waiting for a confirmed break over anticipating one.
How reliable is it, really?
The studies agree the pattern works more often than not. They disagree on how often.
| Source | Reported figure | Condition |
|---|---|---|
| Strike.money | 57% win rate (57 winners, 43 losers); average post-break fall about 23% over nearly three months | 100-pattern sample |
| Quantum-Algo | 55-65% win rates; reward-to-risk about 2:1 to 4:1 | Properly validated patterns |
| SMW EDU | 65-75%, rising to 75-85% | Higher range requires strong volume confirmation |
| ChartingLens | Completion of roughly one-half to two-thirds | Classical pattern studies |
Reliability rises with a clean three-peak structure, heavier volume on the break and daily or weekly charts. It falls sharply when volume is thin, when the trade runs against the broader trend, or when traders jump in before the neckline actually breaks.
The spread between 55% and 85% tells you the shape alone is not an edge. Volume confirmation and position sizing decide whether the maths works in your favour.
Completion-rate studies of thousands of historical patterns, including Bulkowski’s dataset, put full measured-move completion closer to 51% than to the higher figures often quoted, which is why the target works best as a management guide rather than a promise.
When big ASX news breaks, our subscribers know first
Why does a 5%+ 10-year yield threaten these breakouts?
The discount-rate mechanism
It is tempting to treat a chart as a closed system. Valuation does not work that way. Discounted cash flow analysis values a stock as the present value of its future cash flows, reduced by a discount rate built on the risk-free rate, which is often the 10-year yield.
Consider $100 of profit a company expects to earn ten years from now. The higher the rate used to discount it, the less that future $100 is worth today. Growth, AI and memory-chip companies carry much of their value in those distant years, so rising yields compress their valuations hardest.
The current climb is not only about Federal Reserve expectations. Research cites three other drivers:
- A rising term premium: the extra yield investors demand for holding long-dated debt.
- Heavier Treasury issuance: more government bonds competing for capital.
- Higher real yields: returns after inflation moving up.
Term premium check The term premium on a 10-year zero-coupon Treasury stood at 1.0847% on 2 October 2026, according to FRED series THREEFYTP10.
The trend has been building for two years. The St. Louis Fed’s FRED Blog found the term premium rose from near zero to about 0.8% after the September 2024 Fed meeting, accounting for more than half of that yield increase. TD Economics puts most estimates at 80-100 basis points and says a higher term premium added roughly 20 basis points to the 10-year since the winter.
Headwind versus resilience
The headwind camp argues that higher risk-free returns make lofty multiples harder to defend. The resilience camp counters that equities have rallied alongside high yields when those yields reflected strong growth, and that AI-driven earnings gains could offset steeper discount rates. Both positions fit standard finance theory.
Supporters of the resilience view point to pre-QE yield levels in the early-to-mid 2000s, when equities functioned normally with long-dated yields near 5%, suggesting today’s backdrop may be less exotic than it first appears.
Dosek expects the yield to consolidate near 5% after overbought conditions, which would give bullish patterns room. His monthly chart, however, points to a Fibonacci level at 6.249% if it breaks higher. If the 10-year keeps climbing, expect breakouts to stall or fail at the neckline retest. The yield chart belongs on the same screen as your stock chart.
Which setups are strongest: SpaceX and Constellation Energy?
These two names separate a trade that is live from one that is still a hope.
| Ticker | Pattern | Trigger or support | Measured-move target |
|---|---|---|---|
| SPCX | Inverse head and shoulders, confirmed | Support about $155-$154.87 | $218.35 |
| CEG | Inverse head and shoulders, unconfirmed; bear flag overlay | Daily close above about $300 | $391.50 |
SpaceX (SPCX): confirmed breakout, waiting on the retest
SPCX broke above its neckline on the Monday after a 2 October setup and kept rising, according to Dosek. He sets the measured-move target at $218.35 and sees the old neckline flipping from resistance to support around $155 to $154.87.
His preferred entry is a patient pullback to that zone and a bounce. Waiting trades away some of the move already made, but it gives you a much tighter, clearer invalidation point.
Constellation Energy (CEG): one close from confirmation
CEG jumped on what Dosek describes as a $4.3 billion agreement to supply power to Google data centres. Independent confirmation of that deal value was not found. More importantly, price has not yet closed above the neckline near $300, which Dosek says is needed to open the $391.50 target.
A bear flag complicates the picture. Its pole began on 8 September, and Dosek says only a close above about $305.80 would negate it.
A news-driven spike without a confirming close is not a confirmed pattern. Until that close arrives, CEG remains a watch item.
Can Micron and SanDisk hold their necklines when yields are this high?
Both memory names show an inverse head and shoulders, but neither is clean. Each has a very short left shoulder and a right shoulder that looks almost doubled. Irregular structure makes the shape less trustworthy, because the cleaner three-peak form is what the reliability studies reward.
Verify before acting Every ticker level here is Drew Dosek’s claim as of his video date. No independent price data was located, so check these lines against live charts.
Micron (MU): a neckline tested to its limit
- Price about $1,083 at the time of the video.
- A hold could lead toward about $1,300, the 50% area of a parallel channel and a new all-time high.
- Daily closes below the trend line near $1,035.50 raise the odds of a decline.
The neckline has been tested repeatedly, and price briefly slipped under it during the session before recovering.
SanDisk (SNDK): a similar shape with a bigger target
- Price near $1,663.
- It closed under the neckline the previous day before recovering.
- Measured-move target near the top of the parallel channel at about $2,625.02.
A neckline that has been undercut is weaker than one that has held. That argues for smaller positions than you would take on a clean pattern, with the two-close invalidation rule honoured strictly.
The rate backdrop weighs heaviest here. Long-duration, high-multiple memory names are the most rate-sensitive in this group, so a push toward 6.249% on the 10-year would test these necklines first.
What the patterns can and cannot tell you in a high-yield market
The method itself is sound: measure, confirm, invalidate. But success rates of 55-85% mean the yield backdrop should decide how much risk you take on any single breakout.
Three checks frame the decision:
- Watch whether the 10-year consolidates near 5% or pushes toward 6.249%.
- Act on daily closes at each neckline, not intraday spikes.
- Exit on two closes back through the neckline, without exception.
This is educational analysis based on one analyst’s levels, not personalised financial advice. Past performance does not guarantee future results, and pattern targets are speculative and subject to change with market conditions.
This article is for informational purposes only and should not be considered financial advice. Investors should conduct their own research and consult with financial professionals before making investment decisions.