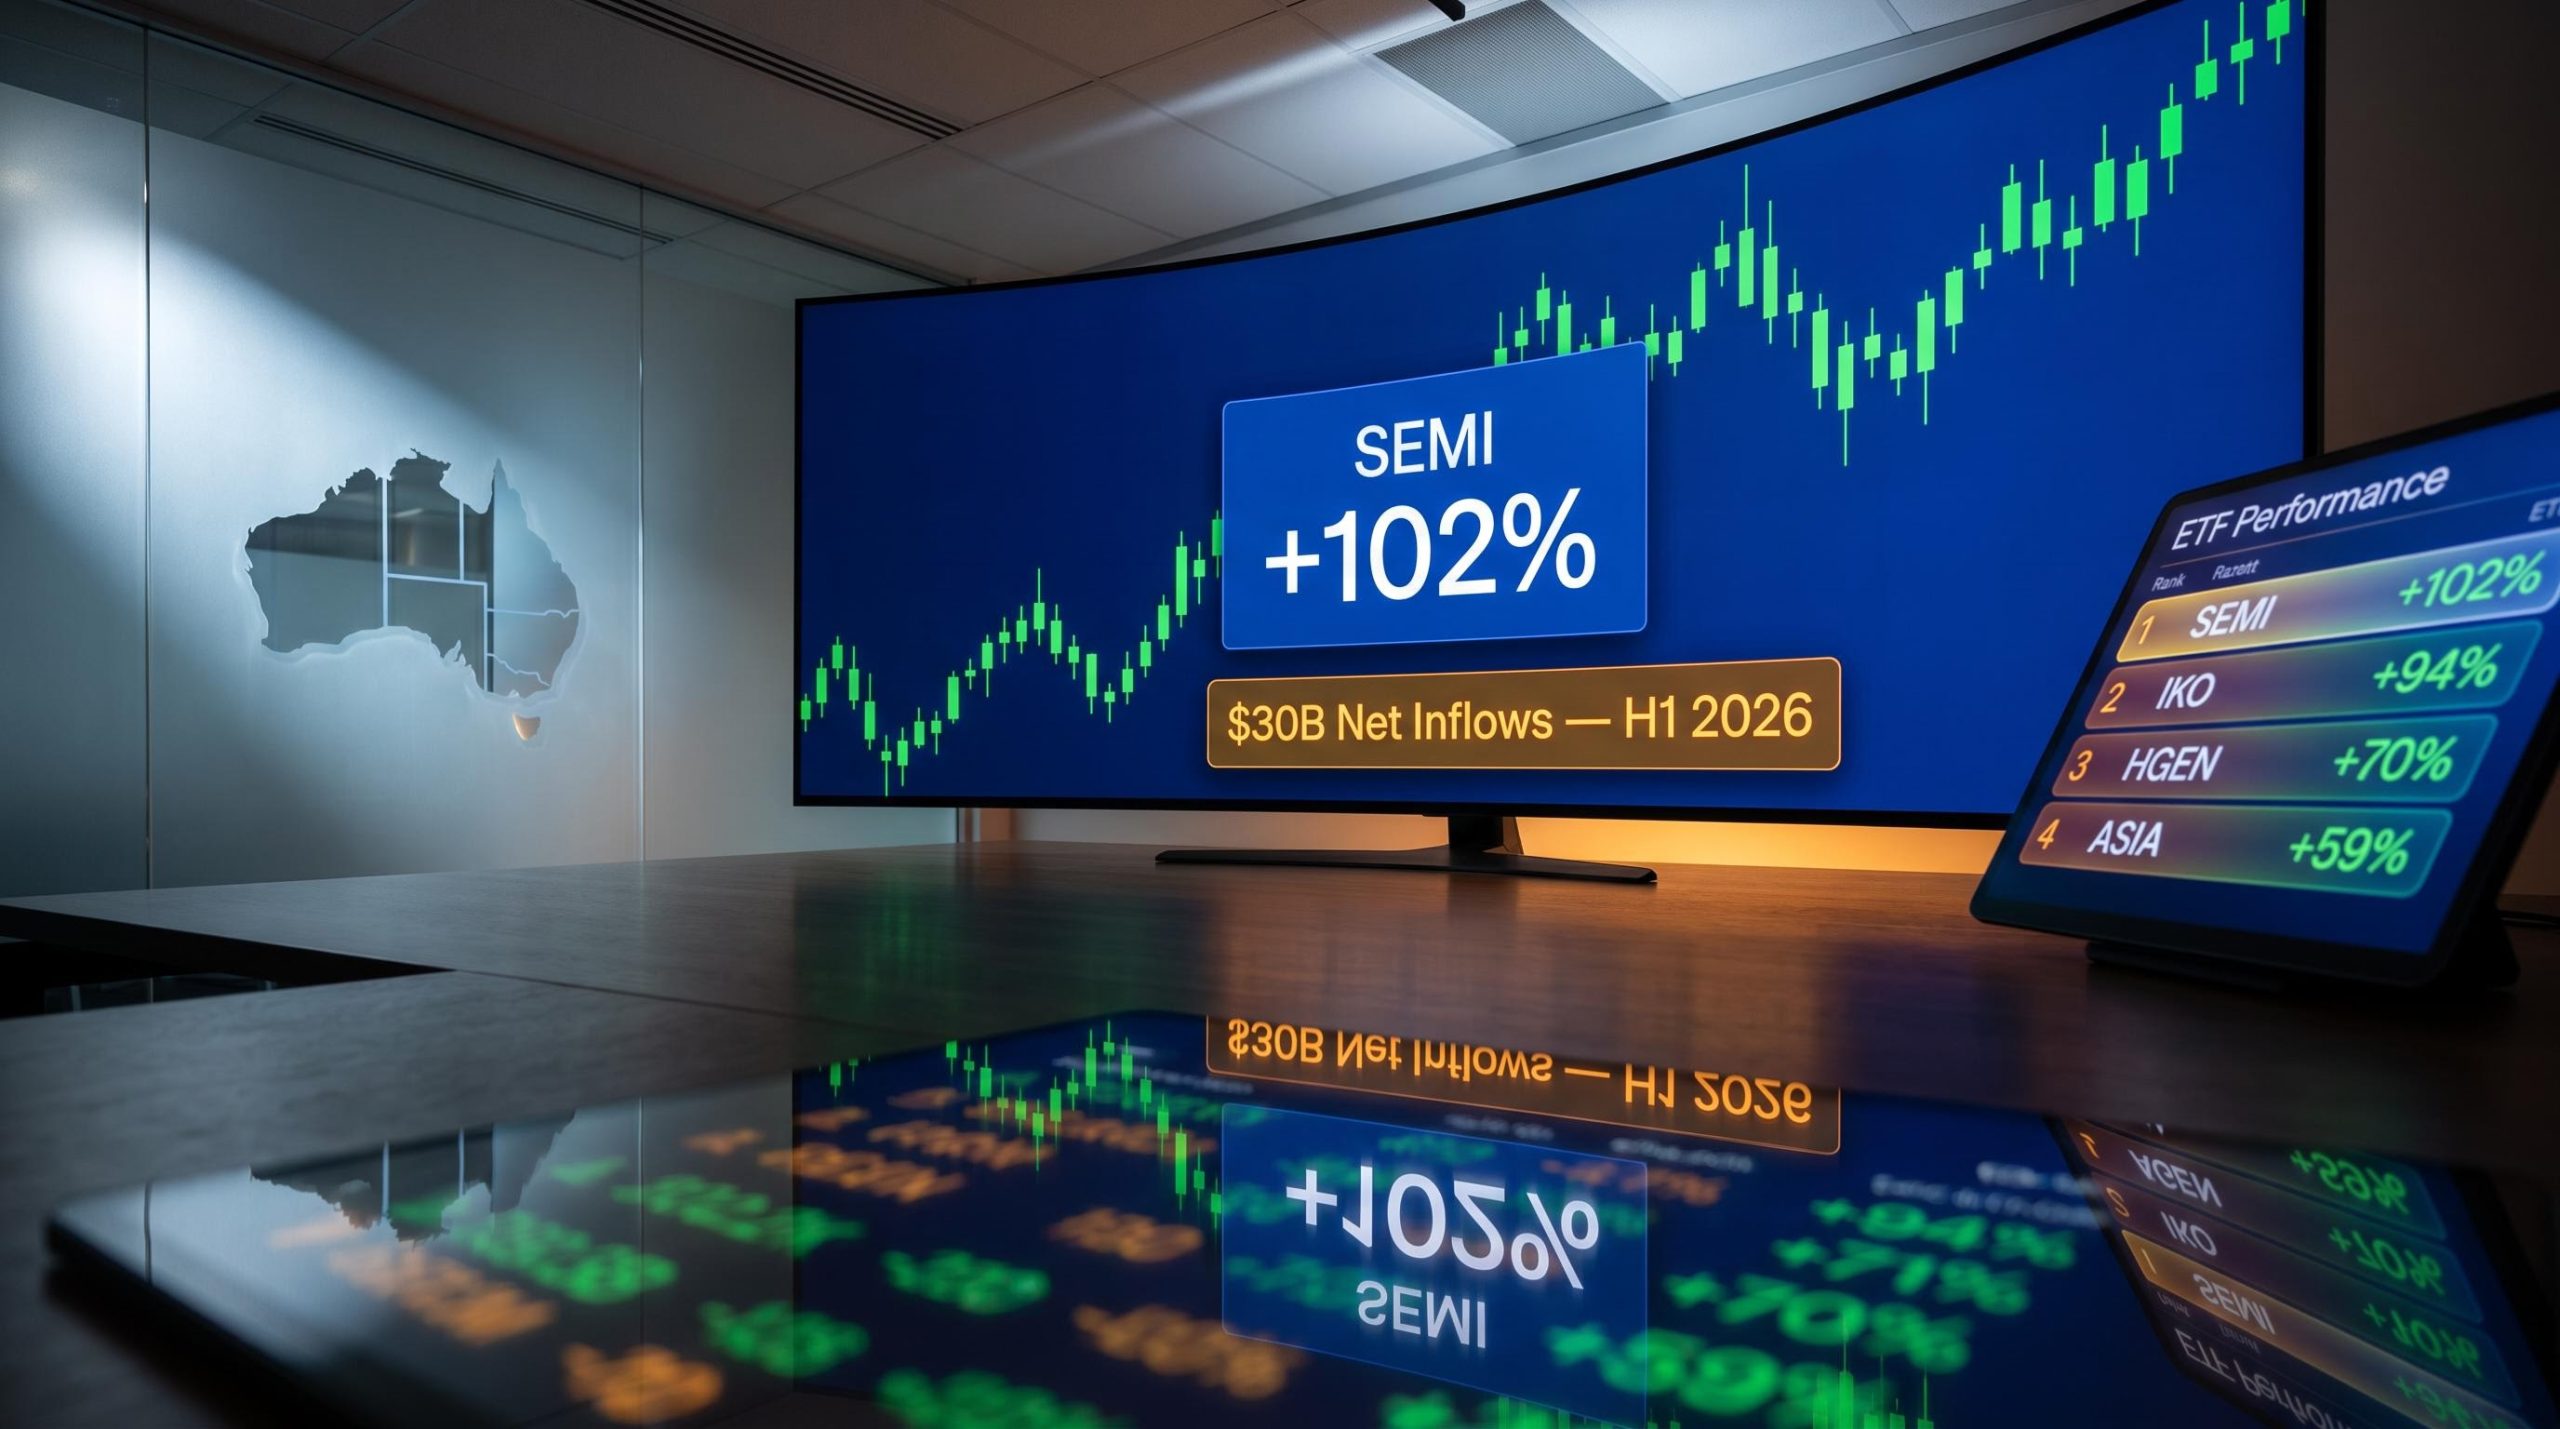
The Australian ETF industry just matched an entire year of investor flows in six months. In the first half of 2026, $30 billion in net inflows reached the market, a total that mirrors the whole of 2024’s intake across just six months. That single figure reframes what strong growth actually looks like for this asset class.
Set against a backdrop of AI-driven market momentum, semiconductor stocks surging globally, and renewed appetite for thematic exposures, the industry recorded $372 billion in funds under management (FUM) by the end of June 2026. The $400 billion threshold, once a medium-term target, now looks like a 2026 event. For Australian retail investors assessing their portfolio positioning, the half-year data is more than a milestone: it is a map of where capital actually moved and what it returned.
Here is the industry-level flow breakdown by provider, the five top-performing ASX ETFs for the period with the thematic drivers behind each, and a clear framework for assessing whether the momentum is durable or whether chasing it now carries risk. All performance data in this piece is sourced from the BetaShares Australian ETF Review, Half Year 2026, published approximately 15 July 2026.
A $30 billion half-year that rewrites the industry’s growth story
The numbers are worth sitting with. Australian ETF FUM reached $372 billion at the close of H1 2026, representing 12.5% growth in six months. That pace alone would rank as a strong calendar year for the industry. But it is the inflow figure that tells the real story.
Australian ETFs drew $30 billion in net inflows across the first half of 2026, a tally that equalled the total capital committed throughout the whole of 2024.
In other words, Australian investors compressed twelve months of capital allocation into six. This is not linear growth. It is compounding adoption, and it should change how you think about the structural tailwind behind ETFs as an asset class in this market.
Industry forecasts now place year-end FUM in the $380-$400+ billion range, with the $400 billion milestone no longer aspirational but probable. That trajectory matters because sustained inflow momentum typically supports tighter bid-ask spreads, deeper liquidity, and continued product development, all of which benefit existing and prospective ETF holders.
The $400 billion milestone had already entered industry forecasts as a probable 2026 outcome before H1 data was published; April 2026 alone contributed $5.2 billion in net inflows, the third-highest single month on record, providing the momentum that makes a year-end crossing highly credible.
When big ASX news breaks, our subscribers know first
Which providers captured the most investor capital
Vanguard captured more than a third of total net inflows for the period, pulling in $10.7 billion and reinforcing its position as the dominant force in Australian ETF distribution. That concentration tells you something about where investor trust sits at scale: in low-cost, broad index exposure.
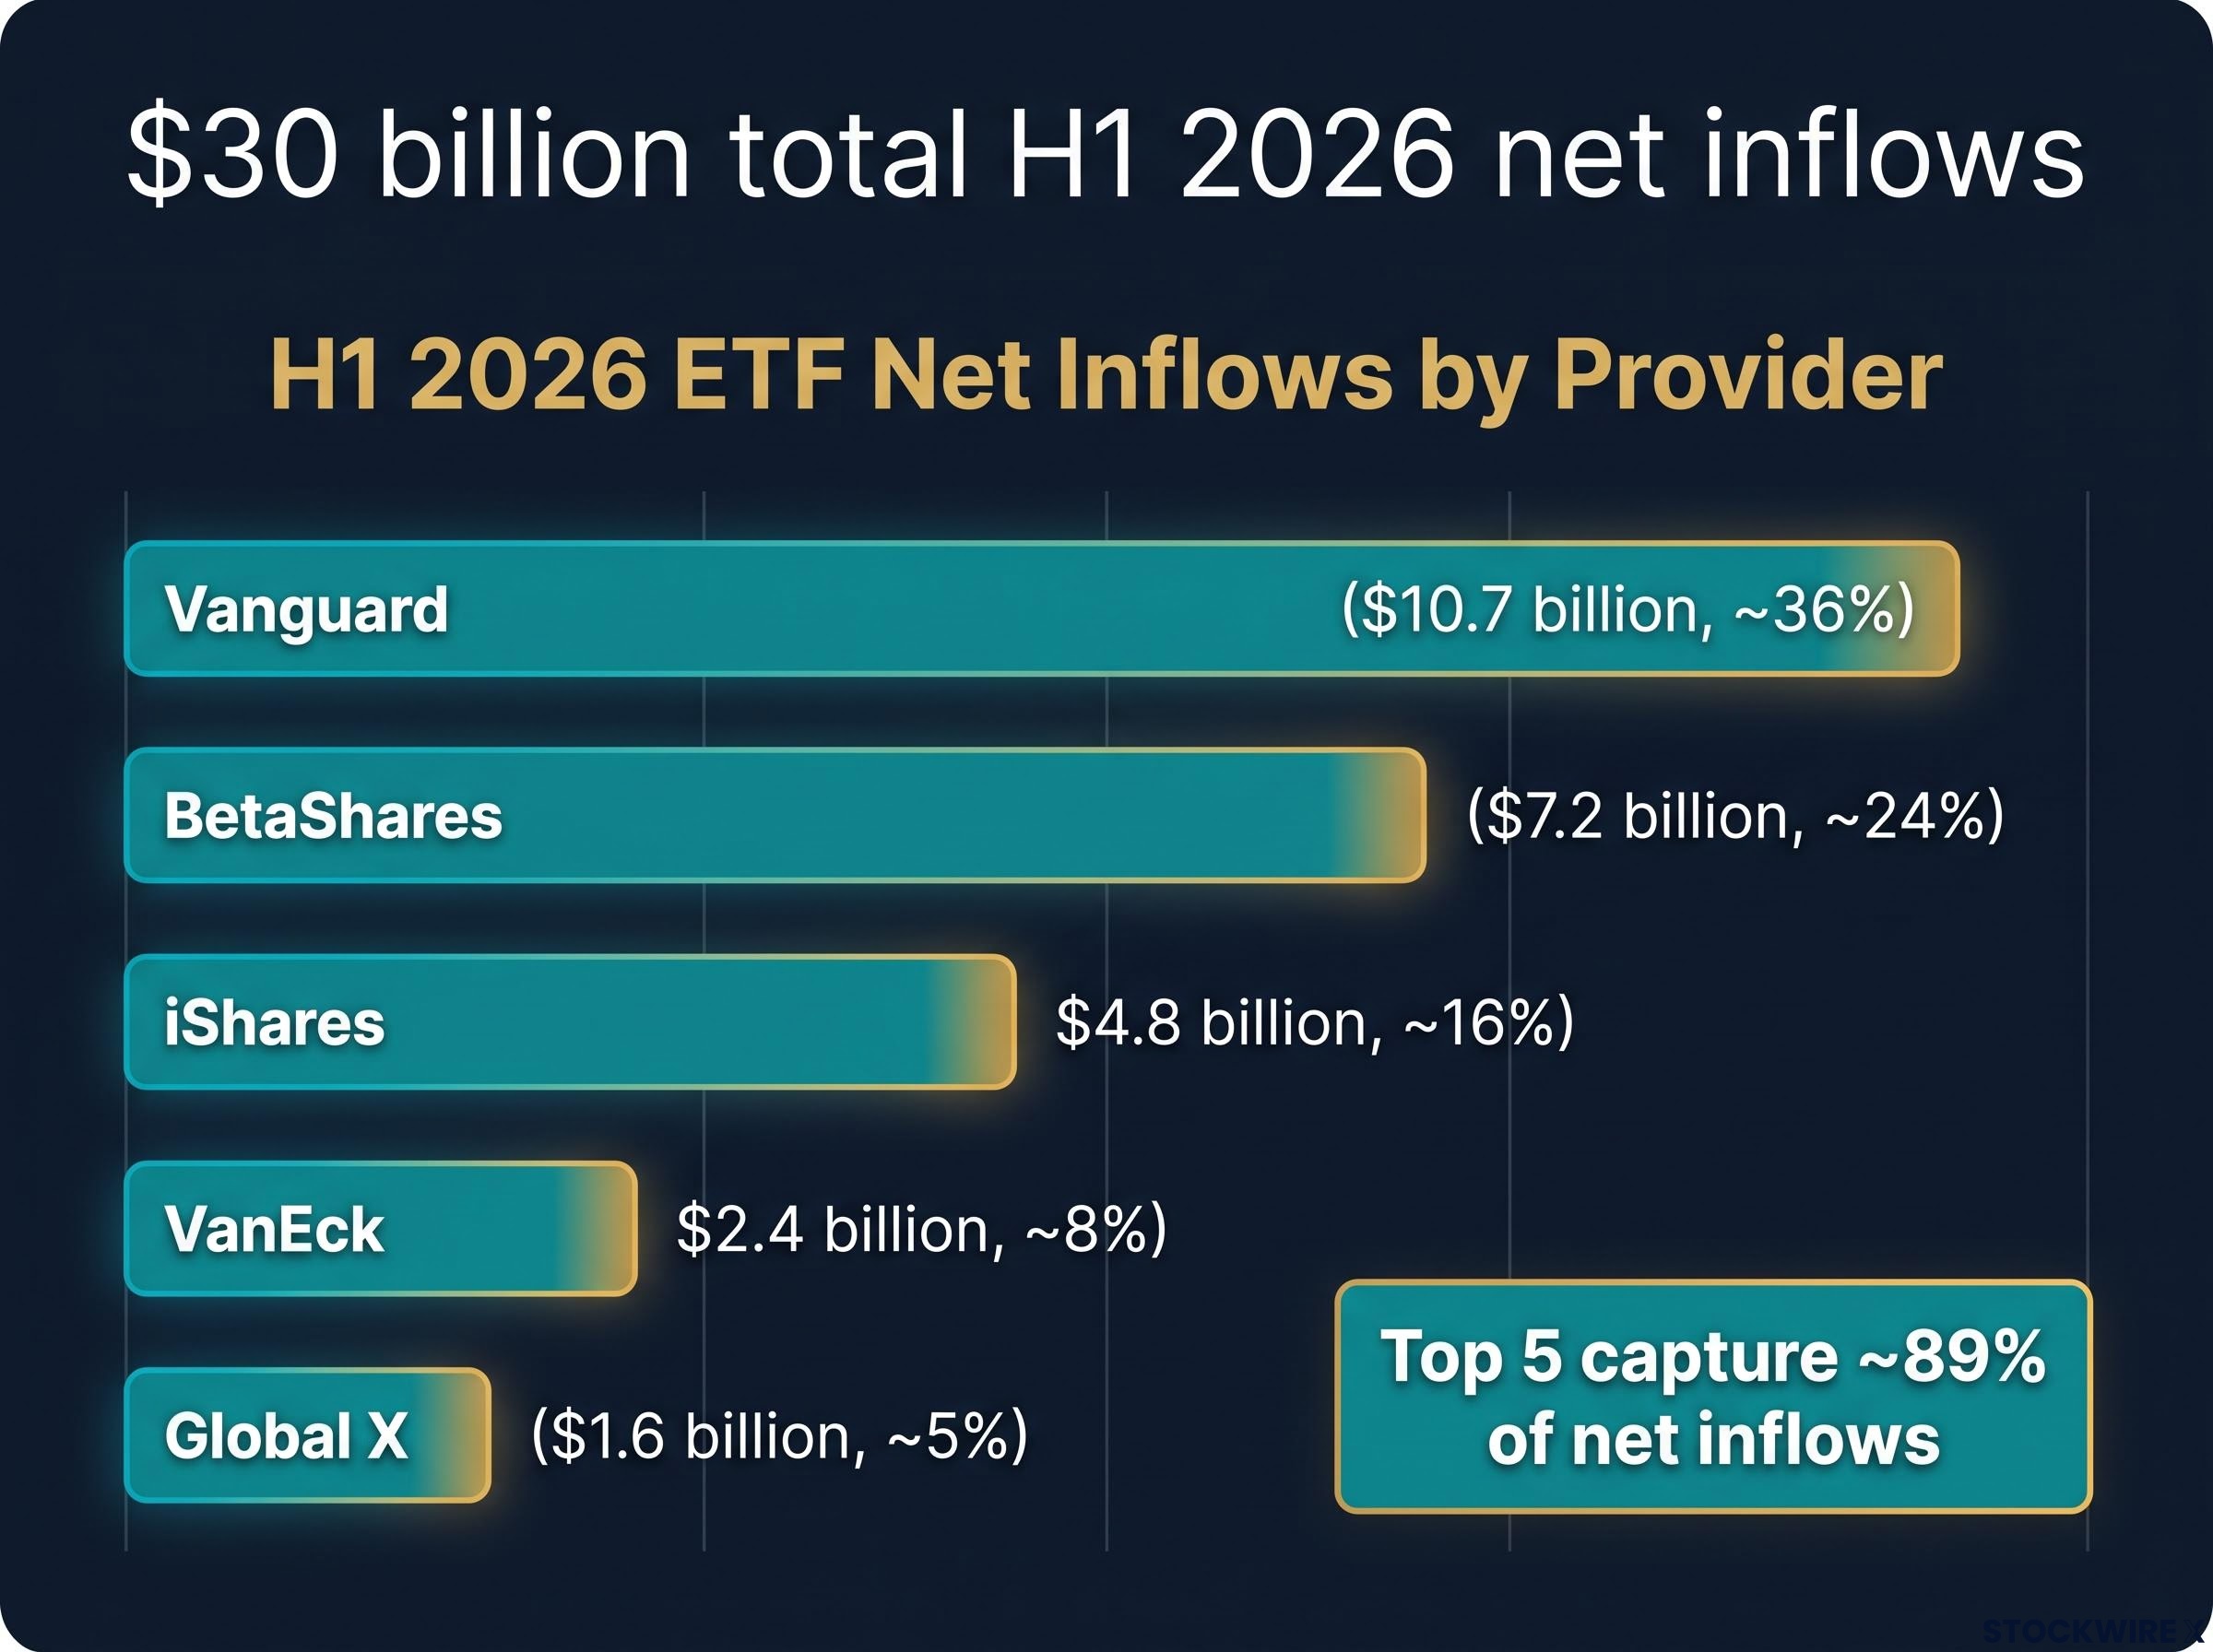
Behind Vanguard, the rankings revealed a familiar but tightening field.
| Provider | Net Inflows (H1 2026) | Share of Total Inflows |
|---|---|---|
| Vanguard | $10.7 billion | ~36% |
| BetaShares | $7.2 billion | ~24% |
| iShares | $4.8 billion | ~16% |
| VanEck | $2.4 billion | ~8% |
| Global X | $1.6 billion | ~5% |
The top five providers collectively captured approximately 89% of total net inflows. That concentration matters when you are assessing product continuity and fund size risk: the providers attracting capital at this pace are the ones most likely to sustain competitive fee structures and deepen the liquidity pools around their funds.
It is worth noting that BetaShares, which published the source report for these figures, is itself the second-largest flow recipient for the period.
What the top five performers reveal about where thematic bets paid off
The performance table for H1 2026 is where things get interesting, because the winners were not a one-theme story. Semiconductor and AI-adjacent exposure dominated the top two positions, but three of the five best-performing ASX ETFs came from entirely distinct themes: hydrogen, Asian technology, and crude oil.
| Rank | ETF Name | ASX Code | H1 2026 Return |
|---|---|---|---|
| 1 | Global X Semiconductor ETF | SEMI | ~102% |
| 2 | iShares MSCI South Korea ETF | IKO | ~94% |
| 3 | Global X Hydrogen ETF | HGEN | ~70% |
| 4 | BetaShares Asia Technology Tigers ETF | ASIA | ~59% |
| 5 | BetaShares Crude Oil Index ETF Currency Hedged Synthetic | OOO | greater than 44% |
Source: BetaShares Australian ETF Review, Half Year 2026.
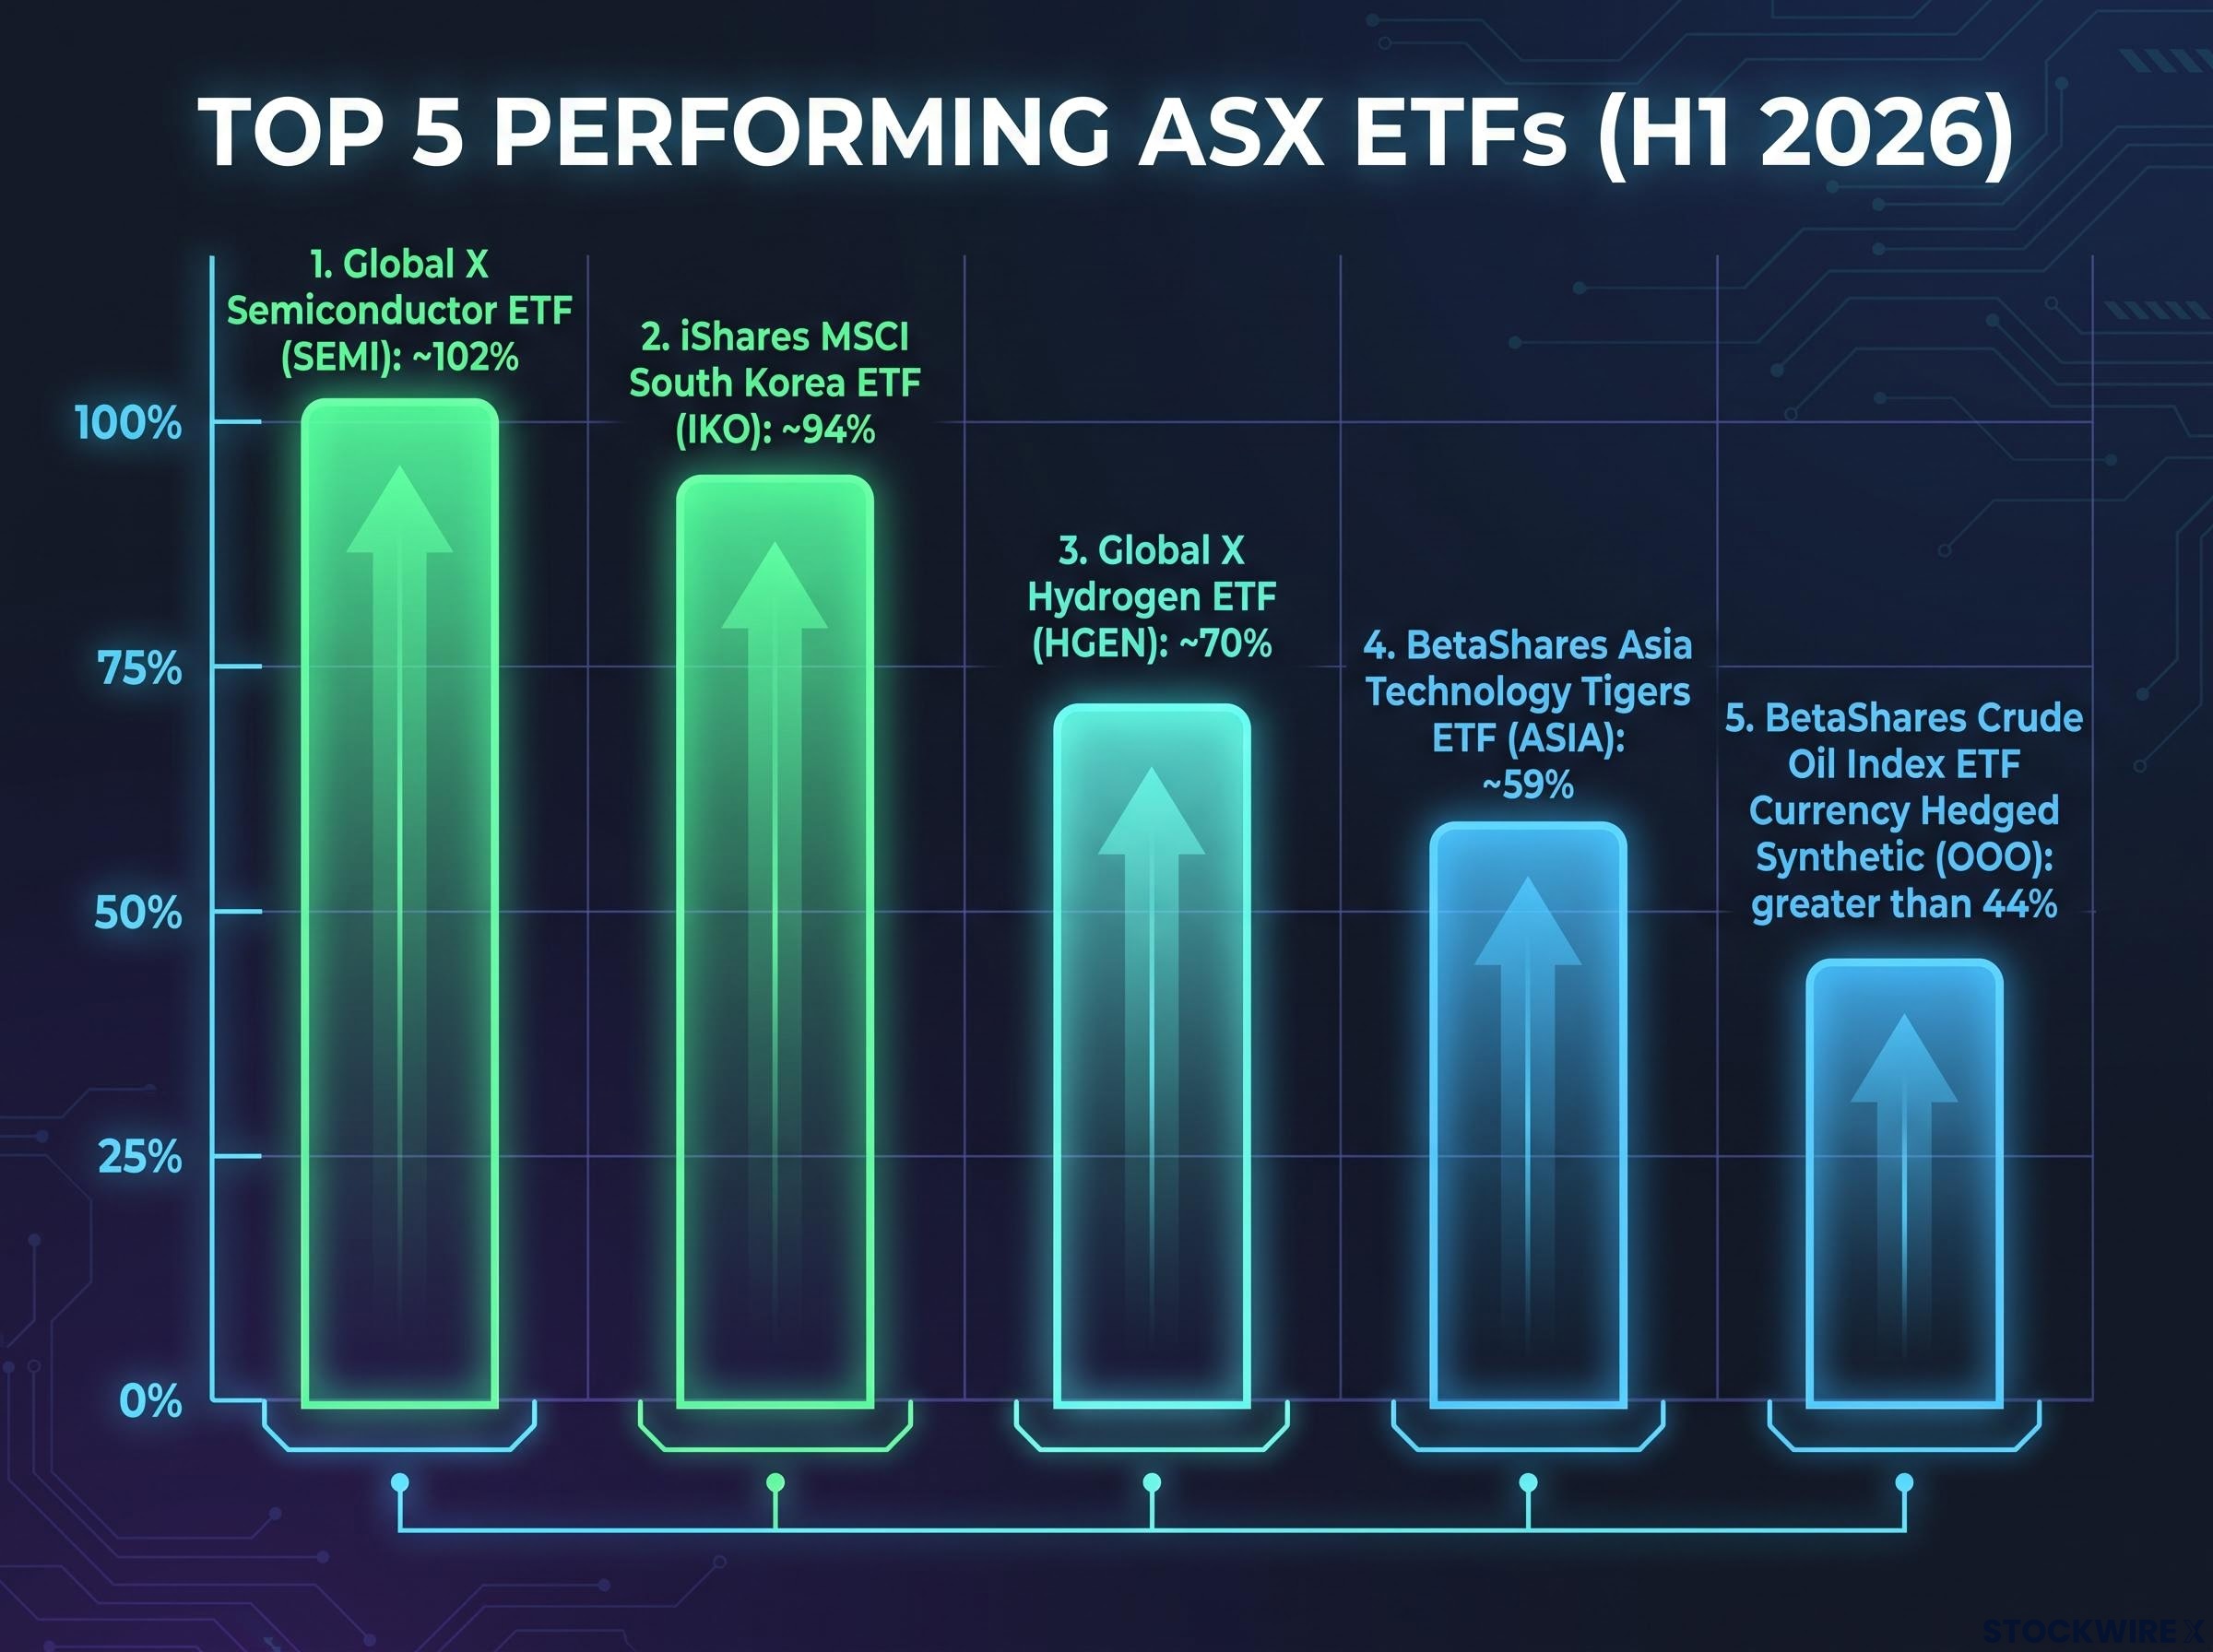
The diversity matters. A concentrated bet on semiconductors alone, the strongest single theme, would have delivered exceptional returns. But it would also have missed the ~70% re-rating in hydrogen, the ~94% surge in Korean equities driven by chipmaker giants Samsung and SK Hynix, and the commodity-supply disruption trade captured by crude oil.
What this tells you is that H1 2026 rewarded diversified thematic positioning. A portfolio holding two or three of these exposures outperformed one that loaded into a single AI trade, and the lesson carries forward into how you assess positioning for the second half.
Inside the top performer: how SEMI delivered a near-102% half
Before the return figure can mean anything useful, you need to understand what the Global X Semiconductor ETF (ASX: SEMI) actually holds. This is a passive ETF providing exposure to large- and mid-cap semiconductor equities globally. It tracks the Solactive Global Semiconductor 30 Index, a concentrated basket of 30 of the world’s largest chipmakers.
- Index tracked: Solactive Global Semiconductor 30 Index
- ASX listing date: 26 July 2021
- Structure: Passive, global equity
- Fund size: Exceeded $1 billion as of July 2026
SEMI delivered approximately 102% for the six months to June 2026, ranking as the top-performing ETF on the ASX for the period. Source: BetaShares Australian ETF Review, Half Year 2026.
That return did not arrive from nowhere. The underlying driver was the global semiconductor demand cycle tied to AI infrastructure build-out and data centre expansion. Chipmakers across the index benefited from surging capital expenditure commitments by hyperscale cloud providers, and the supply constraints that defined earlier years of the cycle kept pricing power intact.
The semiconductor demand cycle behind SEMI’s return is confirmed by verified industry data: global semiconductor sales reached $298.5 billion in Q1 2026, a 79.2% year-over-year monthly increase, and the fund’s top five holdings account for approximately 45.5% of the portfolio, concentrating that exposure in memory chips and chip design.
The fund crossing $1 billion in size while nearly doubling in value within six months tells you that retail and institutional investors are simultaneously bidding up both the fund wrapper and its underlying holdings. That creates a self-reinforcing flow dynamic, but it also amplifies concentration risk. If semiconductor demand forecasts miss, the same momentum that drove inflows could reverse quickly.
For anyone considering entering SEMI at current levels, the context matters: this return was driven by a specific sector cycle, not broad market beta. The thesis depends on AI-linked chip demand continuing to grow at a pace that justifies current valuations. That is the question you need to answer before adding this exposure.
This article is for informational purposes only and should not be considered financial advice. Investors should conduct their own research and consult with financial professionals before making investment decisions. Past performance does not guarantee future results.
The thematic drivers behind H1 2026 and what they signal about H2
Four distinct engines powered the top-performing ETFs. Understanding which are structural and which were event-driven is the difference between a position you hold with conviction and one you should be re-examining now.
- AI and semiconductors: Multi-year capital expenditure cycle underpinning demand. Both SEMI and IKO drew from this theme, with South Korea’s outsized chipmaker exposure (Samsung, SK Hynix) explaining why a country ETF ranked second on a global performance table. The BetaShares review cited AI-driven technology exposure as a leading factor behind both performance outcomes and inflow momentum, giving this theme dual confirmation.
- Hydrogen and energy transition: HGEN’s approximately 70% return came after a period of sustained underperformance in clean energy, suggesting a re-rating driven by renewed policy commitment and shifting capital allocation rather than a single catalyst.
- Crude oil: OOO’s greater than 44% return reflected a sharp upward move in oil prices stemming from conflict in the Middle East and the resulting pressure on shipping through the Strait of Hormuz. This is geopolitical event risk, not a structural demand story.
- Asian technology: ASIA’s approximately 59% return reflects broader innovation-led outperformance across the region, sitting between the pure semiconductor play and the broader emerging-market technology theme.
Which themes look durable into H2 2026
The semiconductor and AI theme has the strongest structural case: the capital expenditure cycle behind it spans multiple years, with hyperscale commitments already locked in through 2027 and beyond. Korean technology exposure rides the same wave, with added valuation support from a market that traded at a discount to global peers for much of 2025.
Hydrogen’s re-rating is more fragile. Policy-dependent themes can reverse on a single election cycle or regulatory shift, and the sector’s prior underperformance reminds you that conviction here has been punished before.
Crude oil is the most event-dependent of the four. If geopolitical tensions around the Strait of Hormuz ease, the pricing pressure behind OOO’s return dissipates. You should treat this exposure as a tactical position, not a structural one.
What the H1 2026 data tells you before making an ETF decision now
Two stories ran through the first half of 2026. The first is structural: $30 billion in inflows, $372 billion in FUM, and a trajectory that puts $400 billion within reach by year-end. That confirms the Australian ETF industry’s growth story at a pace that benefits every participant through deeper liquidity, broader product choice, and competitive fee pressure.
The second story is thematic and cyclical. The top five performers delivered extraordinary returns, but each was driven by a specific catalyst. Some of those catalysts, semiconductors and AI infrastructure, have multi-year tailwinds. Others, crude oil supply disruption, geopolitical premium, could unwind in a quarter.
Before acting on any of this data, apply three evaluative questions:
The behaviour gap in thematic funds is one of the most consequential structural risks in the performance data: ARK Innovation reported a +233% time-weighted return while the typical investor experienced approximately -35%, because inflows peaked near maximum valuations and reversed during drawdowns, a dynamic that closely mirrors the post-rally entry risk present in SEMI and HGEN today.
- Is the thematic thesis still live? A near-102% return in SEMI was earned by a semiconductor cycle. If that cycle is peaking, the entry point matters more now than it did in January.
- Does the fund have sufficient size and liquidity? SEMI’s $1 billion fund size is a positive signal. Smaller thematic ETFs may carry wider spreads and lower daily turnover.
- Does this exposure duplicate something you already hold? Thematic ETFs can overlap with existing positions in international equity funds or technology-weighted index products.
Vanguard’s $10.7 billion inflow capture is a reminder that, while the performance tables belong to thematic plays, the majority of investor capital still flows toward broad index exposure. The structural case for holding ASX ETFs is being confirmed by market behaviour at scale. But the top-performer returns also serve as a reminder: chasing H1 results into H2 without re-examining the underlying thesis is a reliable way to enter at peak positioning.
These statements are speculative and subject to change based on market developments and company performance.