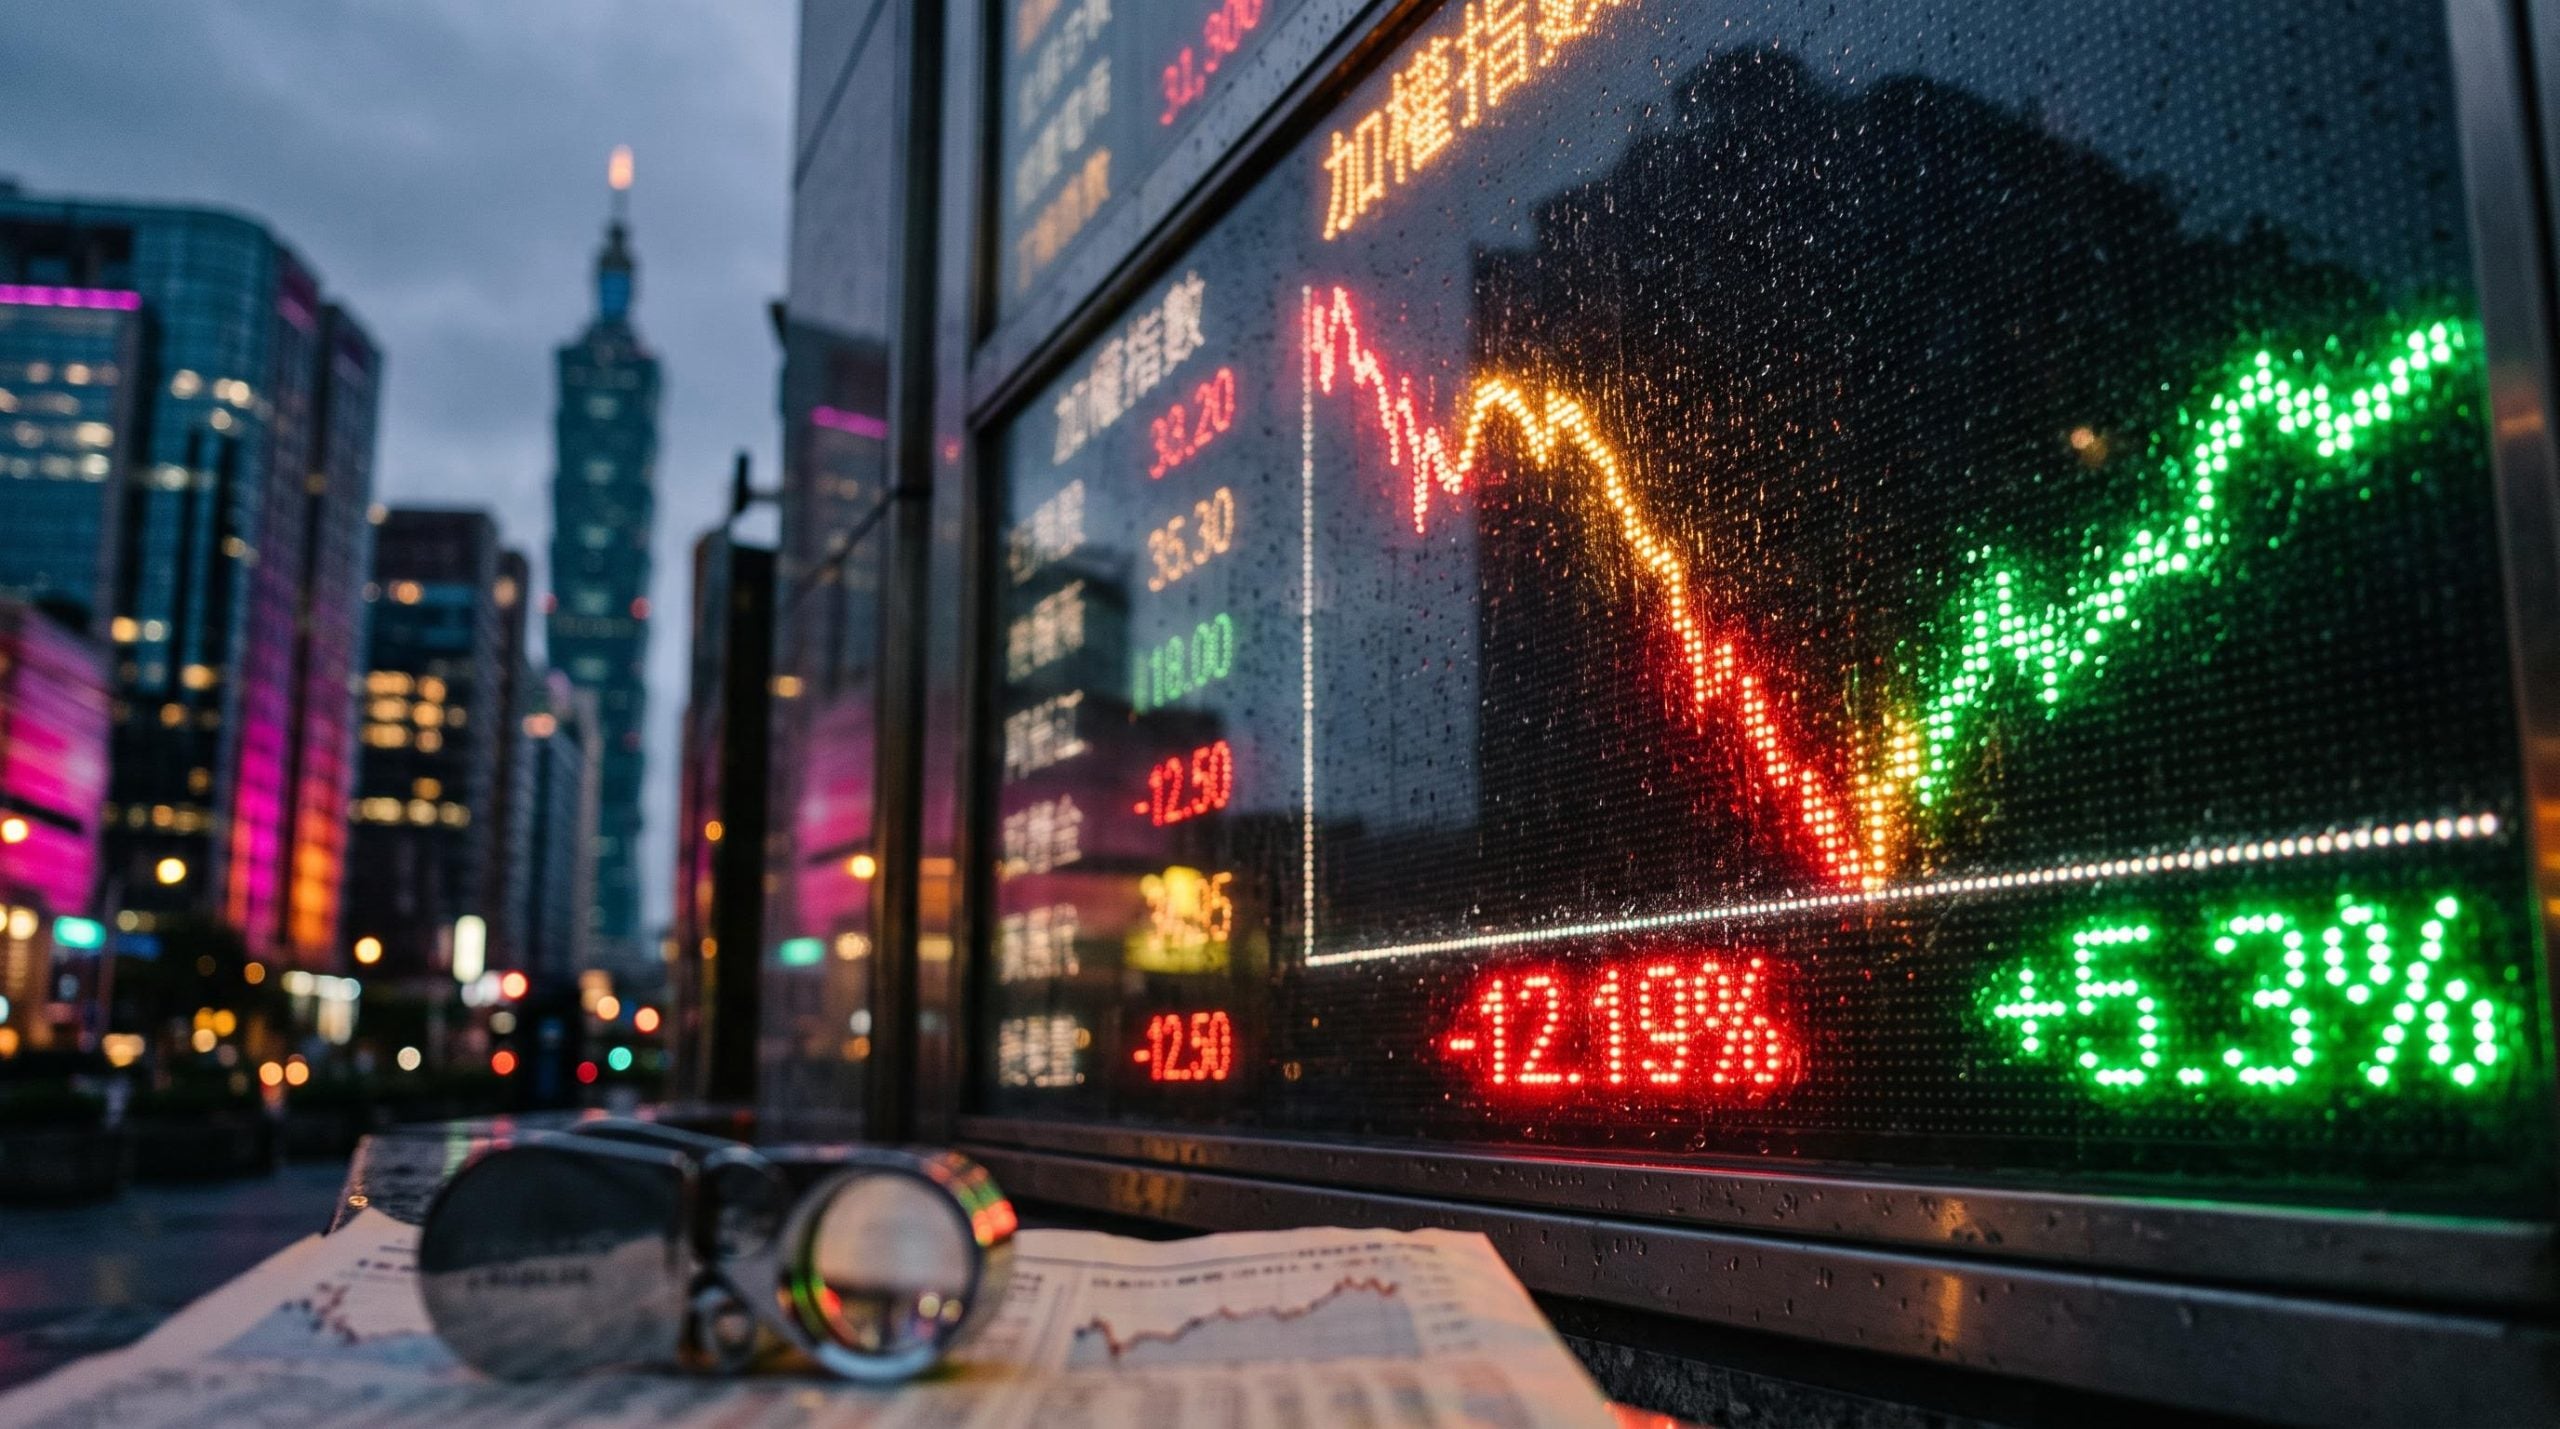
A 5.3% jump in Taiwan’s main index looks like a market that has put the worst behind it. Measured against the 12.19% the TAIEX lost the week before, Taiwan’s worst week in more than two decades, it recovers less than half the ground. That gap is the starting point for reading Asian stock markets right now.
The rebound on Monday, 9 November 2026, was led by Taiwan and Japan. It followed one of the sharpest tech-led weekly declines the region has seen in years, a stretch that ended with the Nikkei 225 falling 6.0% on Friday, its worst single-day drop since April 2025.
Monday’s reports framed the move as relief, not a change in the outlook. Doubts about AI profitability, infrastructure demand and Nvidia-related governance risk are still unresolved.
The useful skill is separating two kinds of force. Some features of these markets are structural: how concentrated the indices are, how much they depend on exports and how their currencies behave. Others are event-driven: AI spending doubts, the Nvidia probe and Bank of Japan signals. Once you can tell them apart, you can judge whether a swing like this one says anything about the economies behind it.
Why do Asian stock markets swing harder than the AI news alone would suggest?
One company makes up almost 40% of Taiwan’s benchmark index. That single fact explains much of what happened last week.
The AI worry was global, but the damage was regional and lopsided. The TAIEX fell 12.19% for the week and Korea’s Kospi lost about 12%. On Friday alone the Kospi dropped 6.0% and Taiwan slid 4.5%, according to Reuters and Morningstar/Dow Jones. Reuters described Taiwan’s loss as its largest weekly decline in more than two decades. Other reports date the record to 1999, 2001 or 1991, depending on whether they use closing or intraday data.
For context, Asia contributes about 70% of global economic growth. Tech firms carry the most weight on the bourses of Japan and South Korea, and increasingly mainland China, whereas banks and other financial names hold sway in Hong Kong and Singapore. Indices built this way respond to sector news far more than to the broader economy.
Taiwan: broad supply chain, one giant weight
Taiwan Semiconductor Manufacturing Company (TSMC) carries close to 40% of the TAIEX on its own. Around it sit MediaTek, ASE Technology, Hon Hai, Quanta and Delta Electronics, which add exposure to chip design, packaging, server assembly, power and cooling.
That makes the index a reading on almost every layer of the AI hardware build-out at once. When expectations for data-centre construction fall, each layer is hit together, with little elsewhere in the index to offset the losses.
Korea: a concentrated memory-cycle bet
Korea’s exposure is narrower. It is concentrated in cyclical memory producers, chiefly Samsung Electronics and SK Hynix, where memory prices, inventory levels and spending by hyperscalers (the largest cloud operators) drive large swings in earnings forecasts.
Manishi Raychaudhuri, writing in Reuters commentary on 8 November, drew the contrast directly: Taiwan offers broad AI supply-chain exposure, while Korea is a concentrated bet on the memory cycle.
The memory chip shortage helps explain why Korean earnings forecasts swing so sharply, since hyperscalers are now signing multi-year supply contracts that treat memory as strategic infrastructure rather than a commodity.
Currencies add another layer. A weaker Taiwan dollar or won lifts exporters’ revenue when it is converted back into local currency, but it can also signal foreign money leaving. A stronger US dollar raises the cost of dollar borrowing and can prompt foreign selling.
| Market | Dominant exposure | Recent move | Main sensitivity |
|---|---|---|---|
| Taiwan (TAIEX) | TSMC and the AI hardware supply chain | -12.19% prior week | Data-centre and chip order expectations |
| Korea (Kospi) | Memory chips (Samsung, SK Hynix) | About -12% prior week | Memory prices, inventories, hyperscaler spending |
| Japan (Nikkei 225) | Technology and manufacturing | -6.0% on Friday | Bank of Japan policy and the yen |
The practical lesson follows directly. When one stock or one sector carries this much weight, treat a headline index move as a reading on that sector, not as a verdict on Taiwan’s or Korea’s economy.
When big ASX news breaks, our subscribers know first
What actually triggered the rout: AI economics, politics or the Nvidia probe?
Structure explains how far the indices fell. It does not explain why they started falling, and the loudest headline turns out to be the weakest answer.
The principal catalyst was a reassessment of AI infrastructure economics. Democratic victories in the US midterm elections on 3 November 2026 sharpened it by raising the prospect of slower data-centre construction. Reuters’ market analysis noted that doubts about returns and debt-funded infrastructure had already weakened confidence before the vote.
Analysts emphasised different parts of the problem. Mark Fuchs, CIO of Fuchs Capital Partners, pointed to higher regulatory hurdles under a Democratic Congress. Michael McCarthy, CEO of moomoo Australia and New Zealand, focused on shifting expectations for AI capital expenditure (capex, money spent on long-term assets such as data centres). Susannah Streeter, chief investment strategist at Wealth Club, highlighted how much the build-out matters to US growth, construction and component suppliers, and how elevated valuations have shaped perceptions of household wealth.
The repricing view Fuchs characterised Asian tech as being repriced for more constrained demand, rather than reacting to news from a single company.
A wider Reuters survey captured the core doubt: investors are questioning whether the enormous AI spending will produce returns large enough to justify the debt and equity raised to fund it.
Then came Nvidia. On 8 November, after Friday’s sell-off had already happened, Nvidia’s board launched an independent investigation into whether CEO Jensen Huang was targeted by a foreign-intelligence operation. Nvidia said it had no reason to believe US national security or company secrets had been compromised. Senior House Republicans had already requested a closed-door briefing, and China has rejected the allegations as groundless.
Ranked by weight, the triggers stack up like this:
- AI return doubts: whether capex can earn back its debt and equity funding.
- US midterm result: the prospect of higher regulatory hurdles for data centres.
- Valuation and wealth effects: elevated prices leaving little room for disappointment.
- Nvidia probe: a forward volatility risk announced after the decline.
No source blames the sell-off solely on Nvidia, and the timing rules it out as the cause of last week’s fall. Analysts do expect the probe to add to volatility from here. The question to ask of any market-moving headline is whether it is a cause or a catalyst, because a single-company story rarely explains a 12% weekly drop.
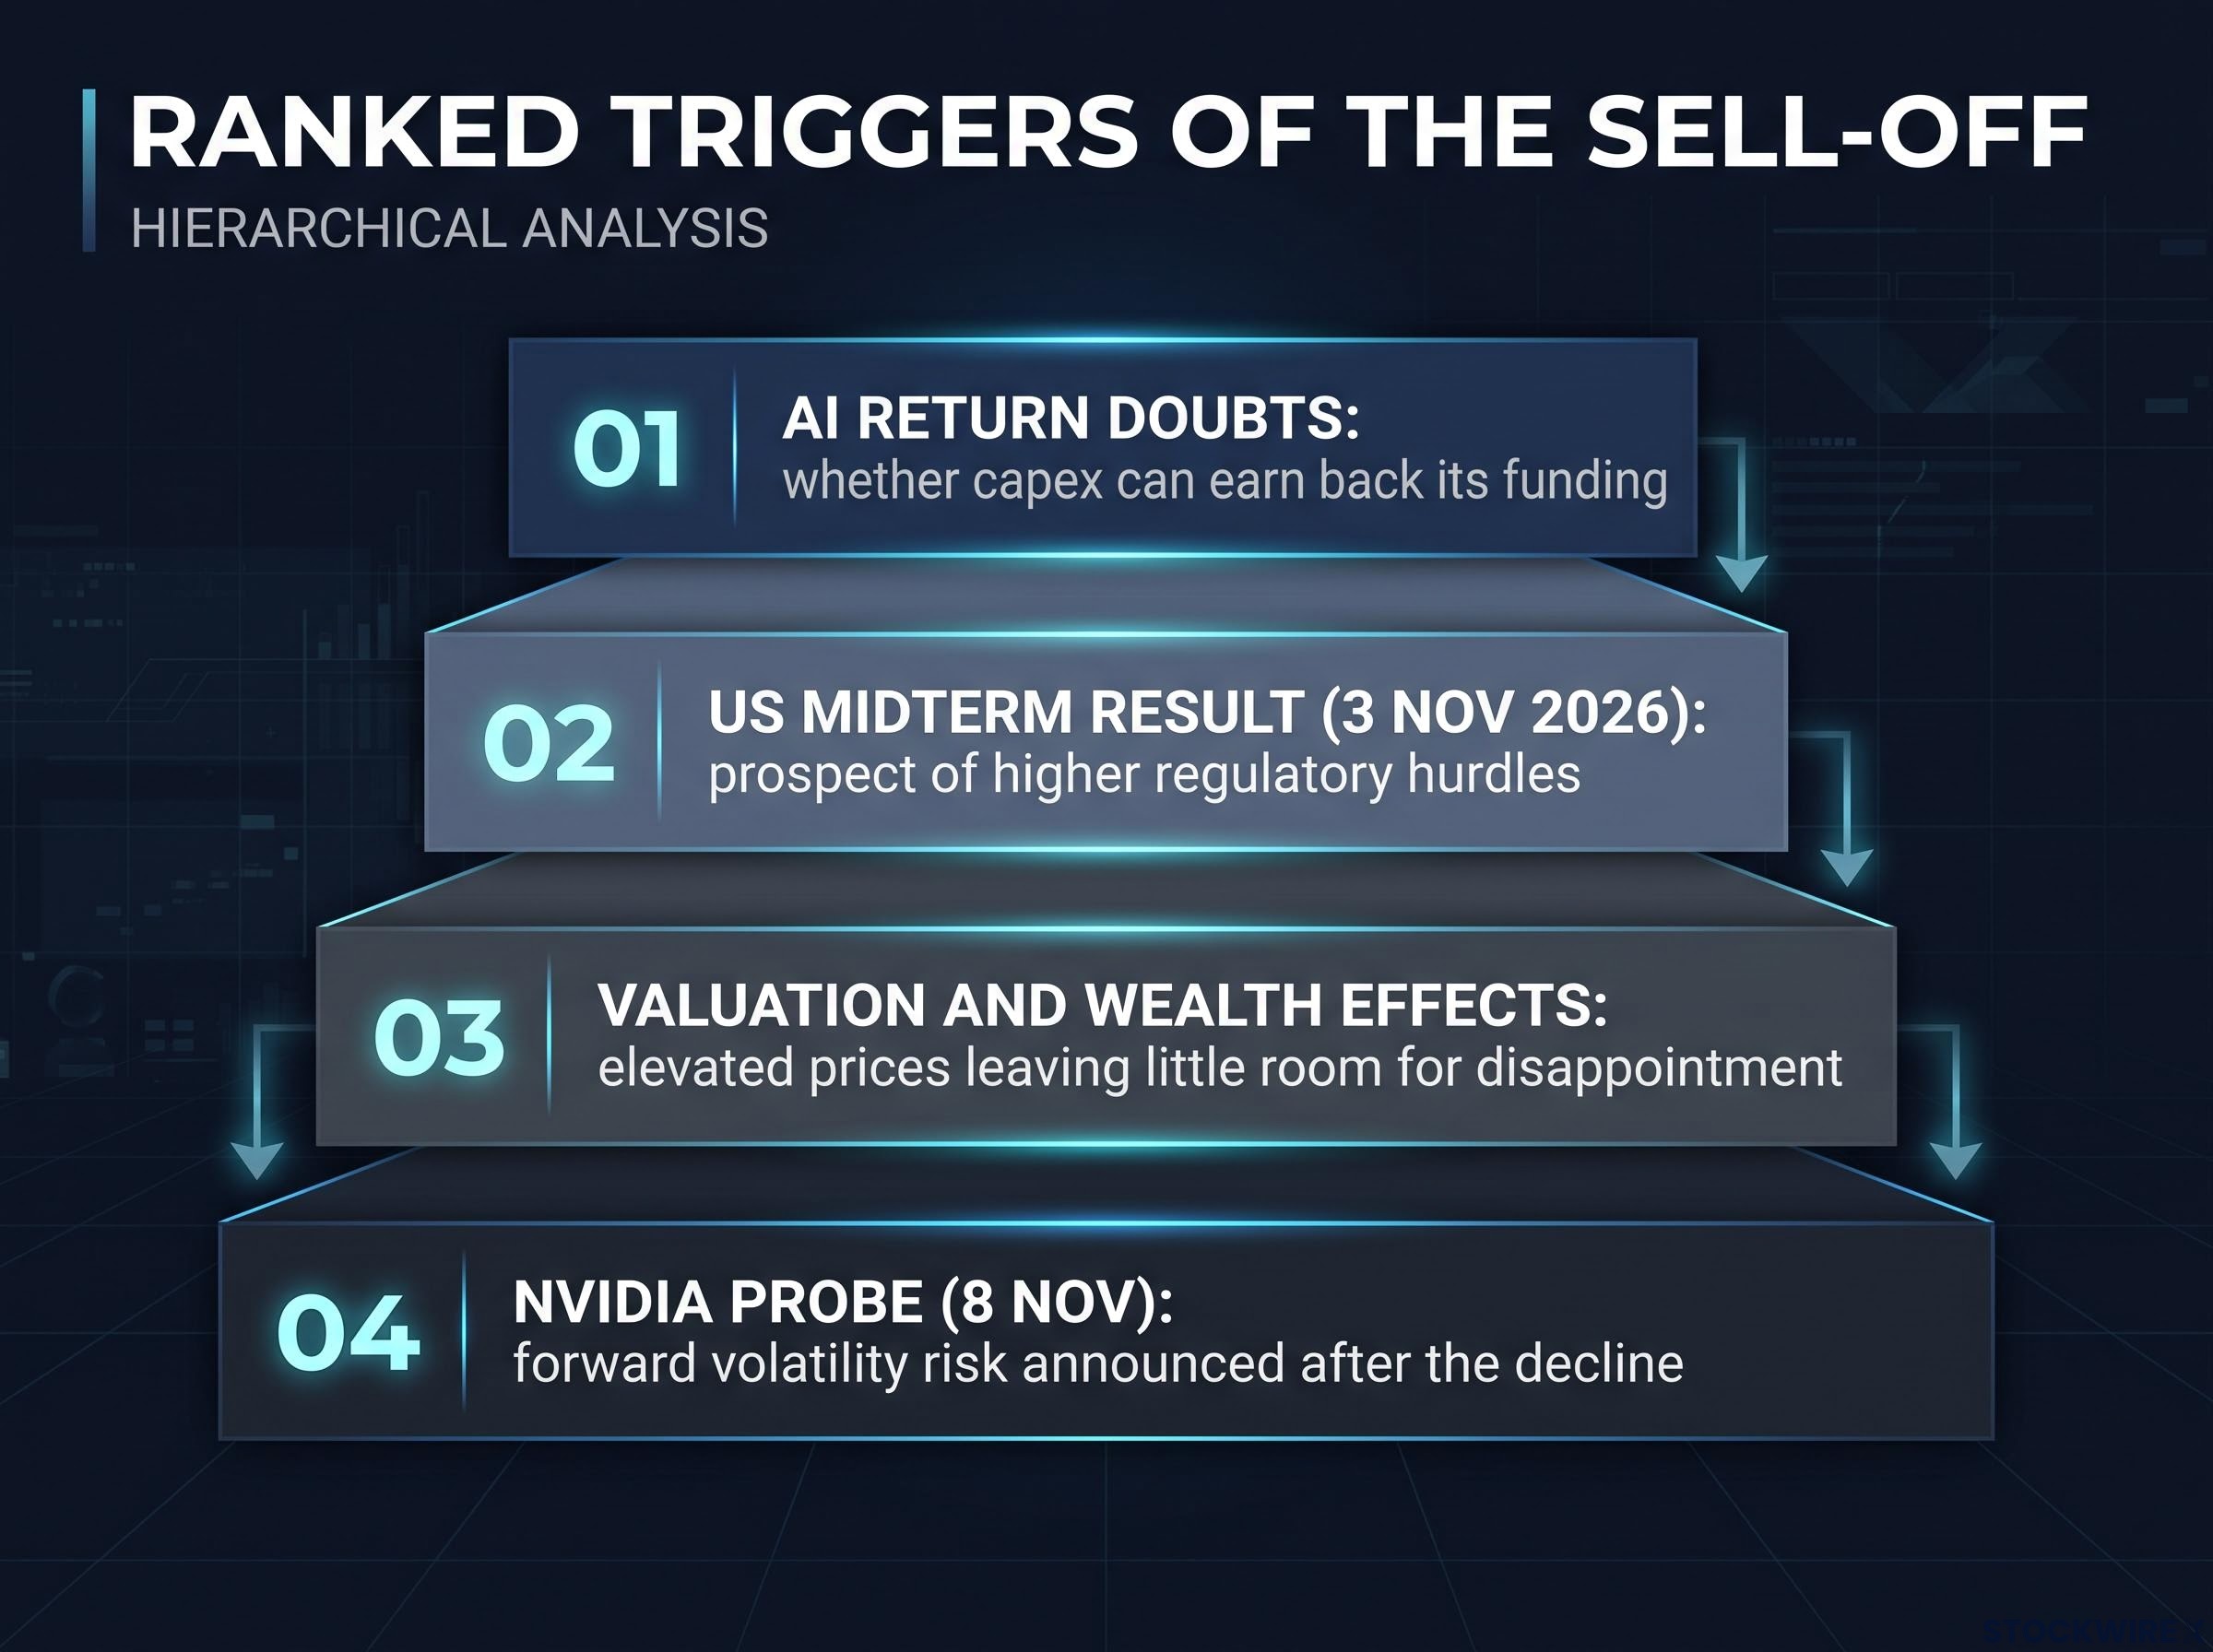
The Nvidia probe on 8 Nov was a trailing risk announced after the decline, following the US midterm result on 3 Nov 2026 and AI return doubts.
How do Bank of Japan signals and the yen add to the pressure?
Japan brought a separate source of pressure, one rooted in borrowing costs rather than chips.
The yen carry trade means borrowing cheaply in yen and investing the money in higher-yielding assets elsewhere. It works while Japanese rates stay low. When the Bank of Japan (BoJ) signals tighter policy, the yen tends to strengthen and the rate advantage narrows, which can force borrowers to sell assets and repay their loans.
The chain runs in four steps:
- BoJ signals higher rates, narrowing the gap with other markets.
- The yen strengthens, raising the cost of repaying yen loans.
- Leveraged investors unwind positions to limit losses.
- Risk assets are sold, often well outside Japan.
The minutes published on 5 November 2026, covering the 17-18 September meeting, showed most policymakers favouring further hikes as underlying inflation neared 2%. One proposal was a 25 basis point hike to about 1.25%, and the BoJ currently guides its overnight call rate around 1.25%. Reuters said the discussion strengthened the case for a possible December hike.
The yen strengthened for two consecutive sessions, trading around ¥157.8 per dollar according to Trading Economics on 6 November, and ¥157.70 according to ABN Amro. Hike expectations and safe-haven demand both played a part.
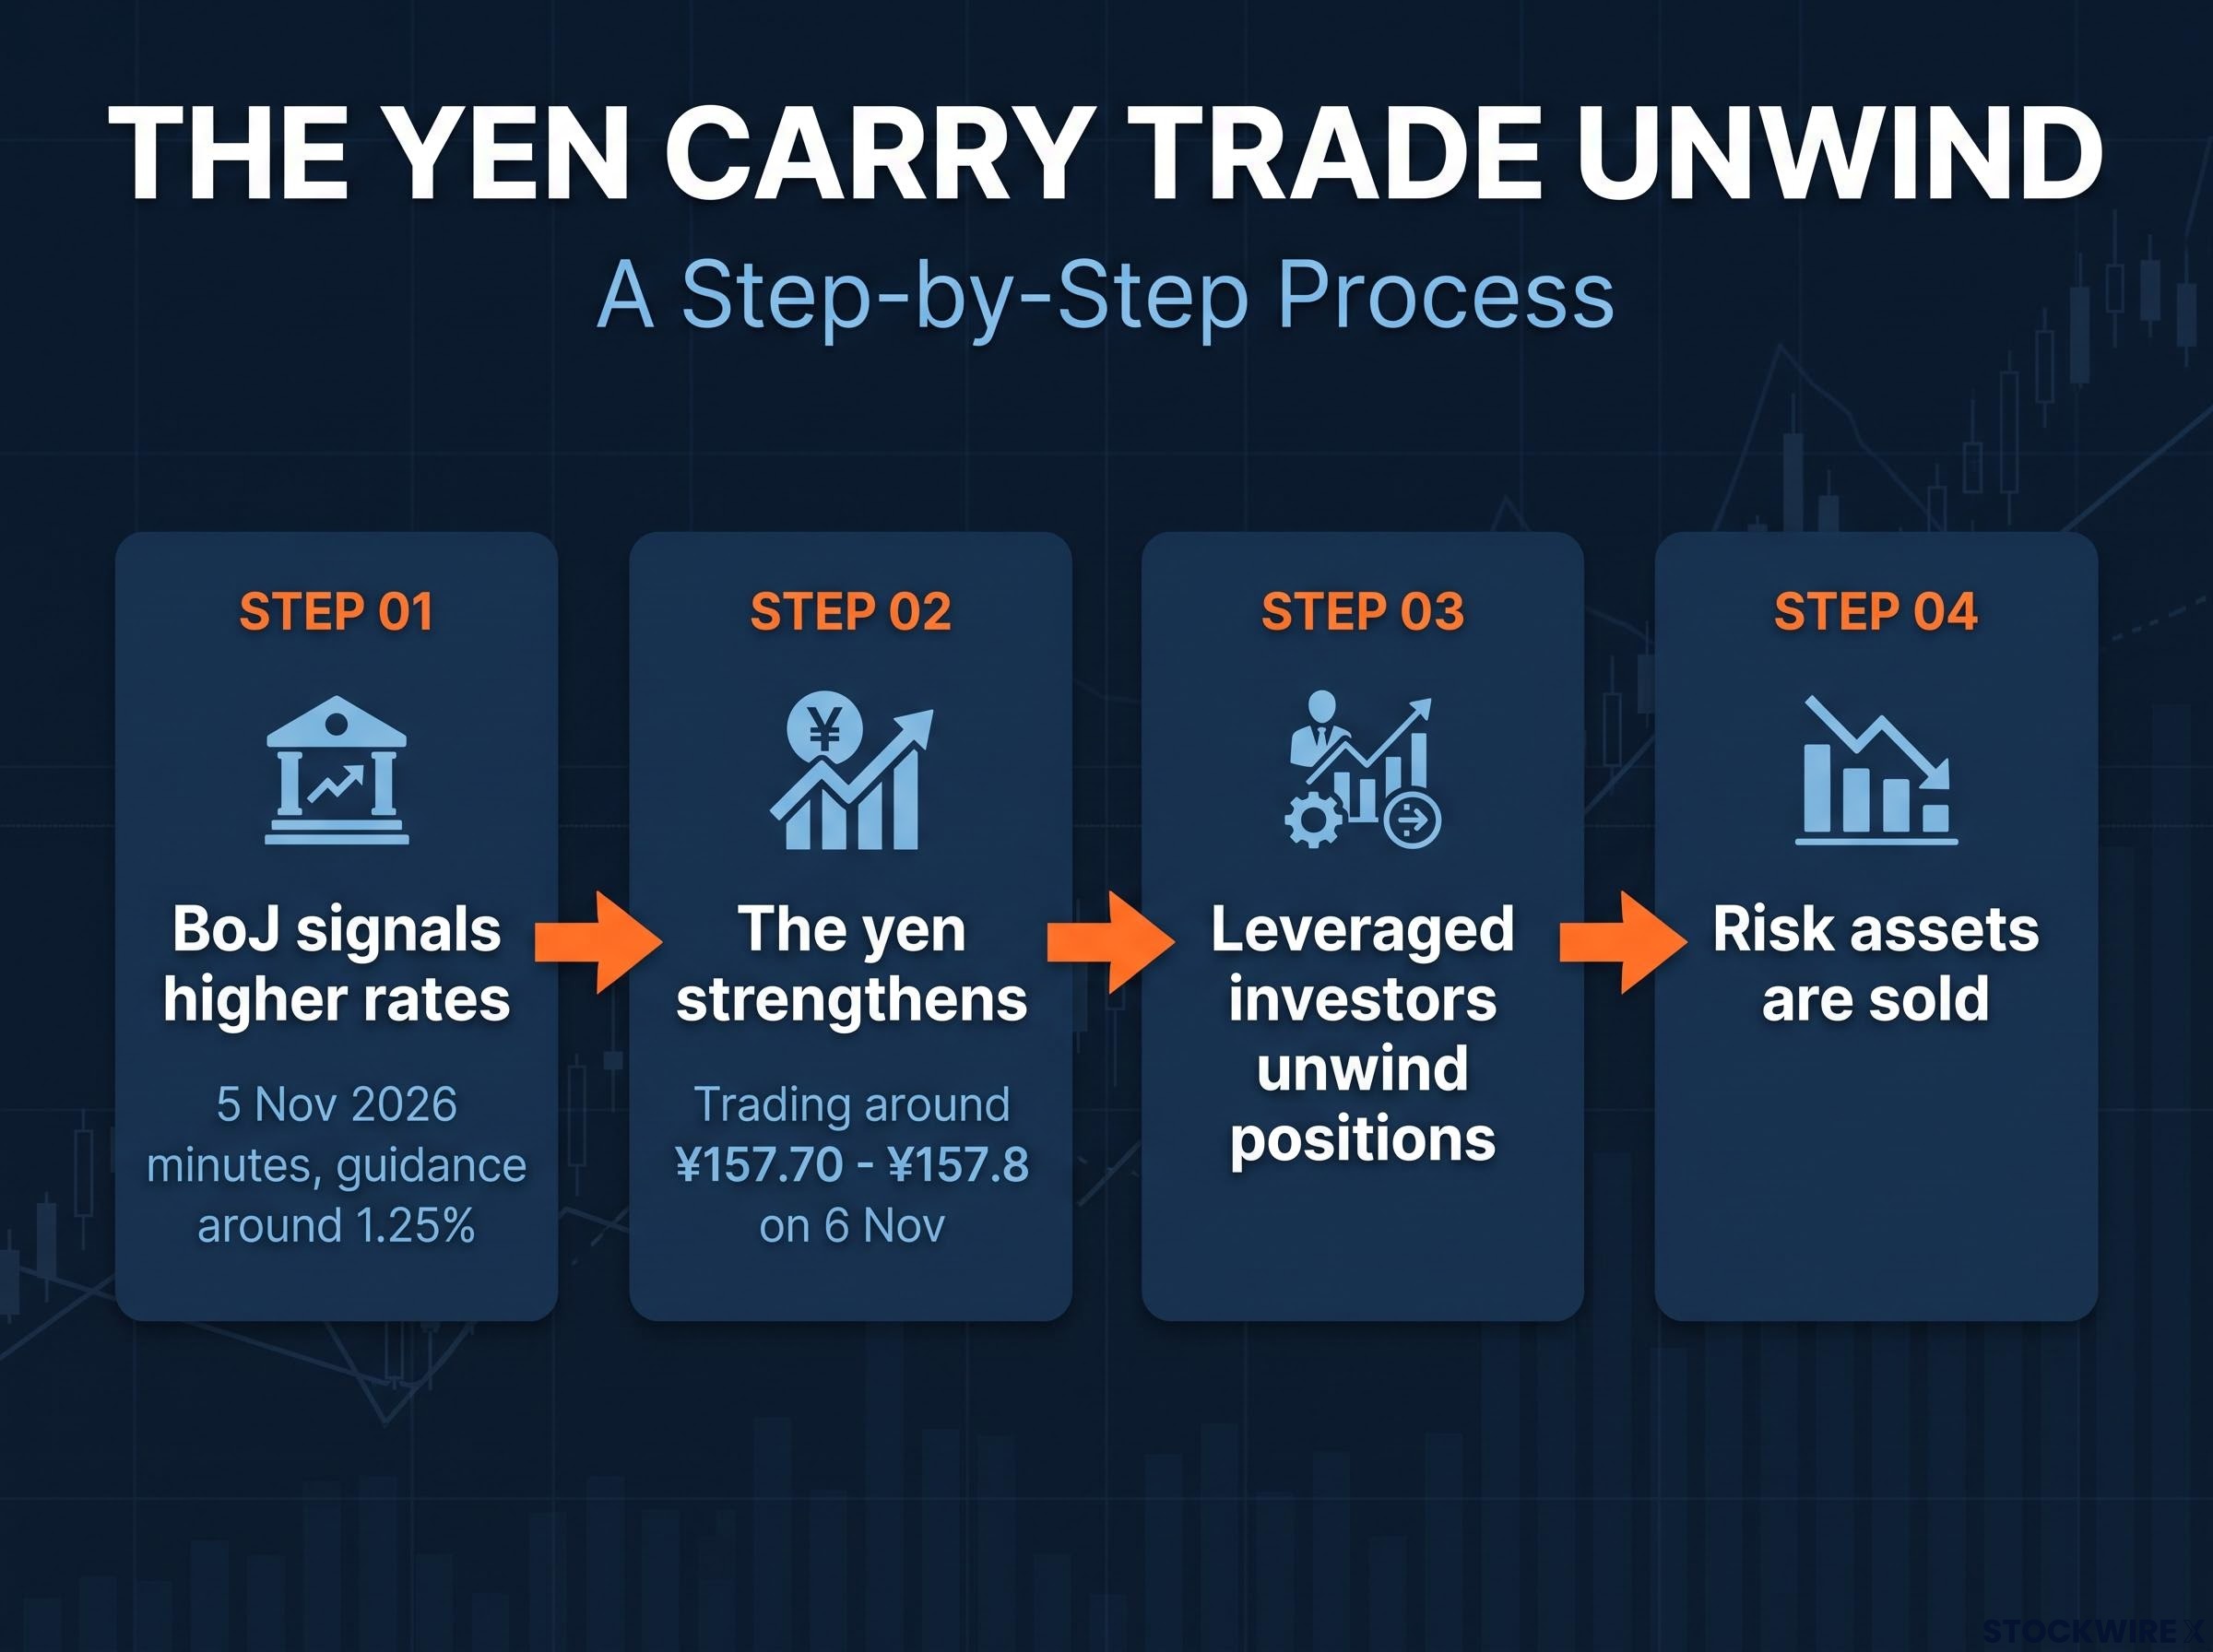
The Bank of Japan 5 Nov 2026 minutes signaling 1.25% guidance led the yen to strengthen to ¥157.70 – ¥157.8 on 6 Nov, triggering asset sales.
August 2024 shows how fast this channel can act: a BoJ hike and a sharp yen rally forced carry-trade unwinds and a global sell-off. This episode is less clear-cut. A stronger yen does not mechanically mean lower Japanese shares every session, and the Nikkei rose 2.90% to 59,090 on Monday after Friday’s fall to 57,434.77. Early reports of a 3.4% gain reflected an intraday reading, not the close.
| Index | Monday move | Close |
|---|---|---|
| TAIEX | +5.30% | ~41,800 |
| Nikkei 225 | +2.90% | 59,090 |
| Shanghai Composite | +0.35% | 3,660 |
| Hang Seng | +0.13% | 24,520 |
| Shenzhen Component | -0.14% | 11,160 |
For you, a rising yen alongside falling Asian equities is a prompt to check whether leveraged positions are being unwound. It is a signal worth testing, not a guaranteed link.
Temporary correction or structural reset: how should you read the bounce?
Monday’s numbers support more than one story. The table below sets out the three main readings, each with its strongest argument and its weak point.
| Interpretation | Reasoning | Caveat |
|---|---|---|
| Positioning unwind | The rebound followed a recovery in US AI shares and was led by the most heavily sold chip stocks; margin calls and concentration exaggerate short-term moves | A bounce driven by short covering can fade if earnings or capex data disappoint |
| Structural AI valuation reset | Investors doubt data-centre spending will deliver enough cash flow, and politics may raise project hurdles | Markets may be pricing in a slowdown before demand actually weakens |
| Rotation, not collapse | The long-term case is that AI lifts productivity and earnings | High debt, weak free cash flow and customer concentration leave the transition exposed |
The stakes in the third reading are large. Reuters cited a downside scenario in which a major drop in AI investment could cut global GDP by 1.1% by 2028. Projections like this are scenarios, not forecasts, and depend on market conditions.
History offers the best test of these readings:
- August 2024: a BoJ hike and yen surge forced a carry-trade unwind and a global sell-off.
- April 2025: the tariff shock produced the Nikkei’s previous worst single day before last Friday.
- Earlier 2025 AI sell-offs: sharp repricing was typically followed by rebounds when the feared damage did not arrive.
This episode adds political and financing questions those precedents lacked: whether the data-centre build-out can continue at its earlier pace at all. Taiwan’s 5.3% bounce after a 12% fall fits the pattern of an overshoot, helped by bargain-hunting in TSMC. It does not show that valuation concerns have been resolved.
The risk list remains long: valuations, weak capex returns, debt financing, regulation, concentration in a handful of chipmakers, forced deleveraging, currency volatility, yen-carry disruption and national-security risk around advanced chips. Asian indices also respond to earnings, central bank and fiscal policy, political stability and Wall Street sentiment, and exporters generally suffer when their currencies strengthen.
A single rebound day cannot settle this debate. The next round of earnings and capex updates will do more to tilt the evidence than any one session.
What to watch next in Asian stock markets, and what a rebound cannot tell you
Concentration and currency sensitivity set how big the swings are. AI economics, US politics, Nvidia and the BoJ set their direction. Keep those two layers separate and the noise becomes easier to read.
Four markers will shape the next move:
- Nvidia’s independent investigation and whatever it concludes.
- A possible December BoJ hike, signalled by the September minutes.
- AI capex and earnings updates from chipmakers and hyperscalers.
- The yen’s path around ¥157-158 per dollar.
Monday’s gains remain a partial recovery from a historic week, not proof that the questions behind it have been answered.
This article is for informational purposes only and should not be considered financial advice. Investors should conduct their own research and consult with financial professionals before making investment decisions.