The conventional wisdom heading into Q2 2026 earnings season was that global equity returns had become dangerously narrow, propped up by a handful of U.S. artificial intelligence names. The data told a different story. When the results came in, the earnings expansion was wider, deeper, and more geographically distributed than the concentration narrative had prepared investors to expect.
That matters because the breadth question, whether profits were genuinely growing across sectors and regions or merely appearing to grow thanks to distortions at the sector level, is the one that determines whether global equity valuations have a foundation or a mirage beneath them. Q2 2026 produced enough data across eurozone indices and U.S. sector breakdowns to answer it with unusual clarity.
Here is the interpretive lens that separates useful earnings analysis from headline-chasing: after reading this, you will be able to identify which Q2 sector results reflected durable business performance, which reflected transitory commodity or accounting effects, and what that distinction means for how you think about global equity exposure heading into the second half of the year.
Eurozone earnings delivered the breadth story the headline figures promised
The scale of the eurozone result commands attention before the composition does. The STOXX 600, with approximately 83% of companies having reported, delivered aggregate earnings-per-share (EPS) growth of approximately 20% year-over-year. The MSCI EMU index, with roughly 93% of constituents reporting, showed growth of +14.6% year-over-year. The gap between those two figures reflects differences in index methodology, specifically constituent weighting and reporting cutoff dates, not conflicting data.
| Index | Q2 2026 EPS Growth (YoY) | Reporting Completion |
|---|---|---|
| STOXX 600 (aggregate) | ~20% | ~83% |
| STOXX 600 (ex-energy) | ~10.3% | ~83% |
| MSCI EMU | +14.6% | ~93% |
What makes the breadth claim defensible is the composition beneath those headline figures:
- 8 of 11 MSCI EMU sectors recorded positive earnings growth, meaning the expansion was structurally broad rather than carried by one or two dominant contributors.
- 8 of 10 STOXX 600 sectors were on track for profit growth, reinforcing the same breadth signal across a wider constituent base.
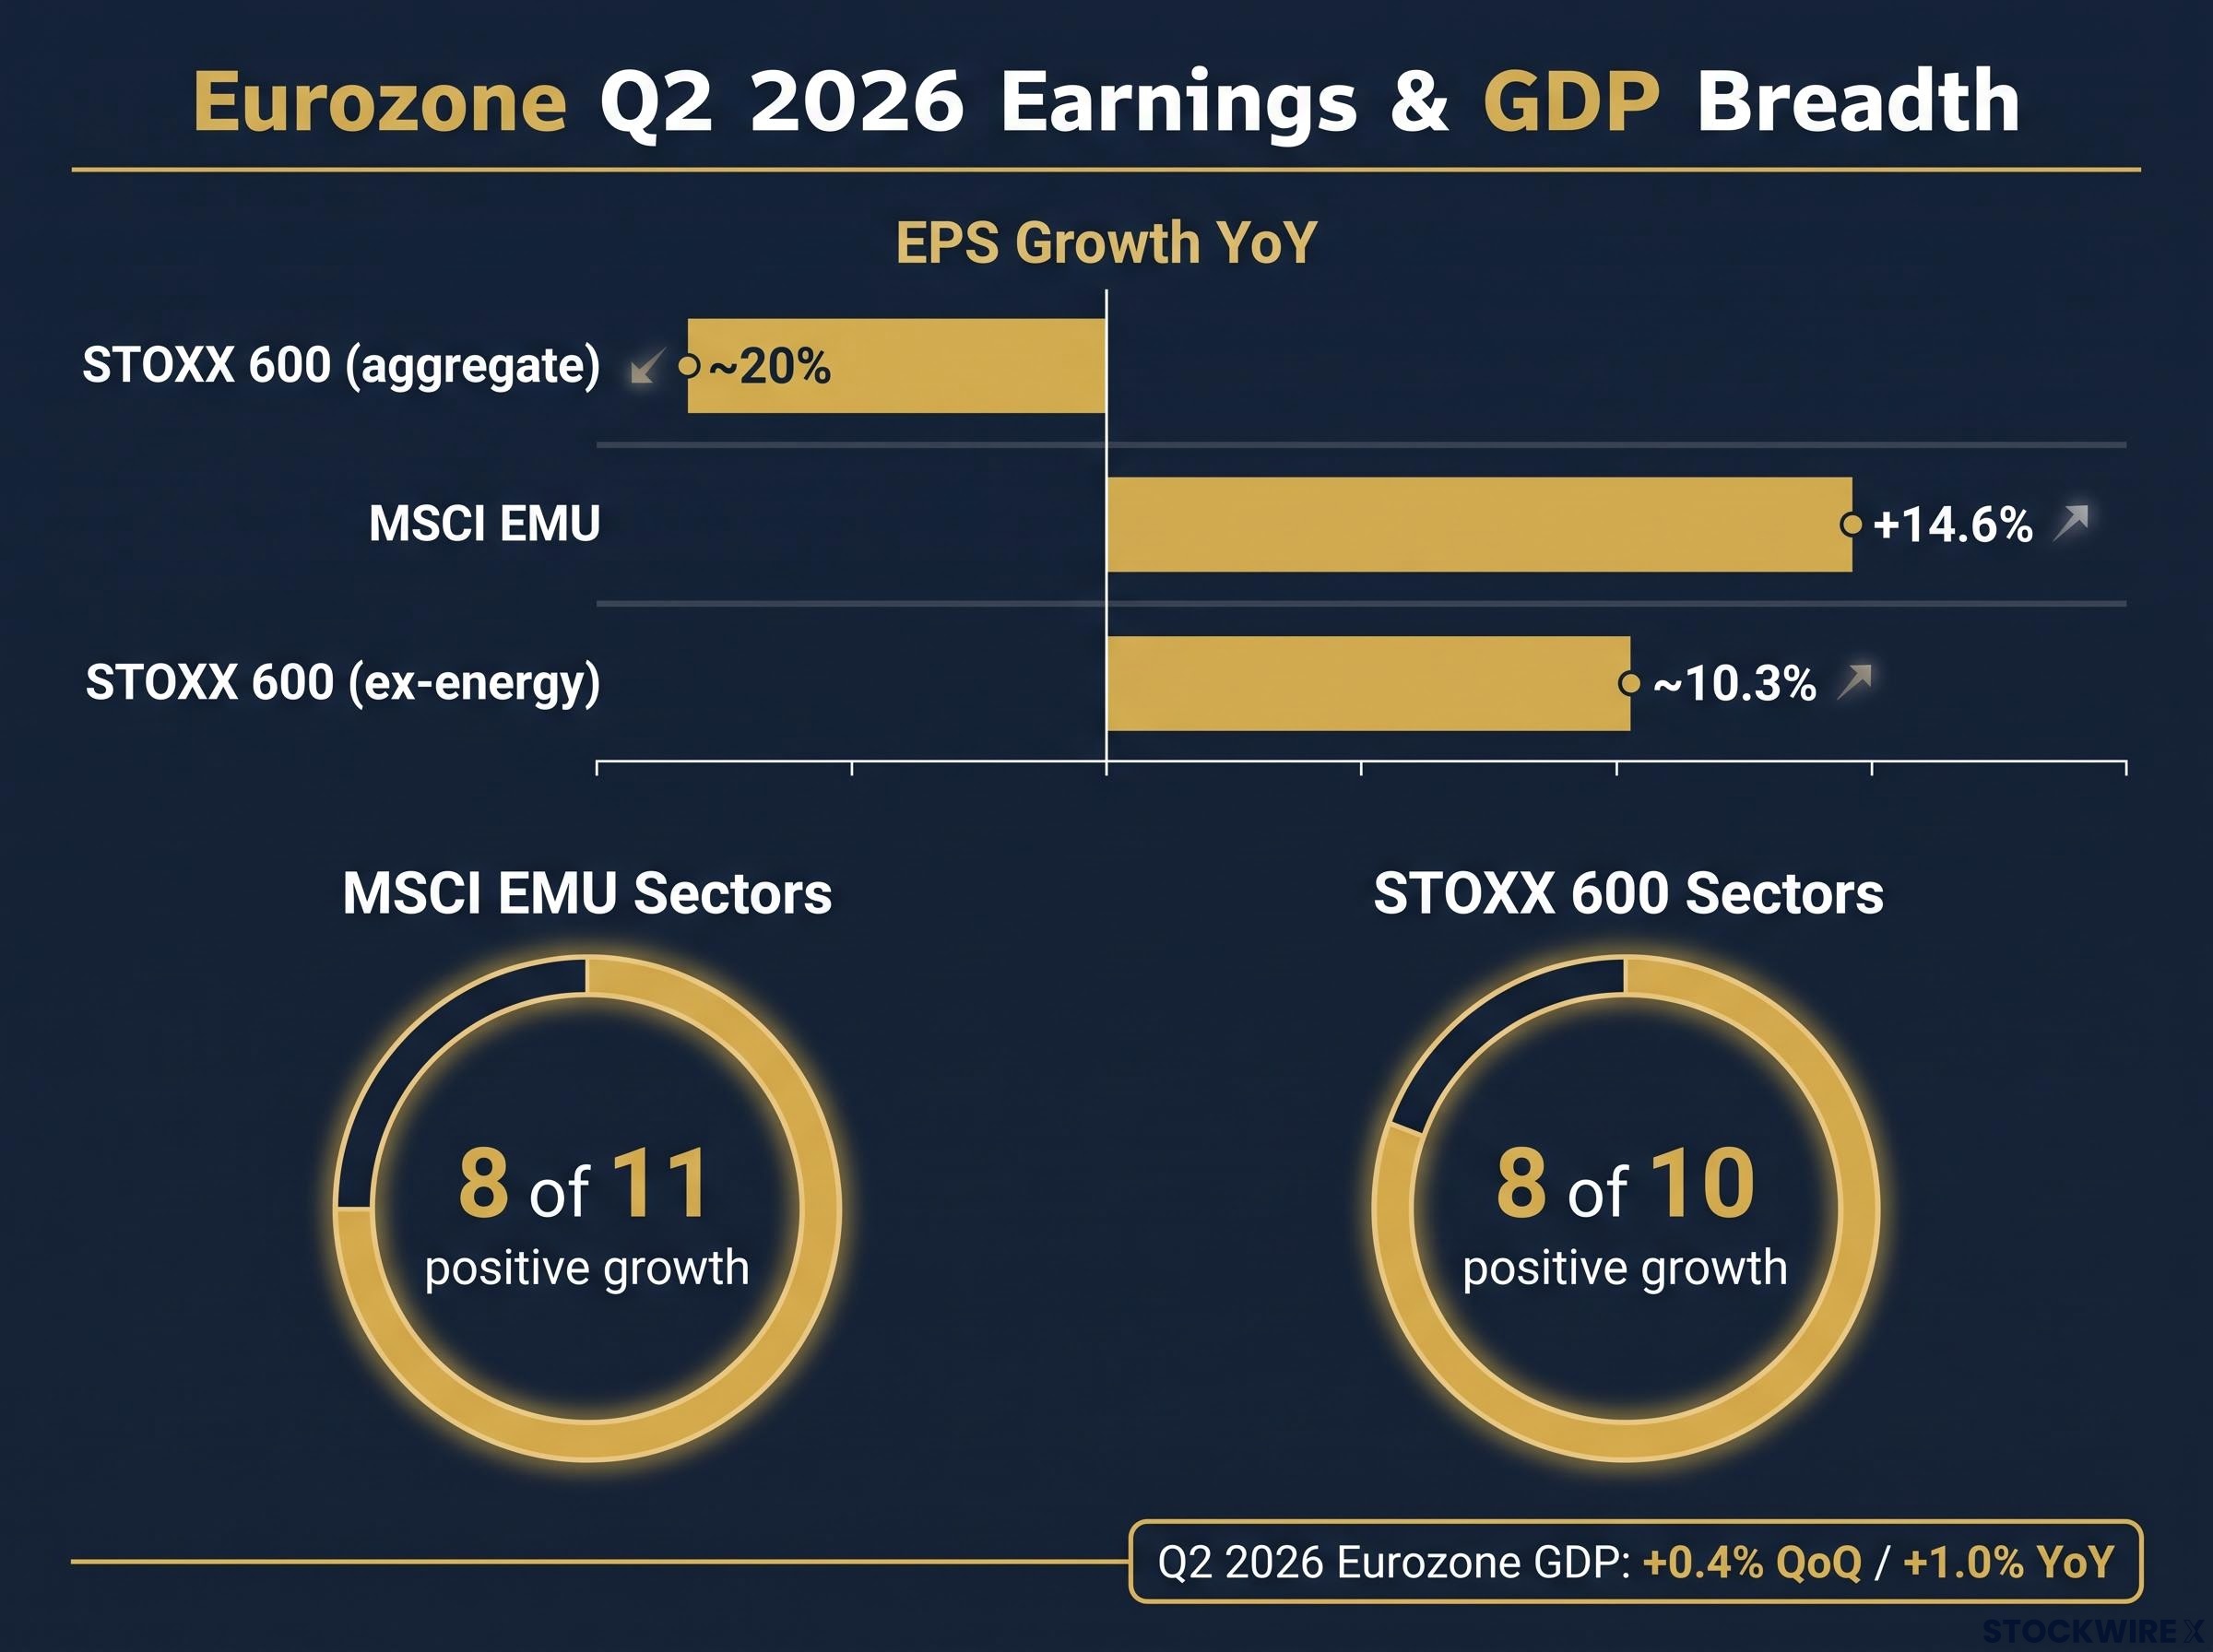
The number that matters most for investors testing the quality of this result is the ex-energy figure: approximately 10.3% year-over-year. Strip out the commodity-sensitive sector entirely and European corporate profits still grew at a double-digit pace. That tells you eurozone earnings health was not borrowed from elevated oil and gas prices. The breadth case for European equities has a genuine operational foundation, not a statistical one.
When big ASX news breaks, our subscribers know first
Europe’s macro backdrop explains why the earnings held up
Corporate earnings do not arrive in a vacuum. The Q2 eurozone GDP data, released via Eurostat flash estimates, provided the demand-side foundation that made those profit numbers possible.
The Eurostat flash estimates confirmed quarter-on-quarter growth of 0.4% and year-on-year growth of 1.0% for Q2 2026, providing the demand-side validation that makes the broad-based corporate profit expansion analytically coherent rather than coincidental.
Eurozone GDP grew +0.4% quarter-over-quarter and +1.0% year-over-year in Q2 2026, the strongest expansion in over a year.
That acceleration is meaningful in context. Q1 2026 delivered flat or minimal growth, which means Q2’s improvement represented a genuine inflection rather than a continuation of a trend that was already running.
Two specific structural contributors underpinned the result: net exports, which benefited from a weaker euro relative to major trading partners, and labour market stability, which kept consumer spending from contracting even as geopolitical tensions and trade frictions weighed on sentiment. The fact that European corporates delivered broad-based profit growth against a backdrop that included ongoing conflict in the Middle East and active tariff disputes makes the result more significant, not less.
For your global equity allocation, this changes the framing around eurozone valuations. European equities have historically traded at discounts to U.S. equivalents. Q2 2026 data shows that discount is now accompanied by accelerating profit growth backed by improving economic conditions, a combination that alters the risk-reward calculation.
What Energy’s triple-digit surge actually tells you, and what it does not
S&P 500 Energy sector earnings posted growth of approximately 122-147% year-over-year in Q2 2026, depending on the source. The range reflects differences in reporting cutoff dates and constituent weighting rather than data unreliability. Either way, Energy was the strongest sector by a wide margin, and the number is dramatic enough to demand scrutiny.
Why it does not signal lasting strength
The driver was straightforward: a substantial year-over-year increase in average WTI crude prices over the comparable period. This was a commodity price story, not a volume growth or structural business improvement story. Oil and gas companies’ profitability is driven primarily by what crude fetches on global markets rather than how much of it they actually extract and sell, which means Q2’s result reflects oil’s pricing trajectory over the comparable period far more than it reflects any improvement in the sector’s underlying earnings capacity.
The oil supply dynamics that inflated Energy sector comparables in Q2 were themselves the product of a geopolitical disruption of unusual severity: Saudi output had collapsed to a 36-year low earlier in 2026, global inventories were drawing at record pace, and emergency reserve releases failed to halt the drawdown, creating the elevated price baseline that made triple-digit year-over-year EPS comparisons arithmetically inevitable.
Worldwide oil inventories and production capacity have expanded more than markets had previously assumed. Once oil prices normalise, year-over-year comparisons will likely compress as sharply as they expanded. Investors who read Q2 Energy results as a signal of sector strength may be setting themselves up for a jarring recalculation when the base effect reverses.
For broad market analysis, treating Energy’s contribution as a commodity-price distortion is analytically cleaner. The sector’s triple-digit growth tells you about oil’s price trajectory, not about the durability of corporate earnings improvement.
Knowing which components of an earnings beat are transitory protects against overweighting a sector at precisely the wrong point in the commodity cycle.
Health Care’s headline decline was a one-off, not a diagnosis
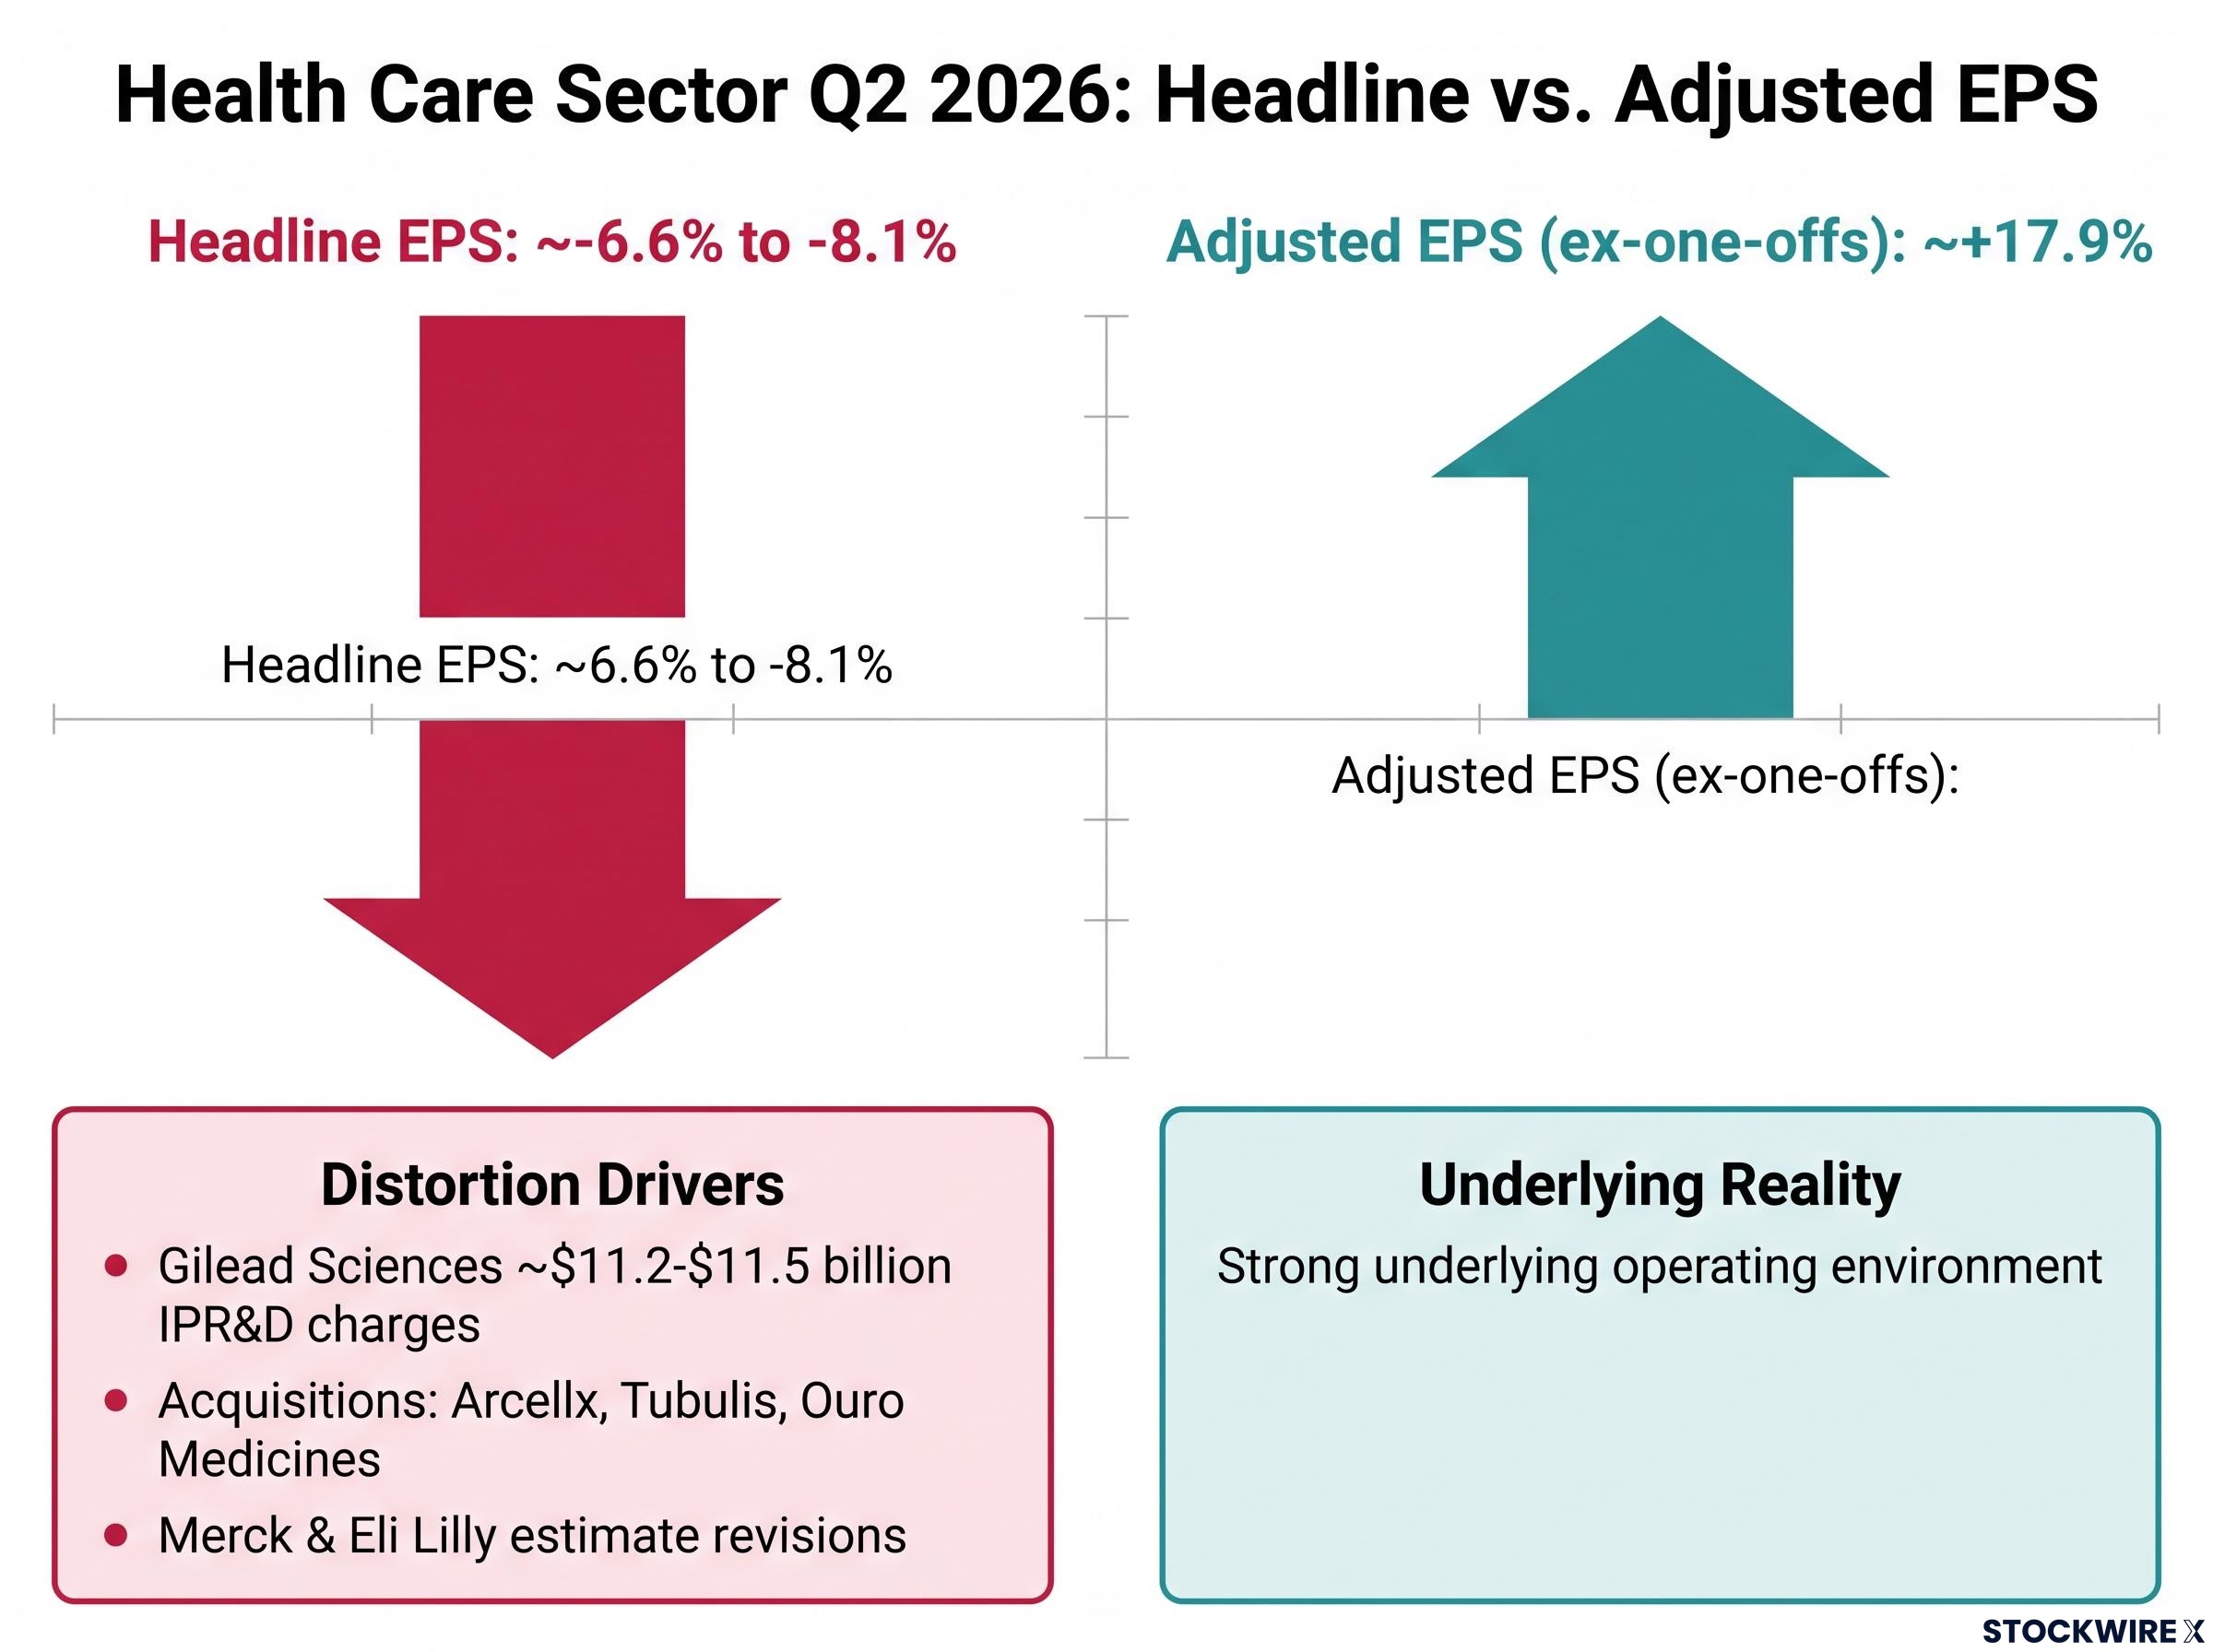
Health Care was the only major U.S. sector to post a Q2 earnings decline on a headline basis, with reported EPS falling approximately -6.6% to -8.1% year-over-year depending on the source. That looks like a problem. It was not.
The decline was overwhelmingly concentrated in non-recurring charges at a small number of large constituents. Gilead Sciences reported a GAAP net loss driven by approximately $11.2-$11.5 billion in acquired in-process research and development (IPR&D) charges, which are one-time accounting items triggered by acquisitions. IPR&D charges represent the estimated fair value of research programmes acquired through a takeover that have not yet received regulatory approval. These charges hit the income statement immediately but do not reflect ongoing business deterioration. Gilead’s charges were tied to its acquisitions of Arcellx, Tubulis, and Ouro Medicines. Separately, estimate revisions at Merck and Eli Lilly further weighed on sector aggregates.
Gilead Sciences Q2 2026 financial results disclosed acquired in-process R&D expenses of approximately $11.2 billion, allocated across the Arcellx, Tubulis, and Ouro Medicines acquisitions, confirming that the charges were one-time accounting items with no bearing on the company’s ongoing operational trajectory.
| Measure | Q2 2026 EPS Growth (YoY) | Primary Driver of Difference |
|---|---|---|
| Health Care (headline) | ~-6.6% to -8.1% | Gilead IPR&D charges (~$11.2-$11.5B), Merck/Lilly revisions |
| Health Care (ex-one-offs) | ~+17.9% | Underlying operating performance across sector |
Once the one-time charges are removed from the calculation, Health Care’s adjusted EPS growth comes to approximately +17.9% year-over-year, a figure that would have placed the sector among the quarter’s stronger performers.
The analytical principle here applies in both directions. Just as investors strip out non-recurring gains to assess earnings quality, non-recurring losses warrant equivalent scrutiny. The +17.9% adjusted figure tells you that Health Care’s underlying operating environment was strong in Q2 2026. The headline decline, taken at face value, would have led to a fundamentally incorrect assessment of sector health.
This article is for informational purposes only and should not be considered financial advice. Investors should conduct their own research and consult with financial professionals before making investment decisions.
Communication Services shows what structural earnings growth looks like
Communication Services posted EPS growth of approximately 116.9% year-over-year in Q2 2026. The number sits in the same triple-digit territory as Energy’s result. The analytical meaning is entirely different.
Three operational drivers powered the sector’s performance:
- Digital advertising recovery: Ad spending across major platforms rebounded as brand budgets that were pulled during prior quarters returned, supported by improved targeting capabilities.
- Streaming economics: Major streamers demonstrated meaningful margin improvement as subscriber acquisition costs declined and pricing power increased.
- Platform monetisation: AI-linked improvements in ad targeting and user engagement lifted revenue per user alongside core business momentum.
No single commodity price underpinned the result. No large non-recurring charge distorted it. Communication Services growth in Q2 was business-driven, built on operational improvements across multiple revenue streams rather than a temporary external factor.
This sector gives you a practical benchmark for evaluating earnings quality. When headline growth is both large and structural, it belongs in the analysis without adjustment. That is the test Energy fails and Health Care passes only after stripping the one-offs. Communication Services passes it cleanly, which makes its 116.9% figure a reference case for what durable earnings improvement actually looks like in the data.
What the full Q2 picture means for global equity positioning
Once commodity and one-off distortions are properly adjusted, a coherent picture emerges: global corporate earnings in Q2 2026 were broad-based in both geographic and sector terms. The breadth was not illusory. The question now is which parts of it rest on durable foundations.
Three portfolio-relevant conclusions follow from the Q2 data:
- The eurozone weight case has strengthened. European valuations continue to trade at meaningful discounts to U.S. equivalents, yet Q2 data shows that discount is accompanied by genuine earnings breadth across the majority of sectors. The STOXX 600 ex-energy figure of approximately 10.3% year-over-year removes the commodity objection.
- Sector-level analytical discipline separates signal from noise. Health Care’s adjusted +17.9% growth and Communication Services’ structural 116.9% growth tell you materially different things than their headline figures suggest when read alongside Energy’s commodity-driven surge. Applying a consistent transitory-versus-structural lens is what converts raw data into usable investment intelligence.
- H2 2026 uncertainty remains real, but the evidence base has shifted. Middle East conflict, trade tariffs, and shifting supply dynamics did not prevent broad-based profit growth in Q2. That does not eliminate those risks for the second half, but it does change the starting point from which they should be assessed.
Past performance does not guarantee future results. Financial projections are subject to market conditions and various risk factors.
The earnings picture investors should carry into H2 2026
Q2 2026 results shifted the analytical burden. The question is no longer whether global earnings growth is real. It is which parts of it are durable. That is a more productive question to carry forward, and Q2 data gives you the framework for answering it.
Three variables will determine whether Q2’s broad-based picture holds through Q3 and into year-end:
- Oil price trajectory: Energy’s commodity dependence means any normalisation in WTI crude will compress the sector’s contribution as sharply as it expanded. Watch for base-effect reversals in Q3 comparisons.
- Eurozone demand sustainability: Q2 GDP acceleration followed a flat Q1. Whether European consumer and export strength persists through the second half will determine if the earnings breadth story has staying power.
- Health Care adjusted earnings trajectory: The +17.9% adjusted figure needs to hold or improve. If underlying Health Care earnings decelerate once the one-off noise clears, Q2’s adjusted picture was overstating operational momentum.
Base-effect reversals in commodity earnings are not hypothetical for H2 2026: Brent crude had already collapsed 38% from its March 2026 peak by late June, a price trajectory that will compress Energy sector year-over-year comparisons as sharply as the prior spike expanded them.
Data for Q2 2026 was largely complete as of 18 August 2026, based on FactSet Earnings Scorecard and Fisher Investments research.
The analytical discipline applied to Q2 distortions, stripping commodity effects, adjusting for non-recurring charges, testing whether headline figures reflect operational reality, should be applied with equal rigour when Q3 results arrive.
That discipline is the difference between reacting to earnings season and reading it.
For investors exploring whether Q2’s eurozone breadth result fits within a longer structural shift in relative returns, our full explainer on market leadership rotation examines the valuation spreads between US Technology and international developed markets, covering how prior episodes of extreme concentration resolved and what incremental rebalancing looks like in practice.
—