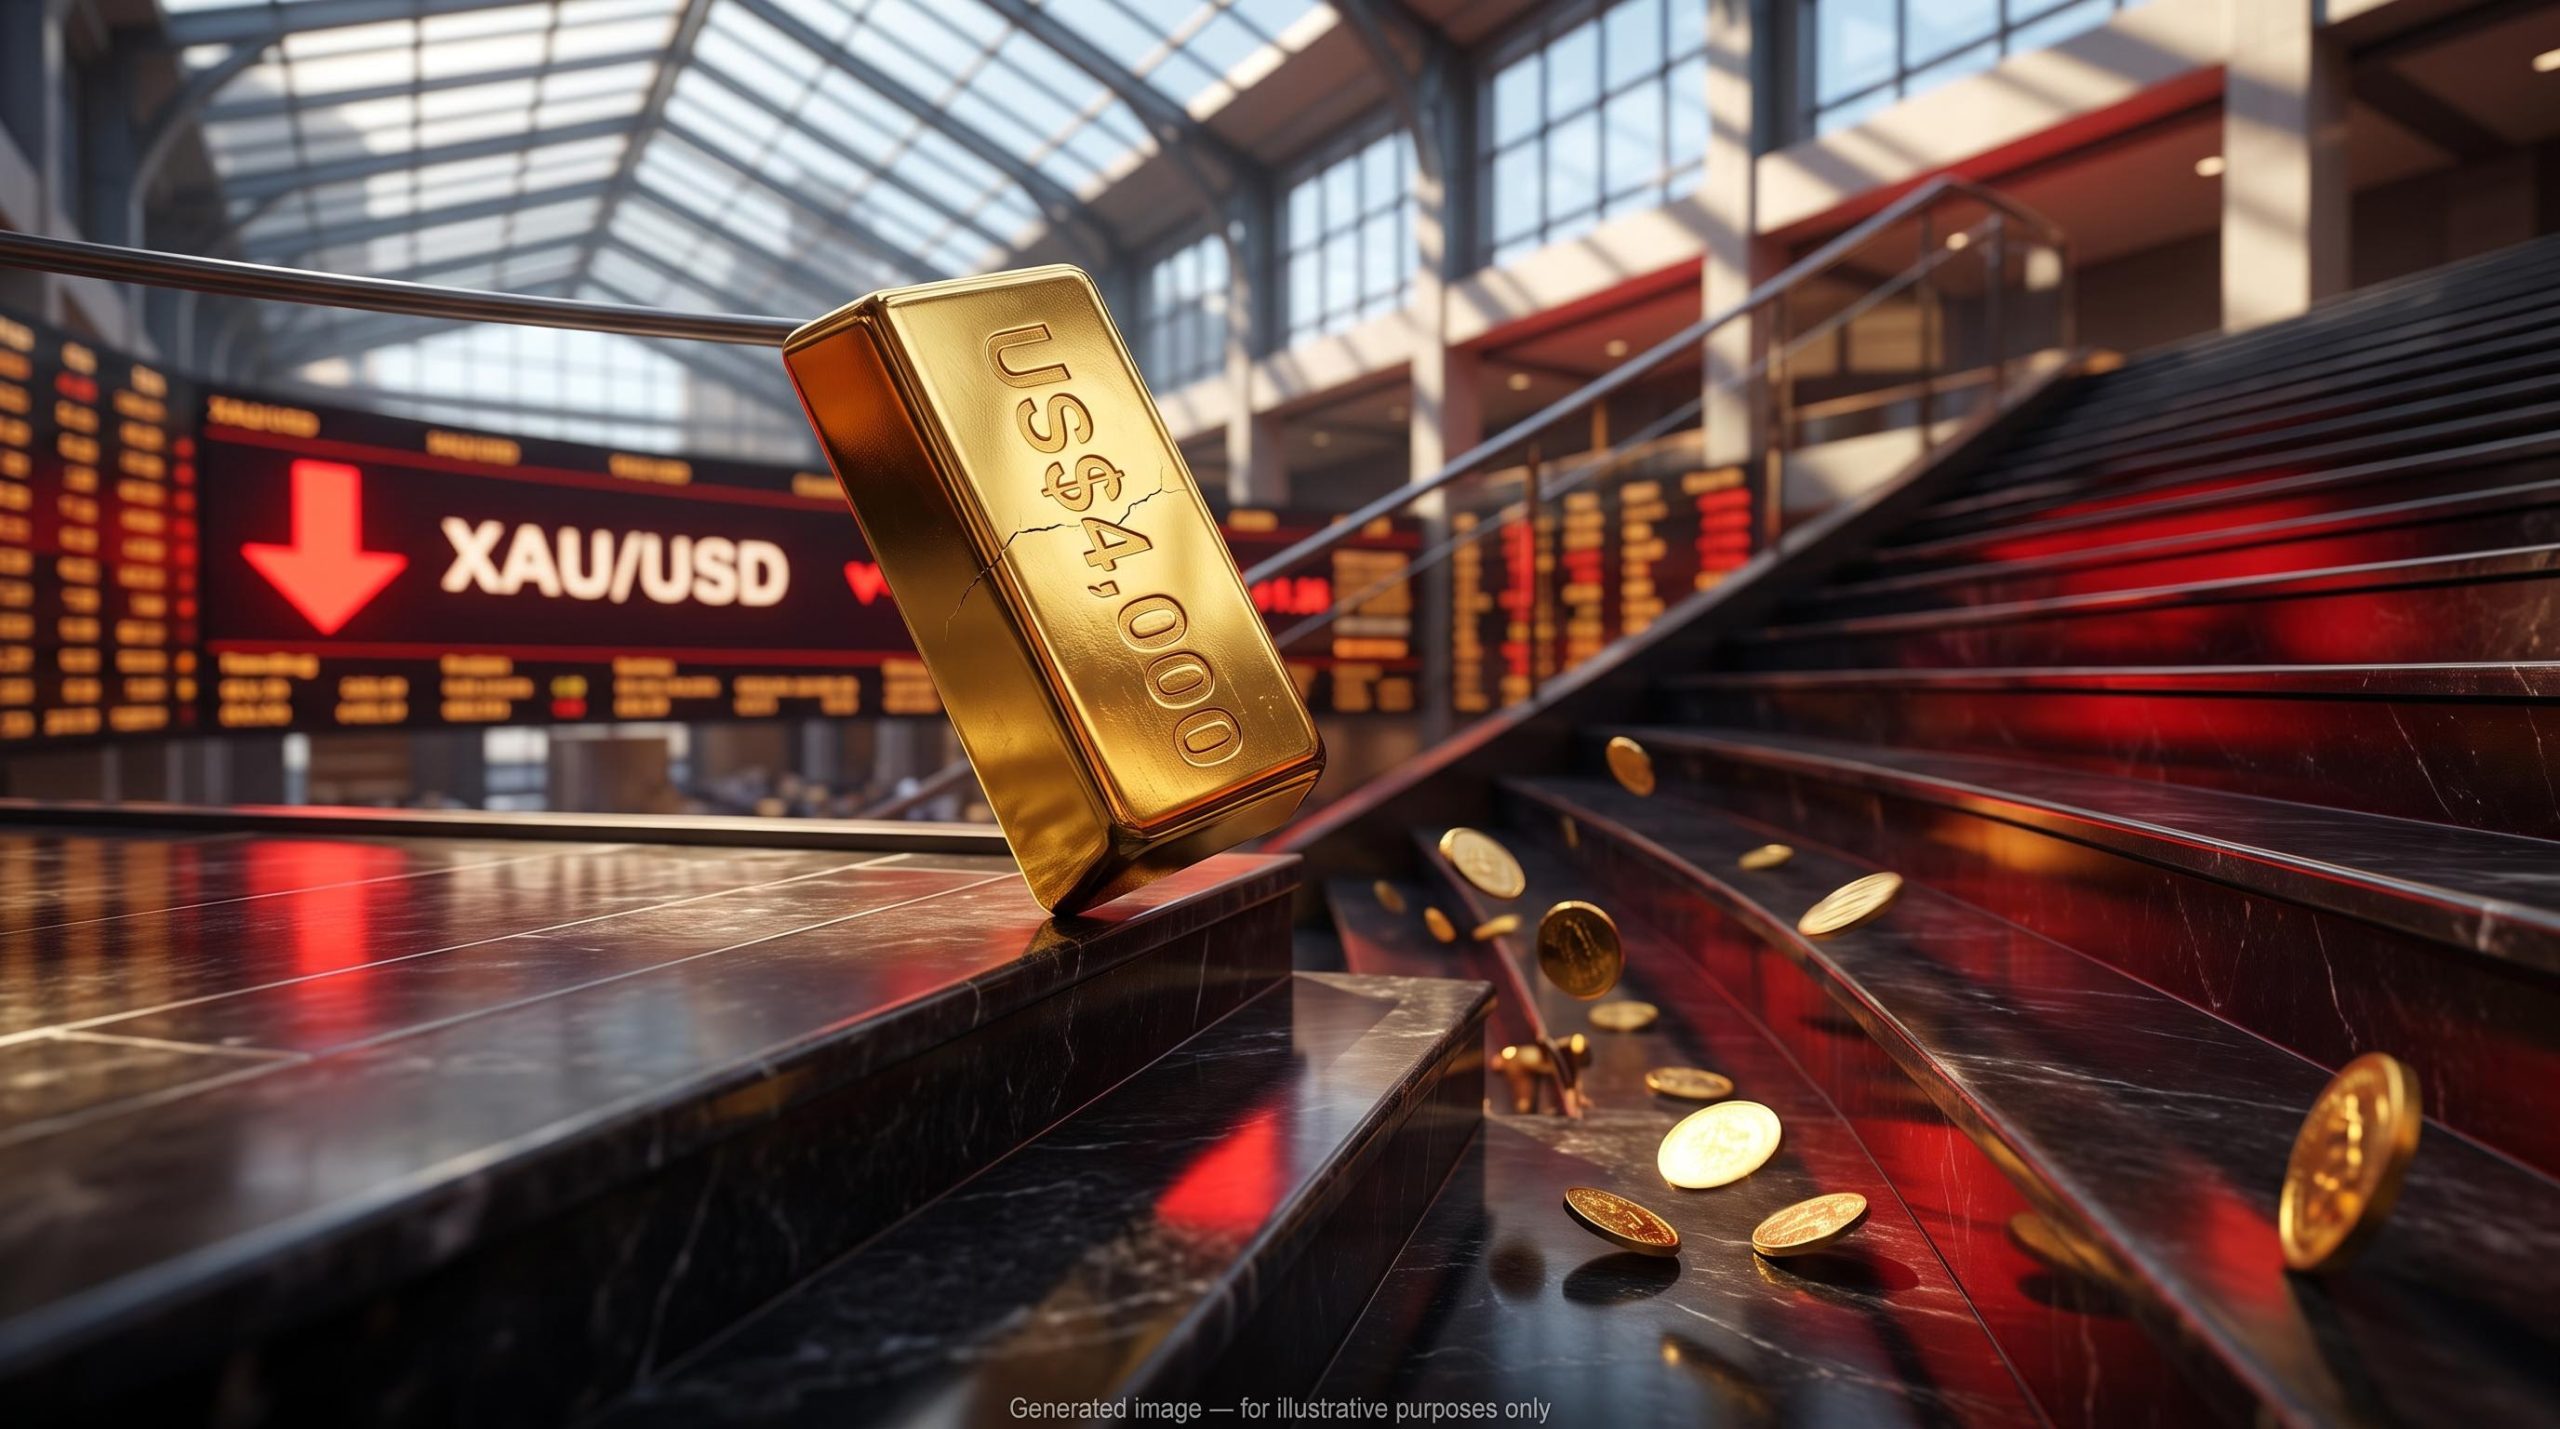
Spot gold has broken below US$4,000 an ounce, extending a two-day slide after hotter-than-expected US inflation data left markets fully pricing a December Federal Reserve rate hike. The drop has reset the near-term gold price forecast around one question: how high US rates are heading.
The US$4,000 mark matters because round numbers act as psychological anchors for traders, and this one had held as a floor through recent weakness. Gold bounced modestly on 11 November 2026, but the bounce did nothing to change the rate story driving the selloff.
Prices varied through Wednesday. FXStreet put XAU/USD near US$3,999, down about 0.70%, at its time of writing. Reuters later reported spot gold near US$4,047, up about 0.4%.
Here is why gold fell, which price levels now decide its direction, and the data dates over the next week that could shift the outlook.
Where gold stands now: the break below $4,000 and the levels that matter
The two-day move
The damage came on Tuesday. Spot gold fell about 2.6%-2.8% on 10 November, sliding to roughly US$4,021.36, according to CNBC.
Wednesday brought a partial recovery that ran out of steam. Reuters said the rebound stayed limited because higher expected US rates kept the dollar firm. StoneX senior market analyst Matt Simpson called it a technical retracement after heavy losses, meaning a short bounce following an oversold drop rather than a change in trend.
Support and resistance
Analysis from FXStreet and TMGM shows three straight days of lower lows. The Relative Strength Index (RSI), a momentum gauge that measures the speed of recent price moves, is turning bearish. The break below US$4,000 came with that bearish momentum behind it.
Support is a price where buyers have stepped in before. Resistance is a price where sellers have taken control. The SMA, or simple moving average, is the average closing price over a set number of days.
| Level | Type | What it represents |
|---|---|---|
| US$4,200 | Resistance | 100-day SMA |
| US$4,177 | Resistance | 50-day SMA |
| US$4,100 | Resistance | Second recovery target |
| US$4,050 | Resistance | First recovery target |
| US$4,000 | Resistance | Broken round-number floor |
| US$3,919 | Support | 4 November daily low |
| US$3,879 | Support | 30 October year-to-date low |
If you are tracking gold, US$4,000 has changed roles. It is now resistance rather than support, and a recovery has to clear it before US$4,050 and US$4,100 come into play and the bearish technical read weakens.
Why gold fell: hot CPI, a December hike and a stronger dollar
The chart shows the damage. The cause sits in one inflation report. Headline Consumer Price Index (CPI) inflation rose 0.4% month over month in October, above the roughly 0.3% forecast. Core CPI, which strips out food and energy, rose 0.3% against an expected 0.2%, according to Reuters, Trading Economics and market coverage.
That core reading carried extra weight. Fed Governor Christopher Waller had said a 0.3% core print would justify a 50 basis point hike. A basis point is one hundredth of a percentage point.
The chain ran like this:
- The CPI surprise. Inflation came in hotter than forecast on both measures.
- Hike pricing. CME FedWatch moved to a 100% probability of a December increase, up from 84%. That figure covers any hike; separately, FedWatch puts 87% odds on a 25 basis point move and 13% on 50 basis points.
- Yields and the dollar. The 10-year Treasury yield rose nearly 12 basis points to about 5.00%, and the US Dollar Index climbed about 0.67% to 102.90, its highest level of the year.
- Gold. Bullion slid as both pressures hit at once.
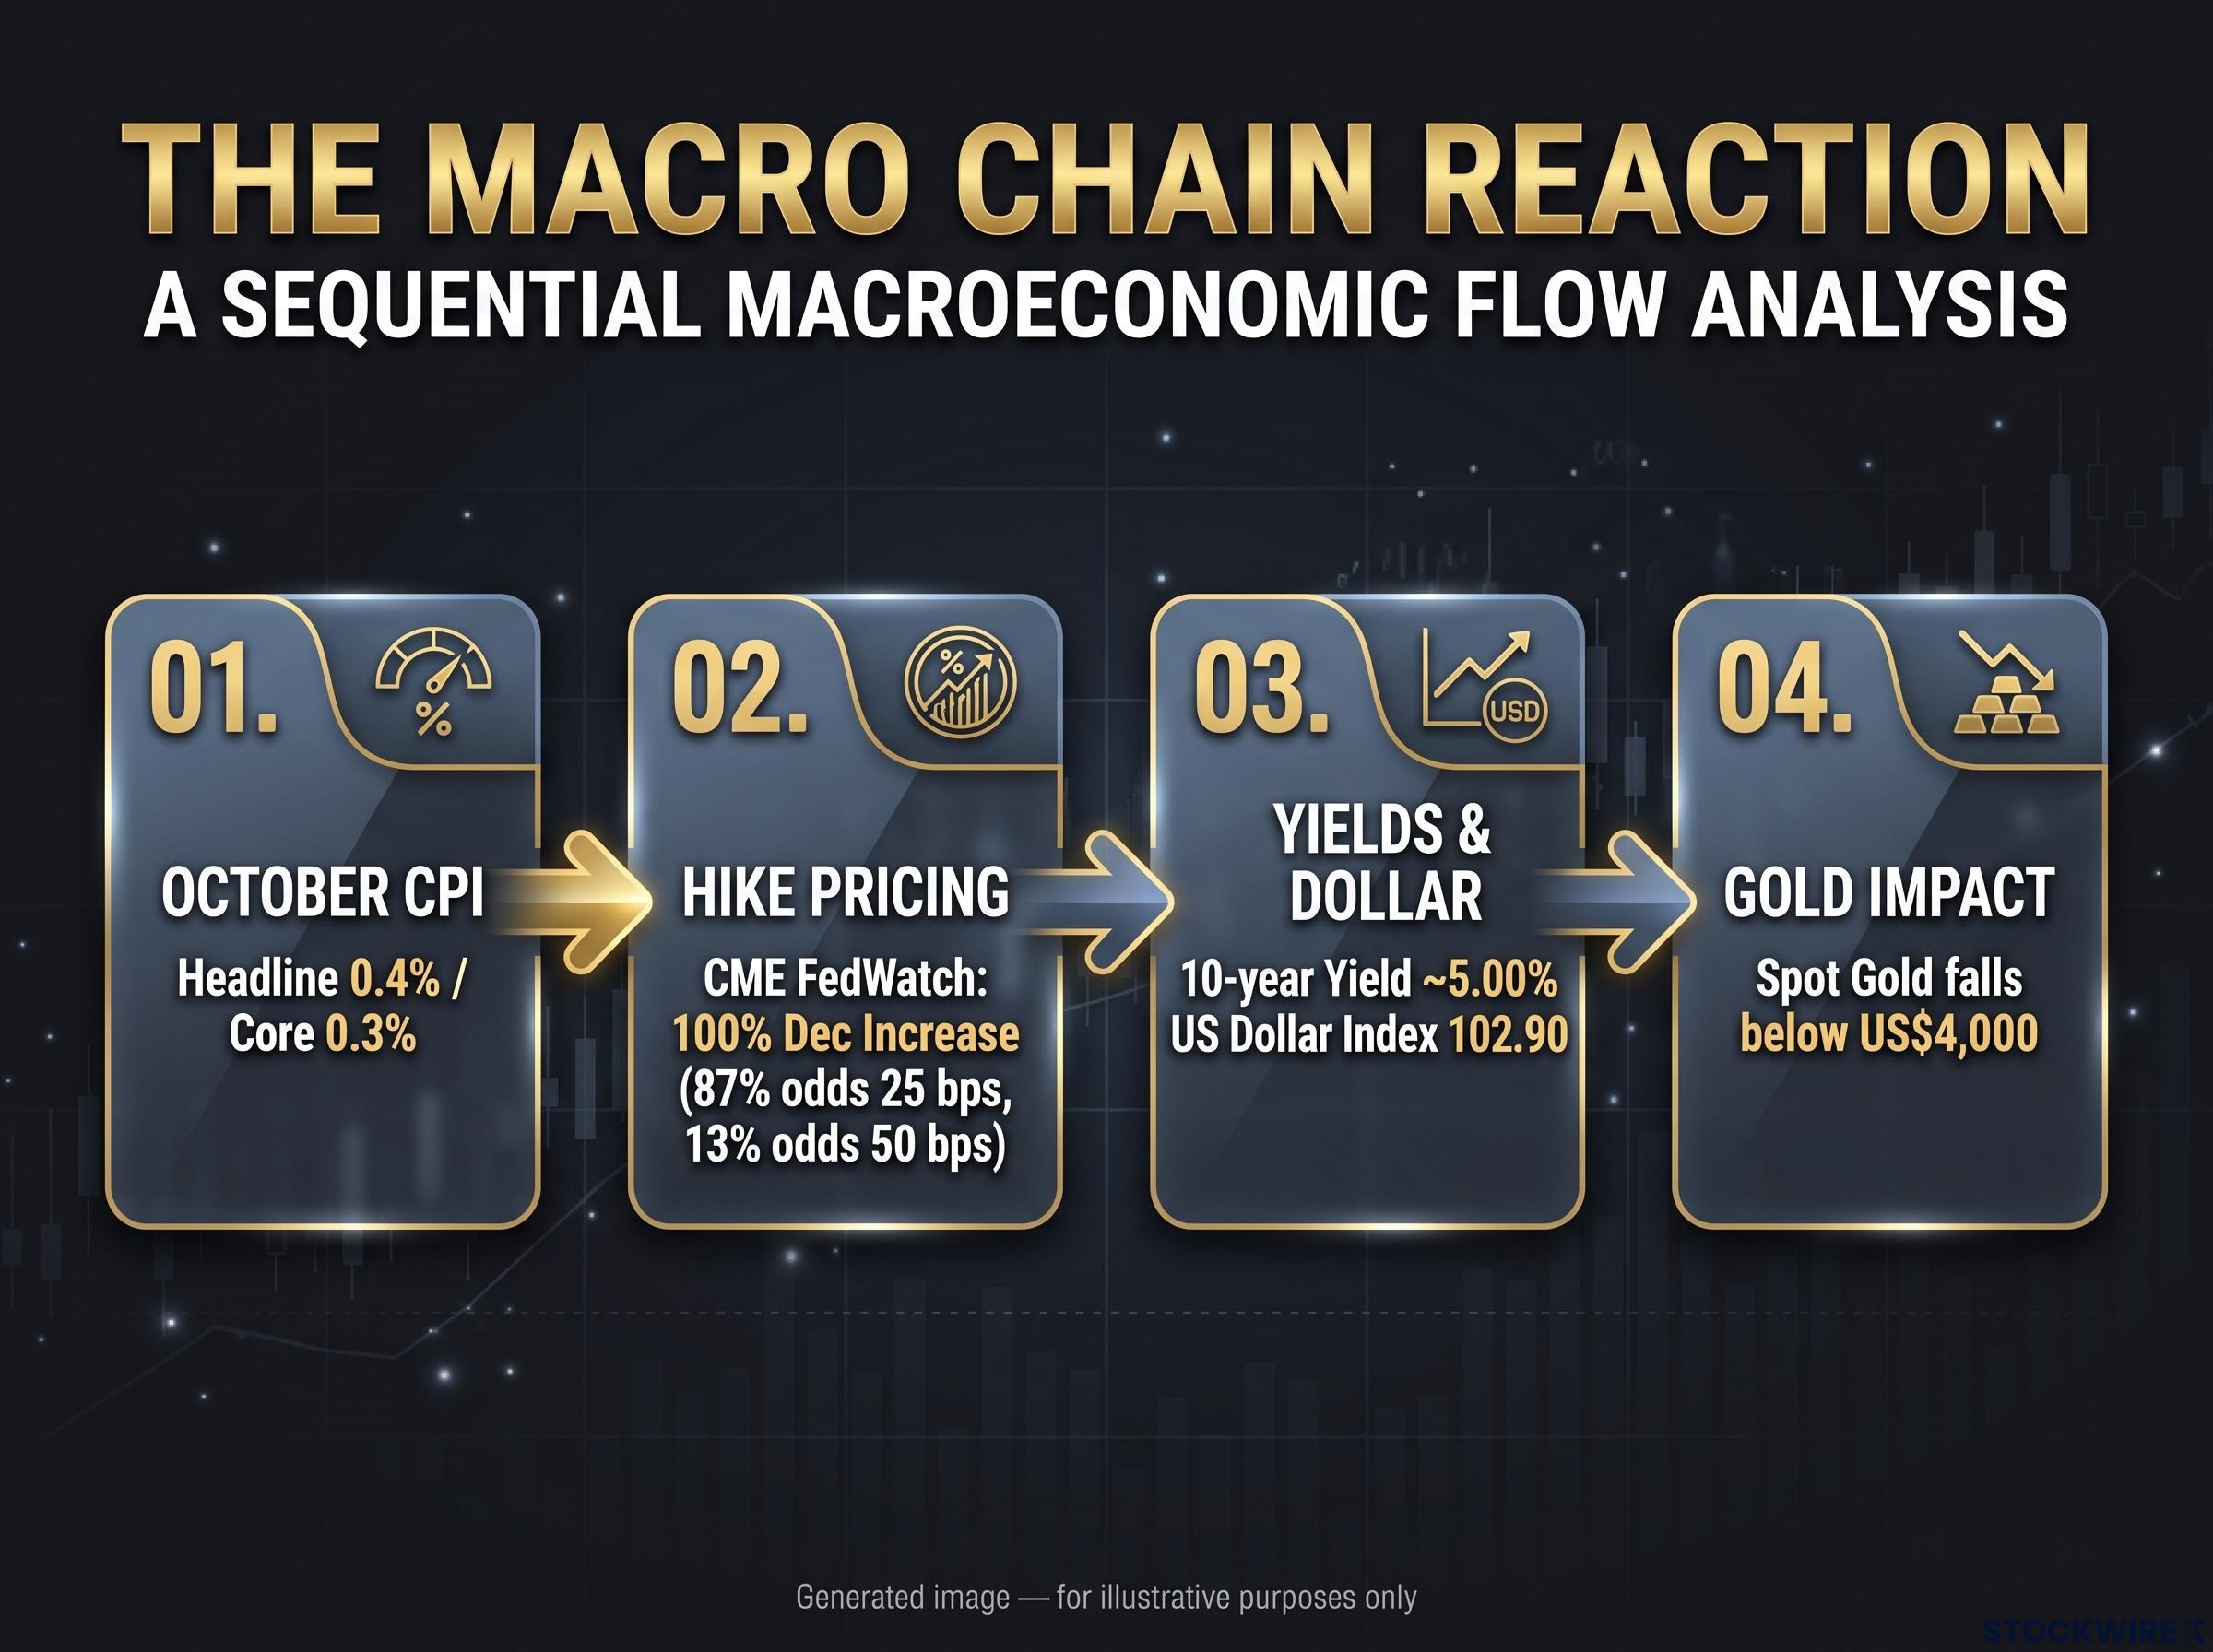
October CPI data drove 100% Dec Increase odds, pushing the 10-year Yield to ~5.00% and the US Dollar Index to 102.90, sending Spot Gold below US$4,000.
Fed officials reinforced the move. Philadelphia Fed President Anna Paulson said the Fed would act more aggressively if the inflation outlook worsens, and Dallas Fed President Lorie Logan said faster hikes are possible. Governor Michelle Bowman said more work remains, while Kansas City Fed President Jeffrey Schmid flagged worrying price trends outside energy.
The mechanics are simple. Gold pays no interest, so higher yields raise its opportunity cost, the return you give up by holding it instead of bonds. A stronger dollar also makes bullion costlier for buyers paying in other currencies.
Real yields and dollar strength have overridden geopolitical and inflation catalysts before in 2026, and crowded positioning after the 2025 rally tends to amplify such moves once key moving averages break.
StoneX strategist Bob Haberkorn told Reuters the market read the CPI result as warranting higher rates in December. Bybit chief market analyst Han Tan was blunter about the bounce.
Han Tan, Bybit chief market analyst: Further Fed hikes make it difficult for gold bulls to sustain a recovery, even after post-CPI relief following a sharp decline.
The distinction matters for you. Gold fell because a non-yielding asset loses ground when rates rise, not because anything changed in its long-term appeal.
What could move the outlook: the data, the floor under gold and the risks
Data and speakers to watch
The next week tests whether the hot inflation reading holds. Jobless claims and producer prices come first.
| Date | Event | Why it matters for gold |
|---|---|---|
| 12 November | Jobless claims (estimate about 195,000, prior about 191,000) | Labour market strength supports hike bets |
| 12 November | Fed speeches: Hammack, Daly, Williams | Tone could firm or soften rate expectations |
| 13 November | Producer Price Index (PPI) | Wholesale inflation tests the CPI reading |
| 17 November | Retail sales | Consumer demand shapes the rate path |
What supports gold
Central banks buy gold to diversify reserves. They bought 675 tonnes in Q1-Q3 2026, 6% above the same period of 2025, including 321.2 tonnes in Q3, up 42% year over year, according to the World Gold Council on 3 November 2026. Haberkorn argued that buying helps form a floor under prices.
Reserve managers treat central bank gold buying as a response to counterparty risk and sanctions exposure rather than a bet on near-term price direction, which is why purchases have continued through earlier tightening cycles.
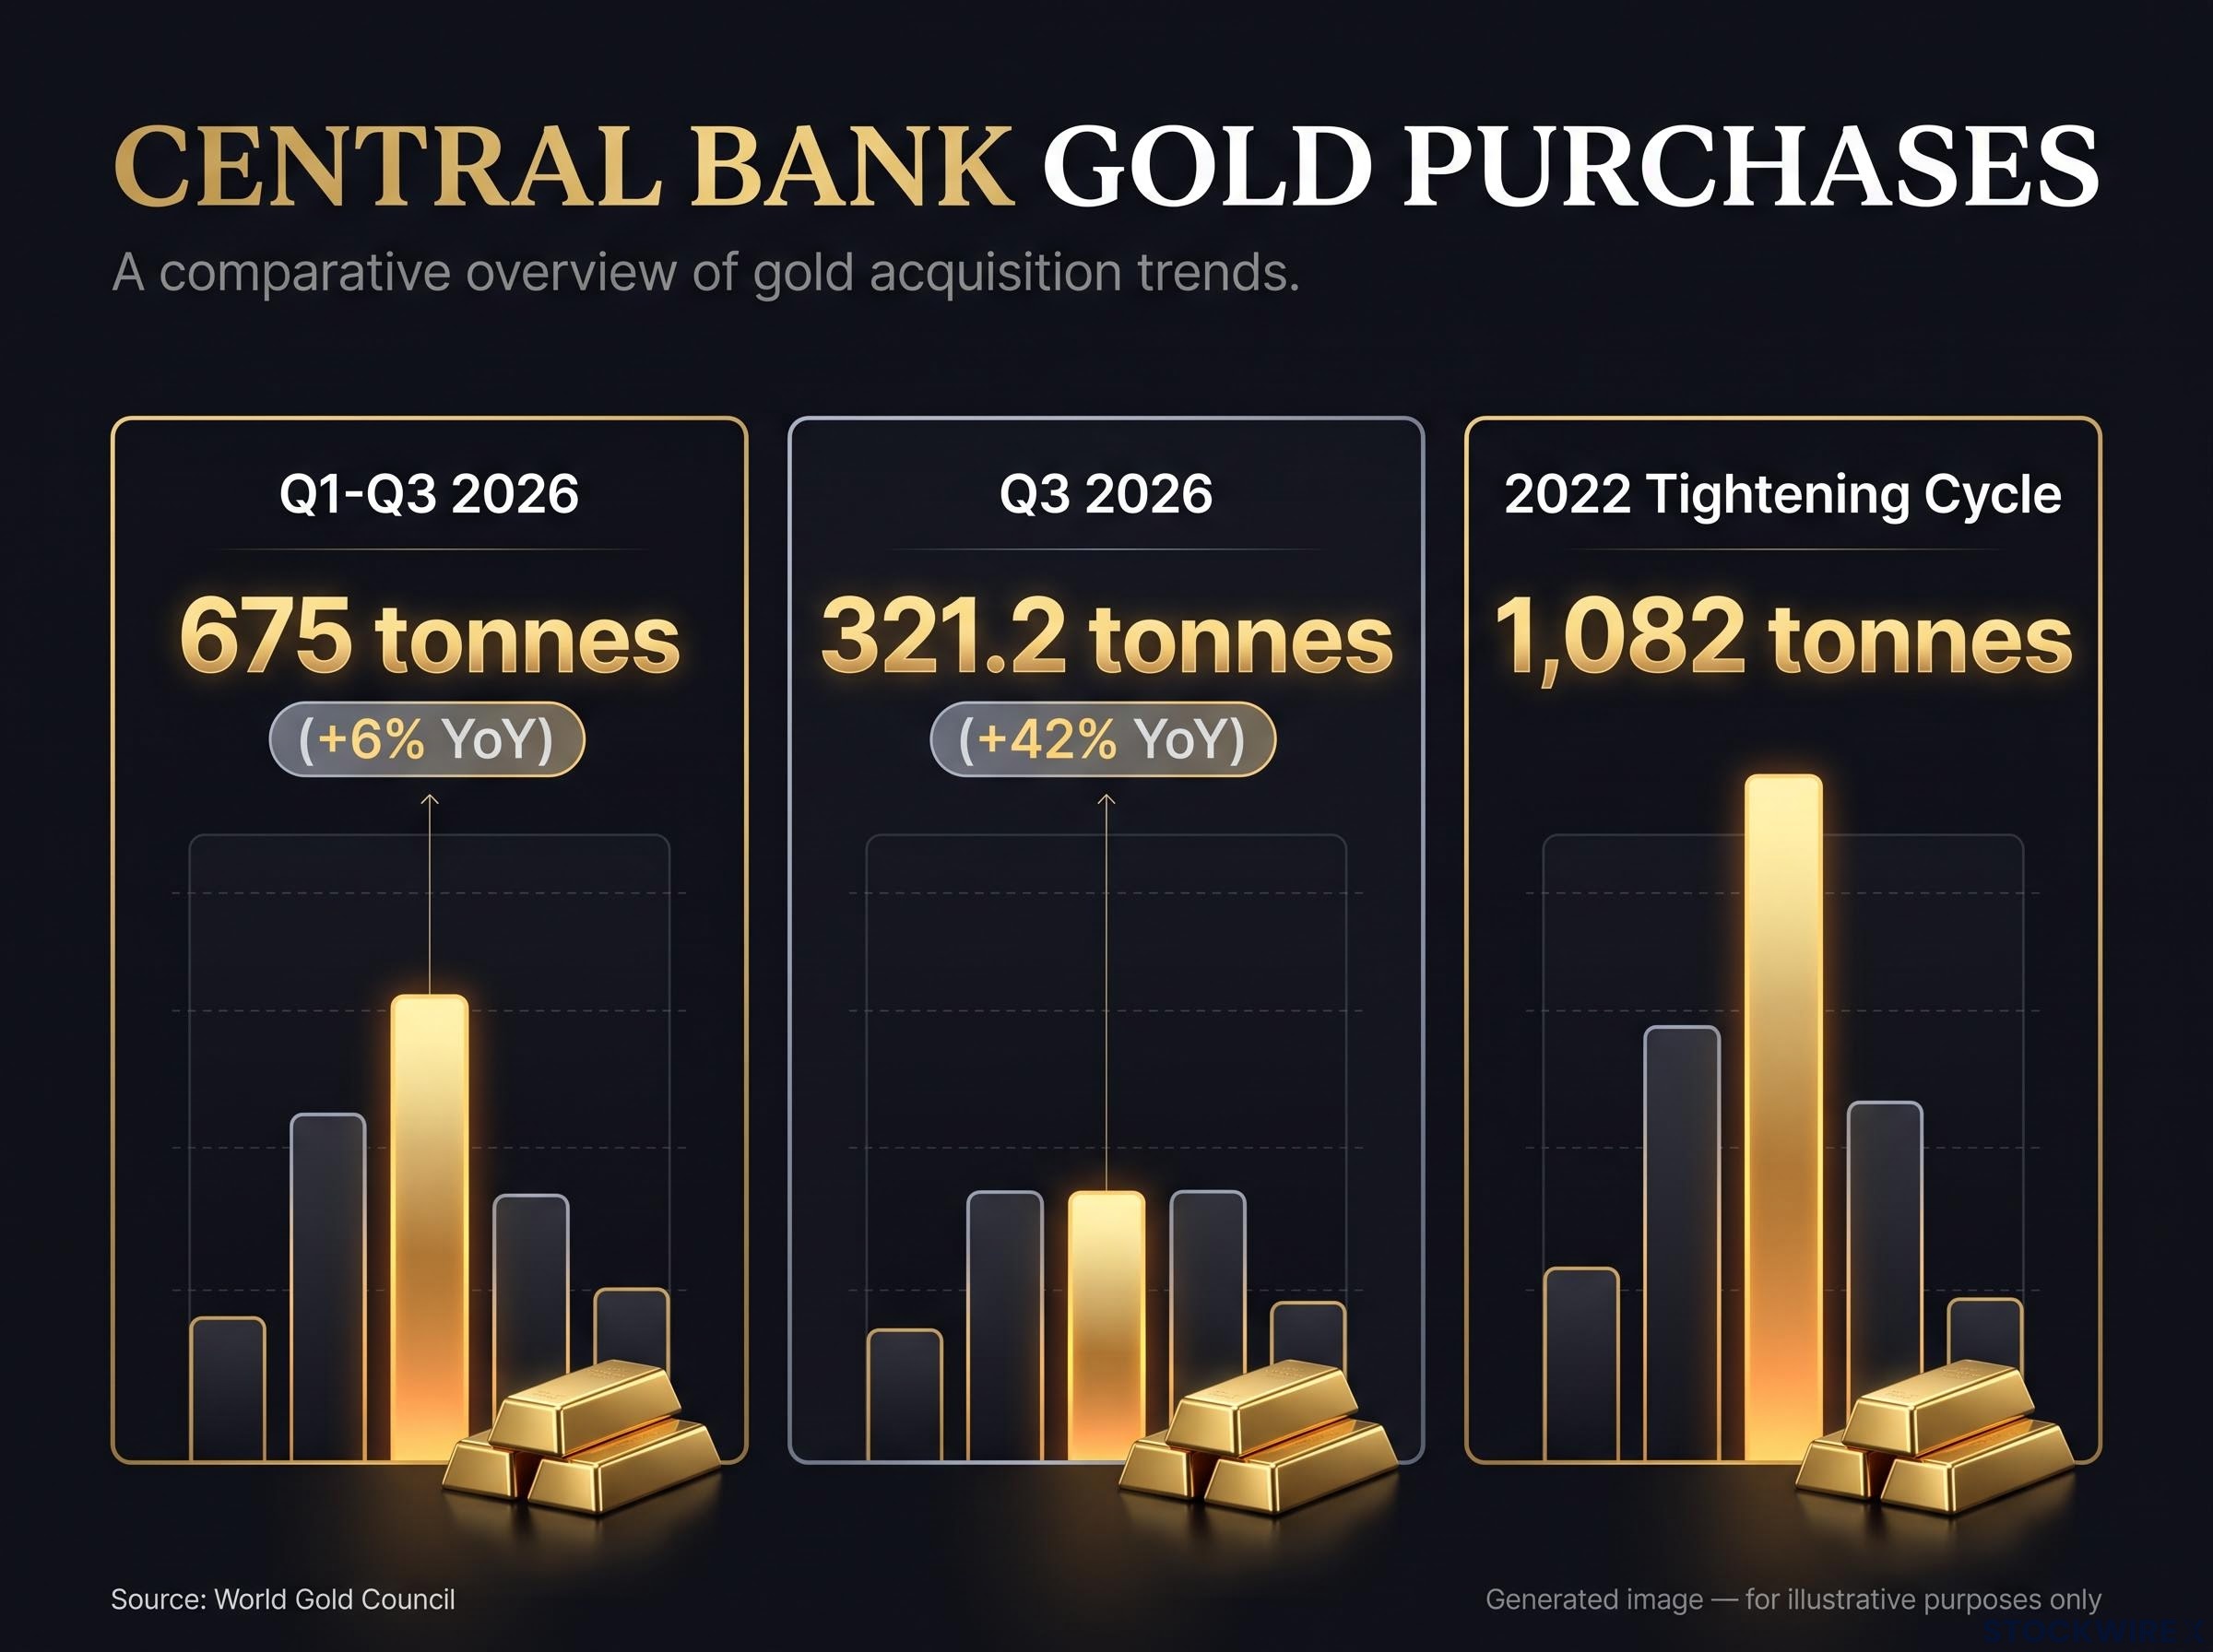
Central bank gold demand shows Q1-Q3 2026 at 675 tonnes, comparing to the massive 1,082 tonnes seen during the 2022 Tightening Cycle.
The WGC still expects full-year 2026 buying to finish below 2025. Precedent offers some perspective: in the 2022 tightening cycle, when the WGC’s latest figure shows 1,082 tonnes of central-bank buying, gold came under pressure before stabilising as rate expectations peaked, though the research offers no precise price comparison.
Risks in both directions
- Downside: more hawkish Fed talk could push gold towards US$3,919 and US$3,879, and stop-loss selling or leveraged liquidation could exaggerate the move.
- Upside: a Fed pause or smaller hike, softer data, a geopolitical shock or short covering could lift prices.
On balance, the evidence points to a short-term, rate-driven correction. A structural shift would need persistently higher real yields, sustained dollar strength and weaker investment and central-bank demand, so treat any outlook as conditional on the coming week’s inflation and rate signals.
What the break below $4,000 settles, and what the next prints will decide
The trigger is clear. A hot October CPI print made a December hike fully priced, lifted yields and the dollar, and pushed gold through US$4,000. The technical test now sits between US$4,000 resistance and support at US$3,919 and US$3,879.
Central-bank buying and safe-haven demand argue against reading this as a long-term collapse. Rate expectations still control the near term, though.
The next decision points run from 12 to 17 November: jobless claims, Fed speakers, PPI and retail sales. Each will either confirm the hotter inflation story or start to unwind it.
Past performance does not guarantee future results. Financial projections are subject to market conditions and various risk factors.
This article is for informational purposes only and should not be considered financial advice. Investors should conduct their own research and consult with financial professionals before making investment decisions.