A US$664 billion order book sounds like it should end the argument over Oracle as an AI infrastructure stock. It does not. Backlog is contracted work waiting to be done. The question that matters is how much of it turns into cash, and how soon.
That question sat at the centre of Oracle‘s Investor Day in Las Vegas on 28 October 2026. Management set out a timeline for heavy spending to give way to self-funding growth.
The brokers who heard it came away divided. Phillip Securities kept its BUY rating and US$225 target. Morgan Stanley held at equal-weight with a US$210 target, while Bank of America stayed constructive at US$240.
This piece gives you a framework for judging whether heavy AI spending earns its keep, then applies it to Oracle. You will see which assumptions carry the bull case and which numbers to check each quarter.
Why does Oracle’s path to free cash flow hinge on financing, not just backlog?
Start with the size of the bill. Oracle guided to US$90-95 billion of gross capital expenditure (capex, the money spent on data centres and equipment) in FY27, a year that ends on 31 May 2027. That is unusually large relative to Oracle’s annual revenue.
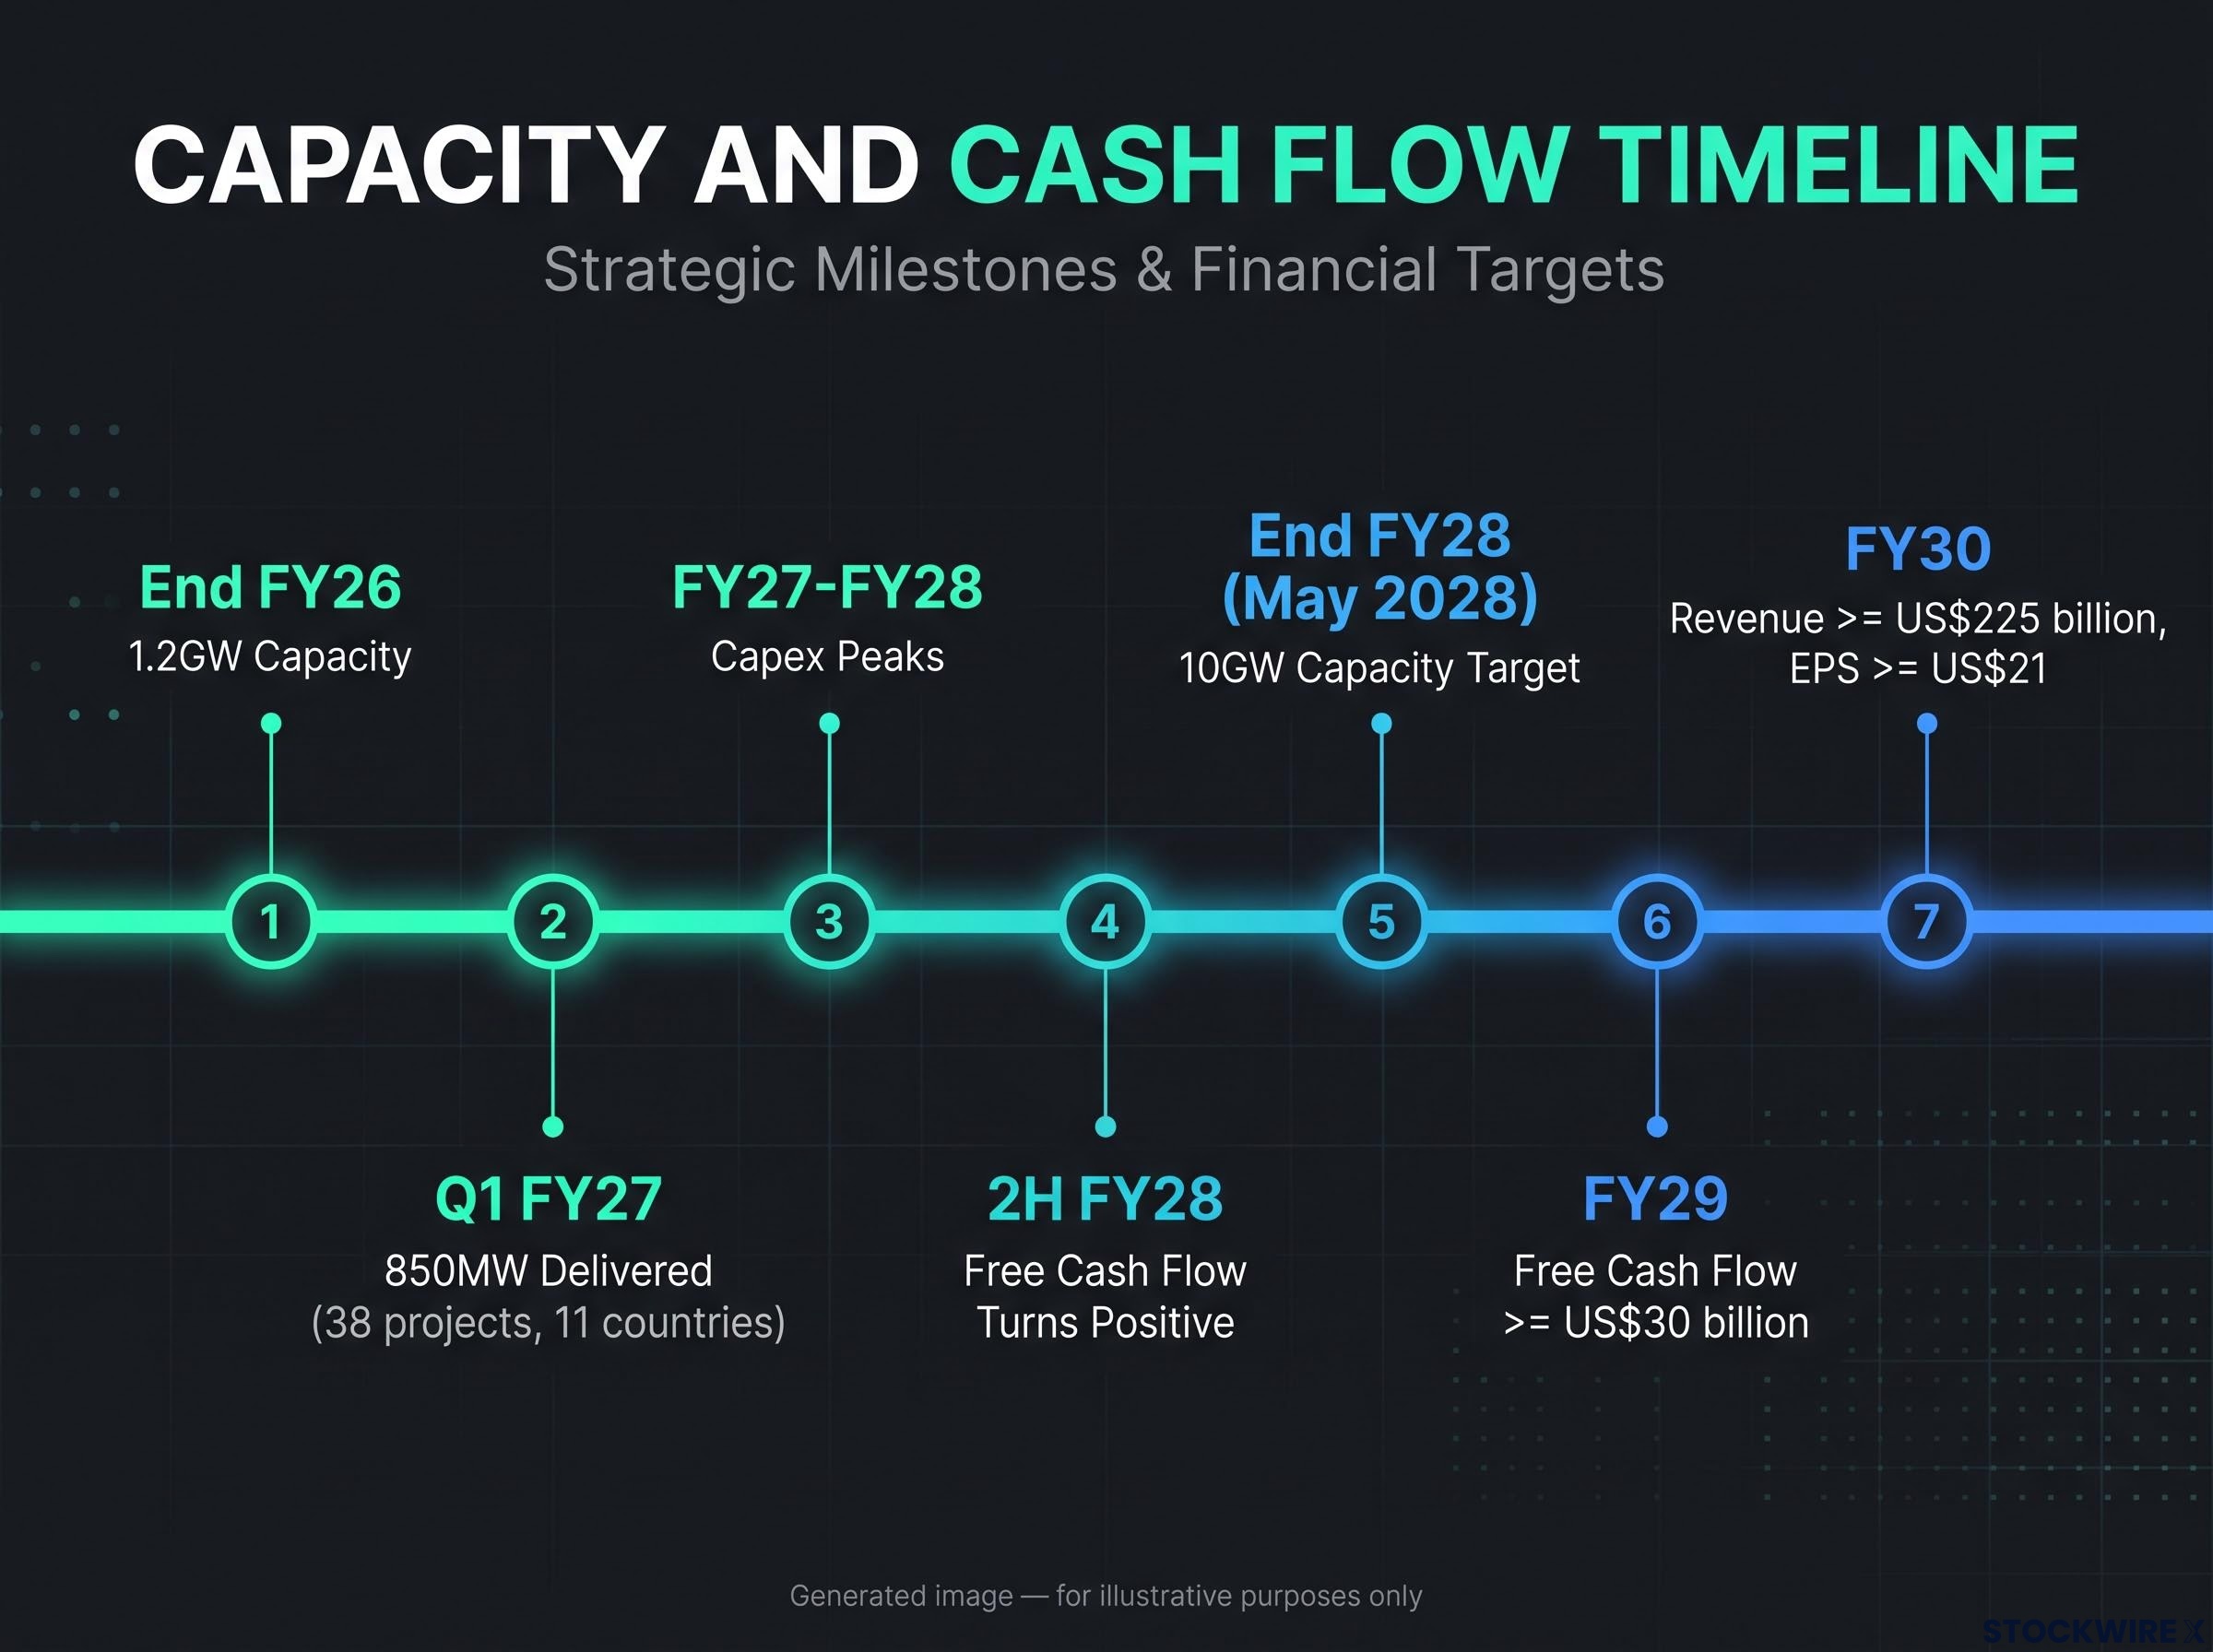
Management’s timeline is clear. Capex is expected to peak across FY27-FY28, free cash flow (the cash left after operating costs and capex) is expected to turn positive in the second half of FY28, and capex is expected to fall in FY29.
The financing plan is what makes that timeline plausible. Oracle’s CFO has guided net cash capex to no more than US$70 billion in FY27, well below the gross figure, because three mechanisms shift part of the cost elsewhere.
| Mechanism | How it works | Benefit | Trade-off |
|---|---|---|---|
| Vendor financing | Suppliers fund or defer payment for equipment | Lower near-term cash capex | The obligation stays and adds to net debt |
| Customer prepayments | Customers pay upfront for future capacity | Cash arrives before delivery | Creates a delivery obligation before revenue is booked |
| Bring-your-own-hardware (BYOH) | Customers supply GPUs; Oracle provides the facility, network and cloud layer | Much less upfront capital for Oracle | Less revenue per GW, though higher margins |
Phillip estimates these levers together could cut upfront cash needs by about 50%. On its numbers, vendor financing lowers the first-two-year capital need for a 1GW project from US$37 billion to US$18 billion, and BYOH could take it to US$6 billion or less per GW. Additional capital raises through FY30 are capped at US$20 billion.
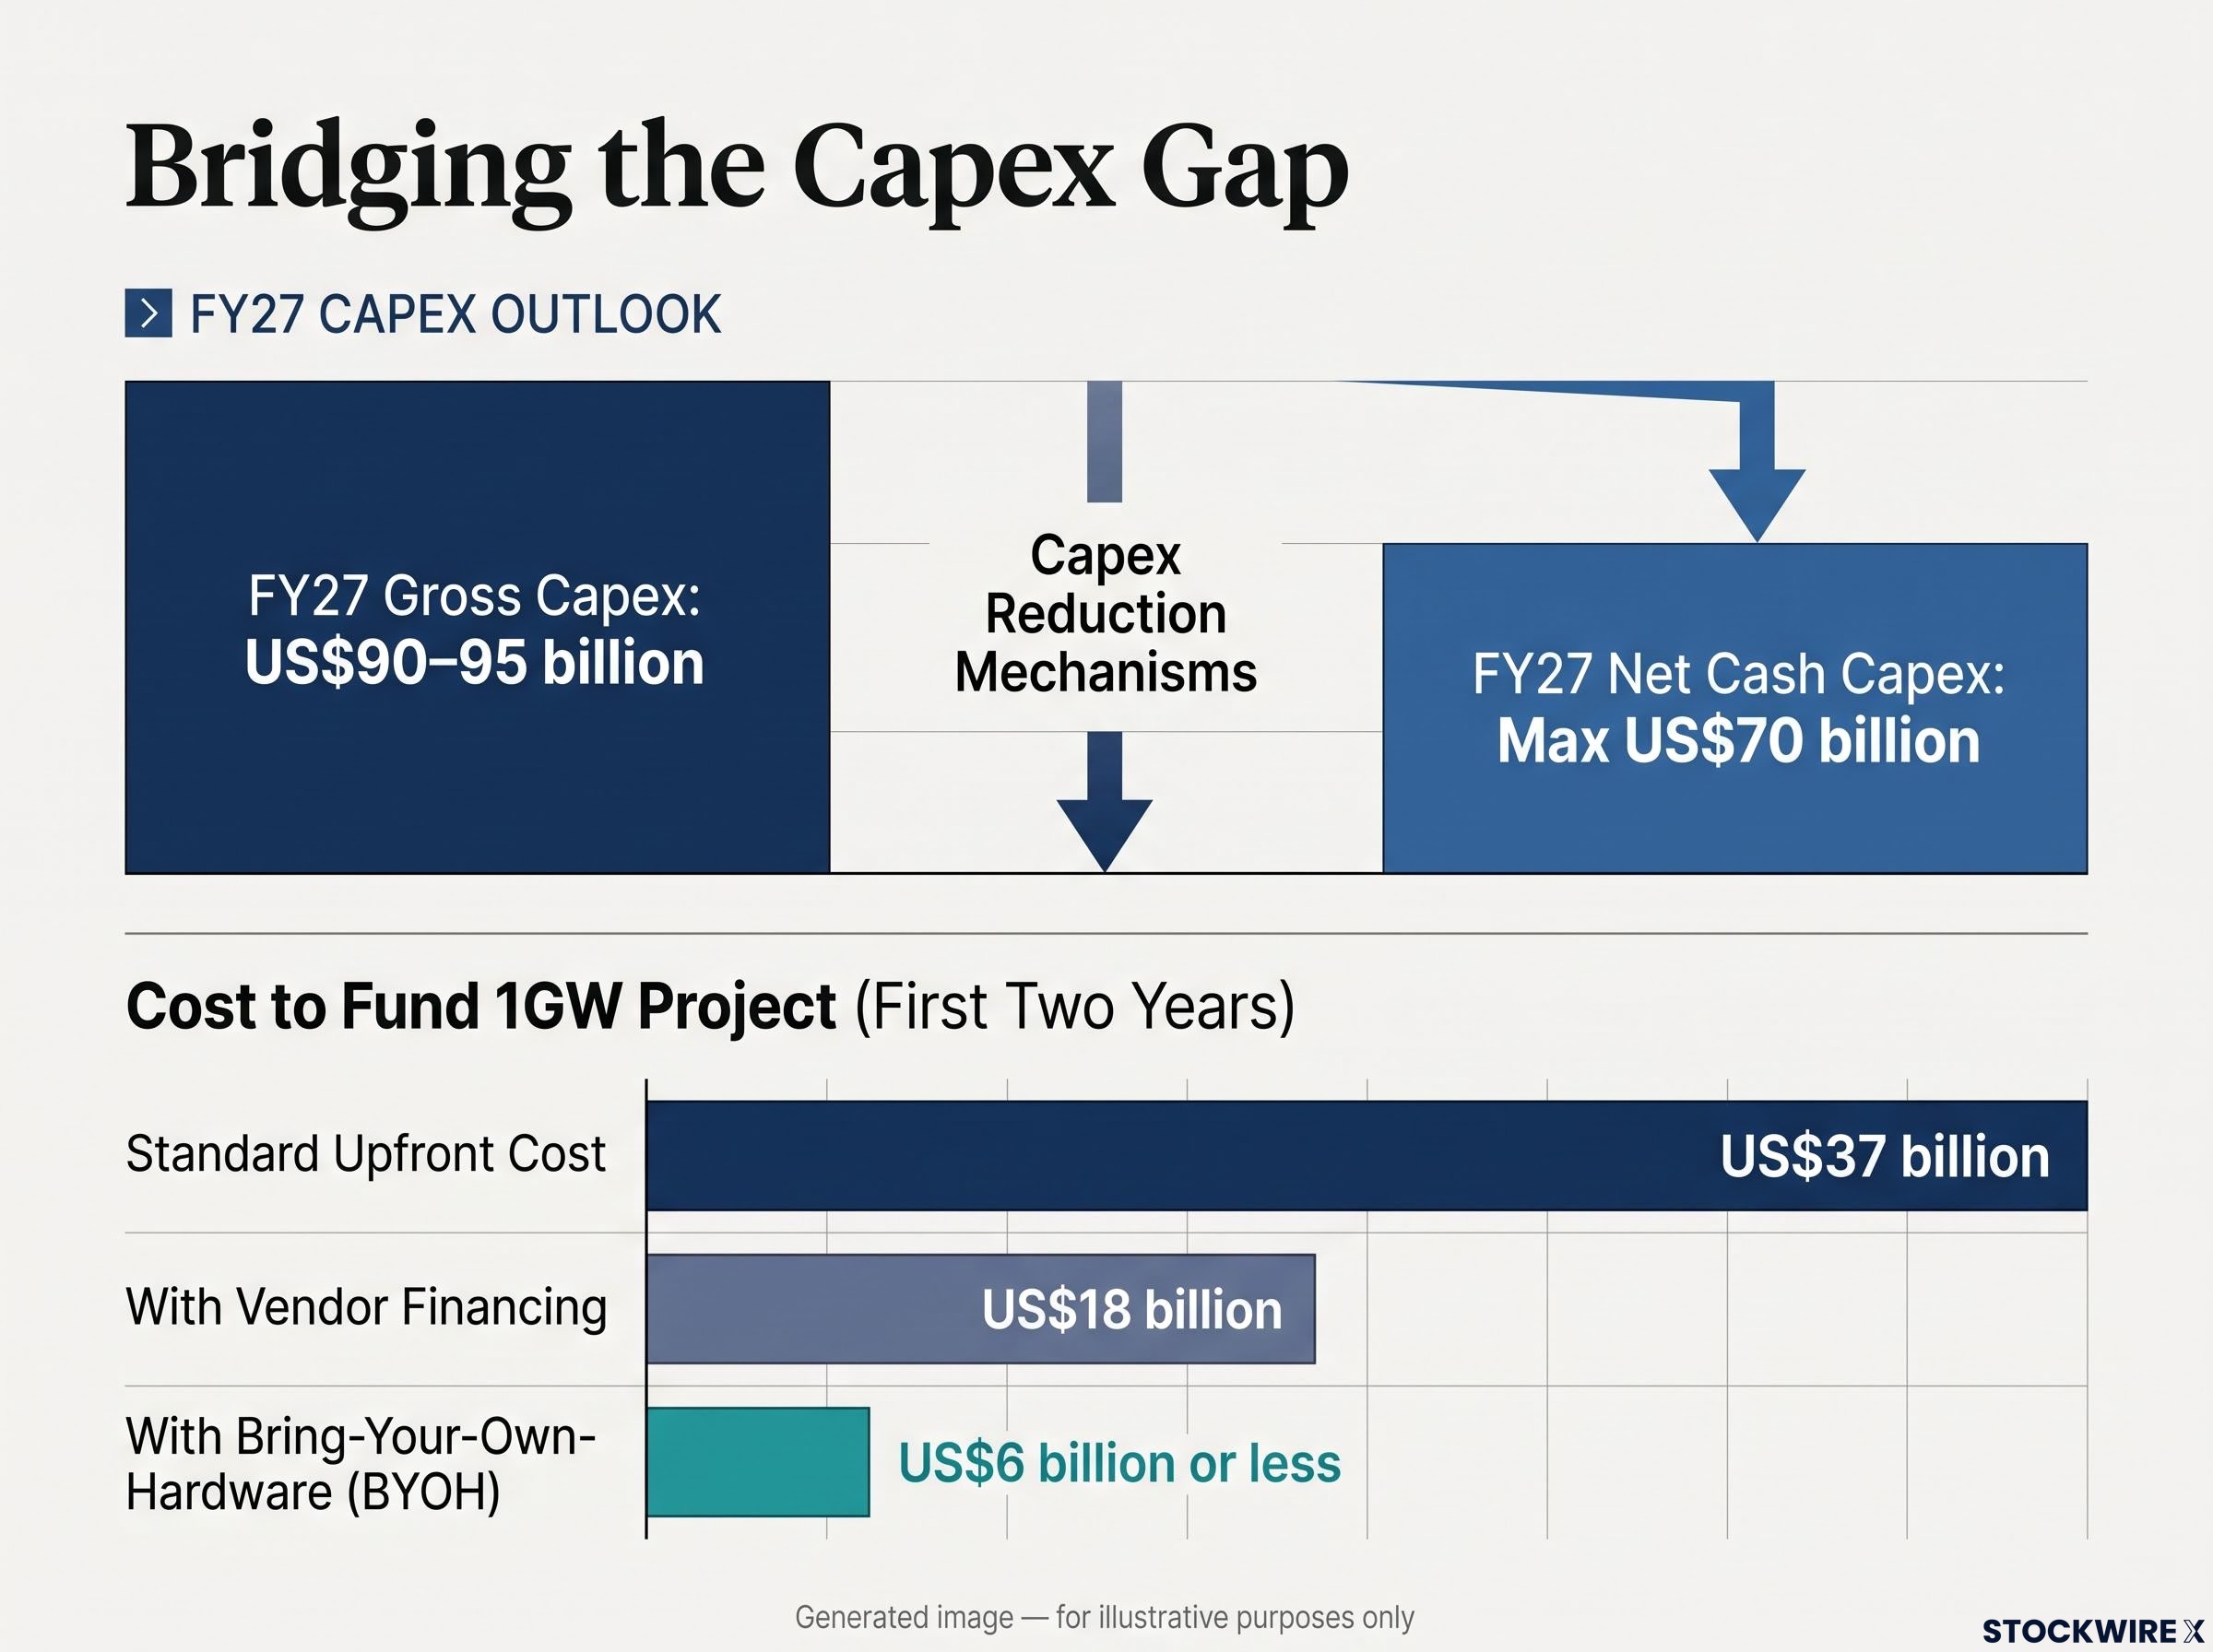
Oracle plans to cut FY27 gross capex of US$90-95 billion to max US$70 billion net, and lower 1GW upfront costs from US$37 billion to US$6 billion or less.
Watch the gap, though. Vendor financing behaves like debt, as Morgan Stanley pointed out, so cheaper-looking capex is not cheaper capital. You should judge the plan by net obligations, not headline capex.
Vendor financing is one entry in a wider category of off-balance sheet obligations, including non-cancellable purchase commitments and uncommenced leases, that sit in filing footnotes and migrate onto reported balance sheets as data centres open.
Not everyone accepts the arithmetic. Commentary citing S&P concerns pointed to an estimated FY27 funding shortfall of about US$42 billion, more than double the US$20 billion Oracle plans to raise.
Where management and Phillip differ on FY29
Oracle guides to FY29 free cash flow of at least US$30 billion. Bank of America’s model lands close by: about -US$30.4 billion in FY27, -US$14.4 billion in FY28, then +US$30.2 billion in FY29.
Phillip forecasts just US$4 billion for FY29, though it still expects Oracle to fund itself from that year and left its rating unchanged. The spread tells you how much rests on execution: same plan, very different assumptions about how fast cash arrives.
Past performance does not guarantee future results. Financial projections are subject to market conditions and various risk factors.
When big ASX news breaks, our subscribers know first
How can 10GW and revenue per GW lift growth while margins dip?
If financing decides when cash arrives, capacity decides how much. Oracle targets 10GW of data-centre capacity by the end of FY28 (May 2028).
The starting point is 1.2GW at the end of FY26, with 850MW delivered in Q1 FY27 across 38 projects in 11 countries. Depending on the base assumed, the remaining build is about 6GW or more than 7GW; Phillip uses a base close to 3GW.
The growth case rests on productivity, not just volume. Oracle’s revenue per GW trails Microsoft‘s, yet Oracle carries a backlog of similar size on a much smaller cloud revenue base. That gives it room to catch up if capacity is delivered and billed.
Benchmarks for revenue per gigawatt vary widely depending on whether a figure describes current infrastructure or a forward-looking efficiency target, which is why Oracle’s catch-up claim needs to be tested against billed capacity.
Phillip forecasts revenue per GW rising 55% to US$17.5 billion in FY30, supporting its forecast of US$255 billion revenue and US$26.10 adjusted EPS in FY31. Oracle’s own FY30 targets are:
- Revenue of at least US$225 billion
- Revenue growth of more than 35% a year (compound annual growth rate, or CAGR) from FY26
- Non-GAAP operating margin of more than 40%
- Non-GAAP EPS of at least US$21
Margins take a detour on the way. Phillip expects adjusted operating margin to fall from 43% in FY26 to 37% in FY28, then recover to about 40% by FY30. AI infrastructure runs at a 35% gross margin and 34% operating margin, below Oracle’s software and database businesses, so a heavier infrastructure mix pulls the average down while new projects ramp.
| Test | Oracle evidence | Open point | What to watch |
|---|---|---|---|
| Contracted demand | US$664B RPO | Concentration in one customer | Customer mix disclosures |
| Utilisation | 97.9% | Holding it as capacity grows | Quarterly utilisation |
| Revenue per GW | IaaS up 121% | BYOH dilutes it | Revenue against GW delivered |
| Free cash flow | Guided positive in 2H FY28 | Financing assumptions | Net debt and FY28 cash flow |