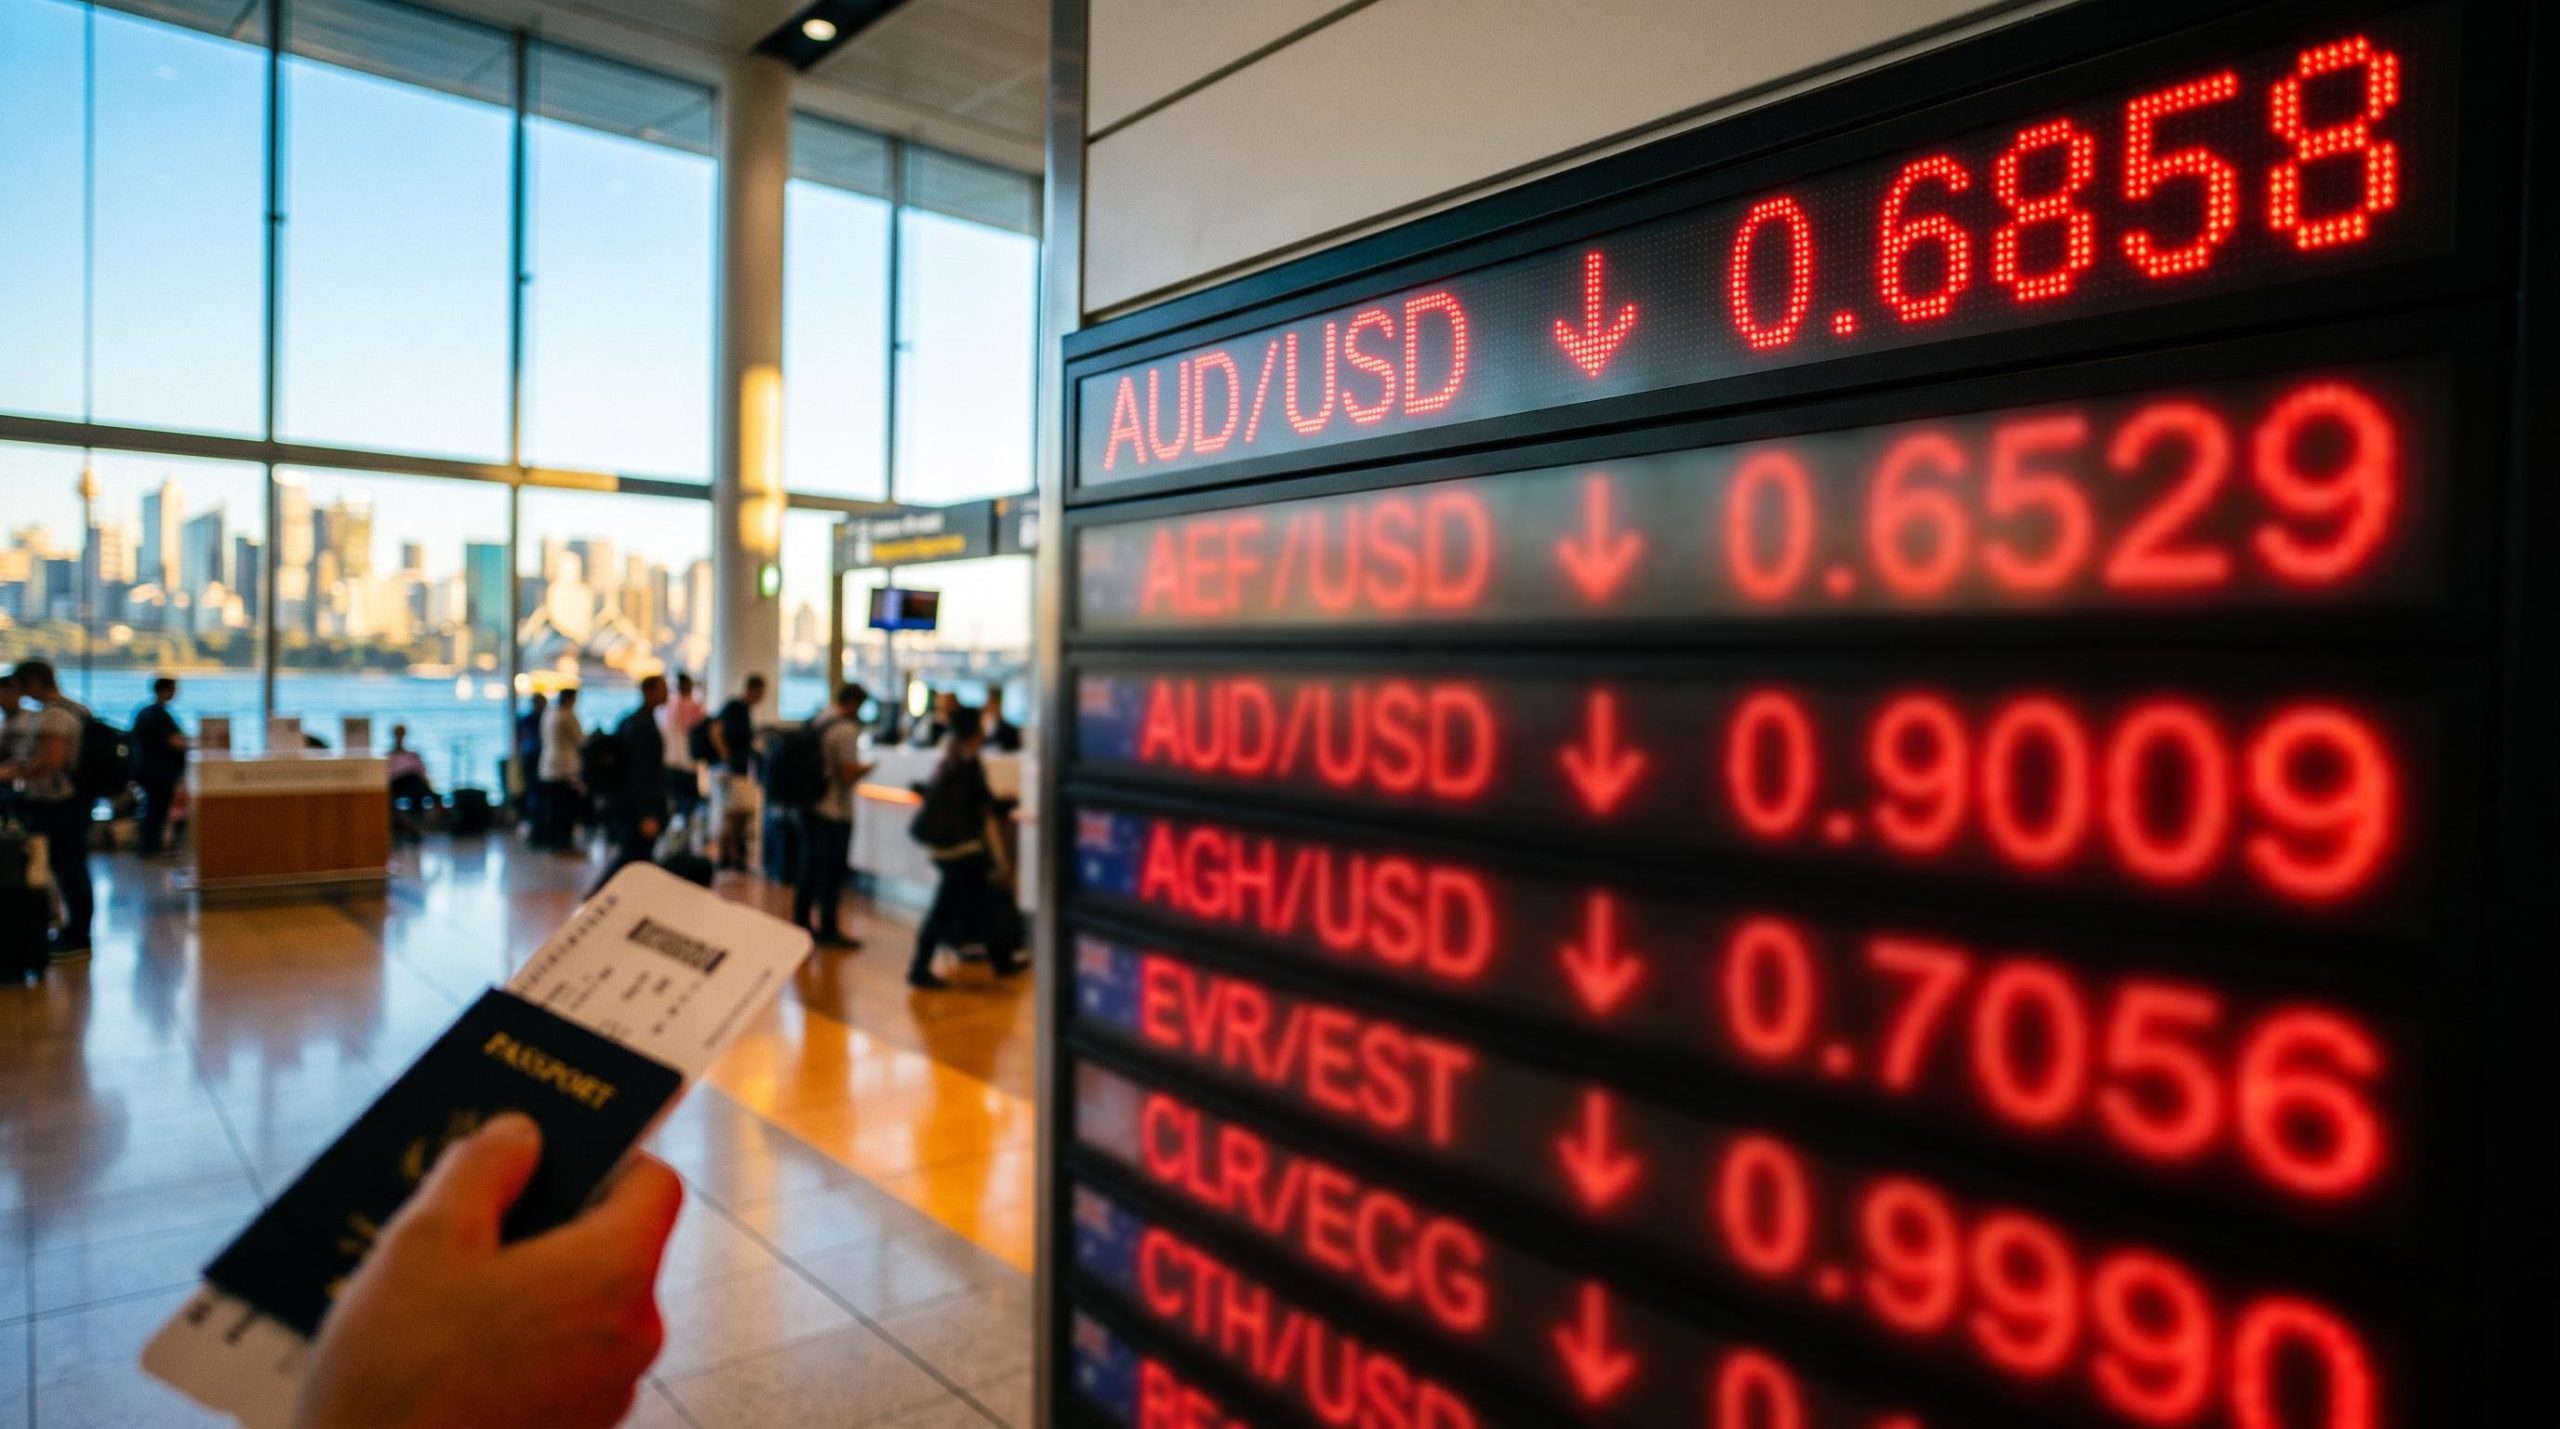
The Reserve Bank of Australia lifted interest rates to their highest level since 2008 on Tuesday. By Friday, the Australian dollar had still lost more than 2% for the week, trading near 0.6858, its weakest level since late March.
Two forces did the damage. A much stronger than expected US jobs report on 6 November 2026 pushed the US dollar higher, and the RBA’s guidance stopped signalling further hikes. The hike itself had already been priced in.
The fall shows that the cash rate alone no longer sets the AUD USD forecast. The market is watching what each central bank is likely to do next.
Here is what the week reveals about where the Aussie could head from here and which levels matter. It also covers who in Australia feels a weaker dollar first, from importers and travellers to exporters and investors.
How far did the Aussie fall, and against which currencies?
The losses were broad. AUD/USD fell about 2.46% for the week to sit near 0.6858, below US$0.70 and at its lowest level since late March.
The headline number The Australian dollar fell about -2.46% against the US dollar in the week to 6 November, its weakest level since late March.
The US dollar was only part of the story. The Aussie lost ground against nearly every major currency, and the steepest fall was against the Swiss franc.
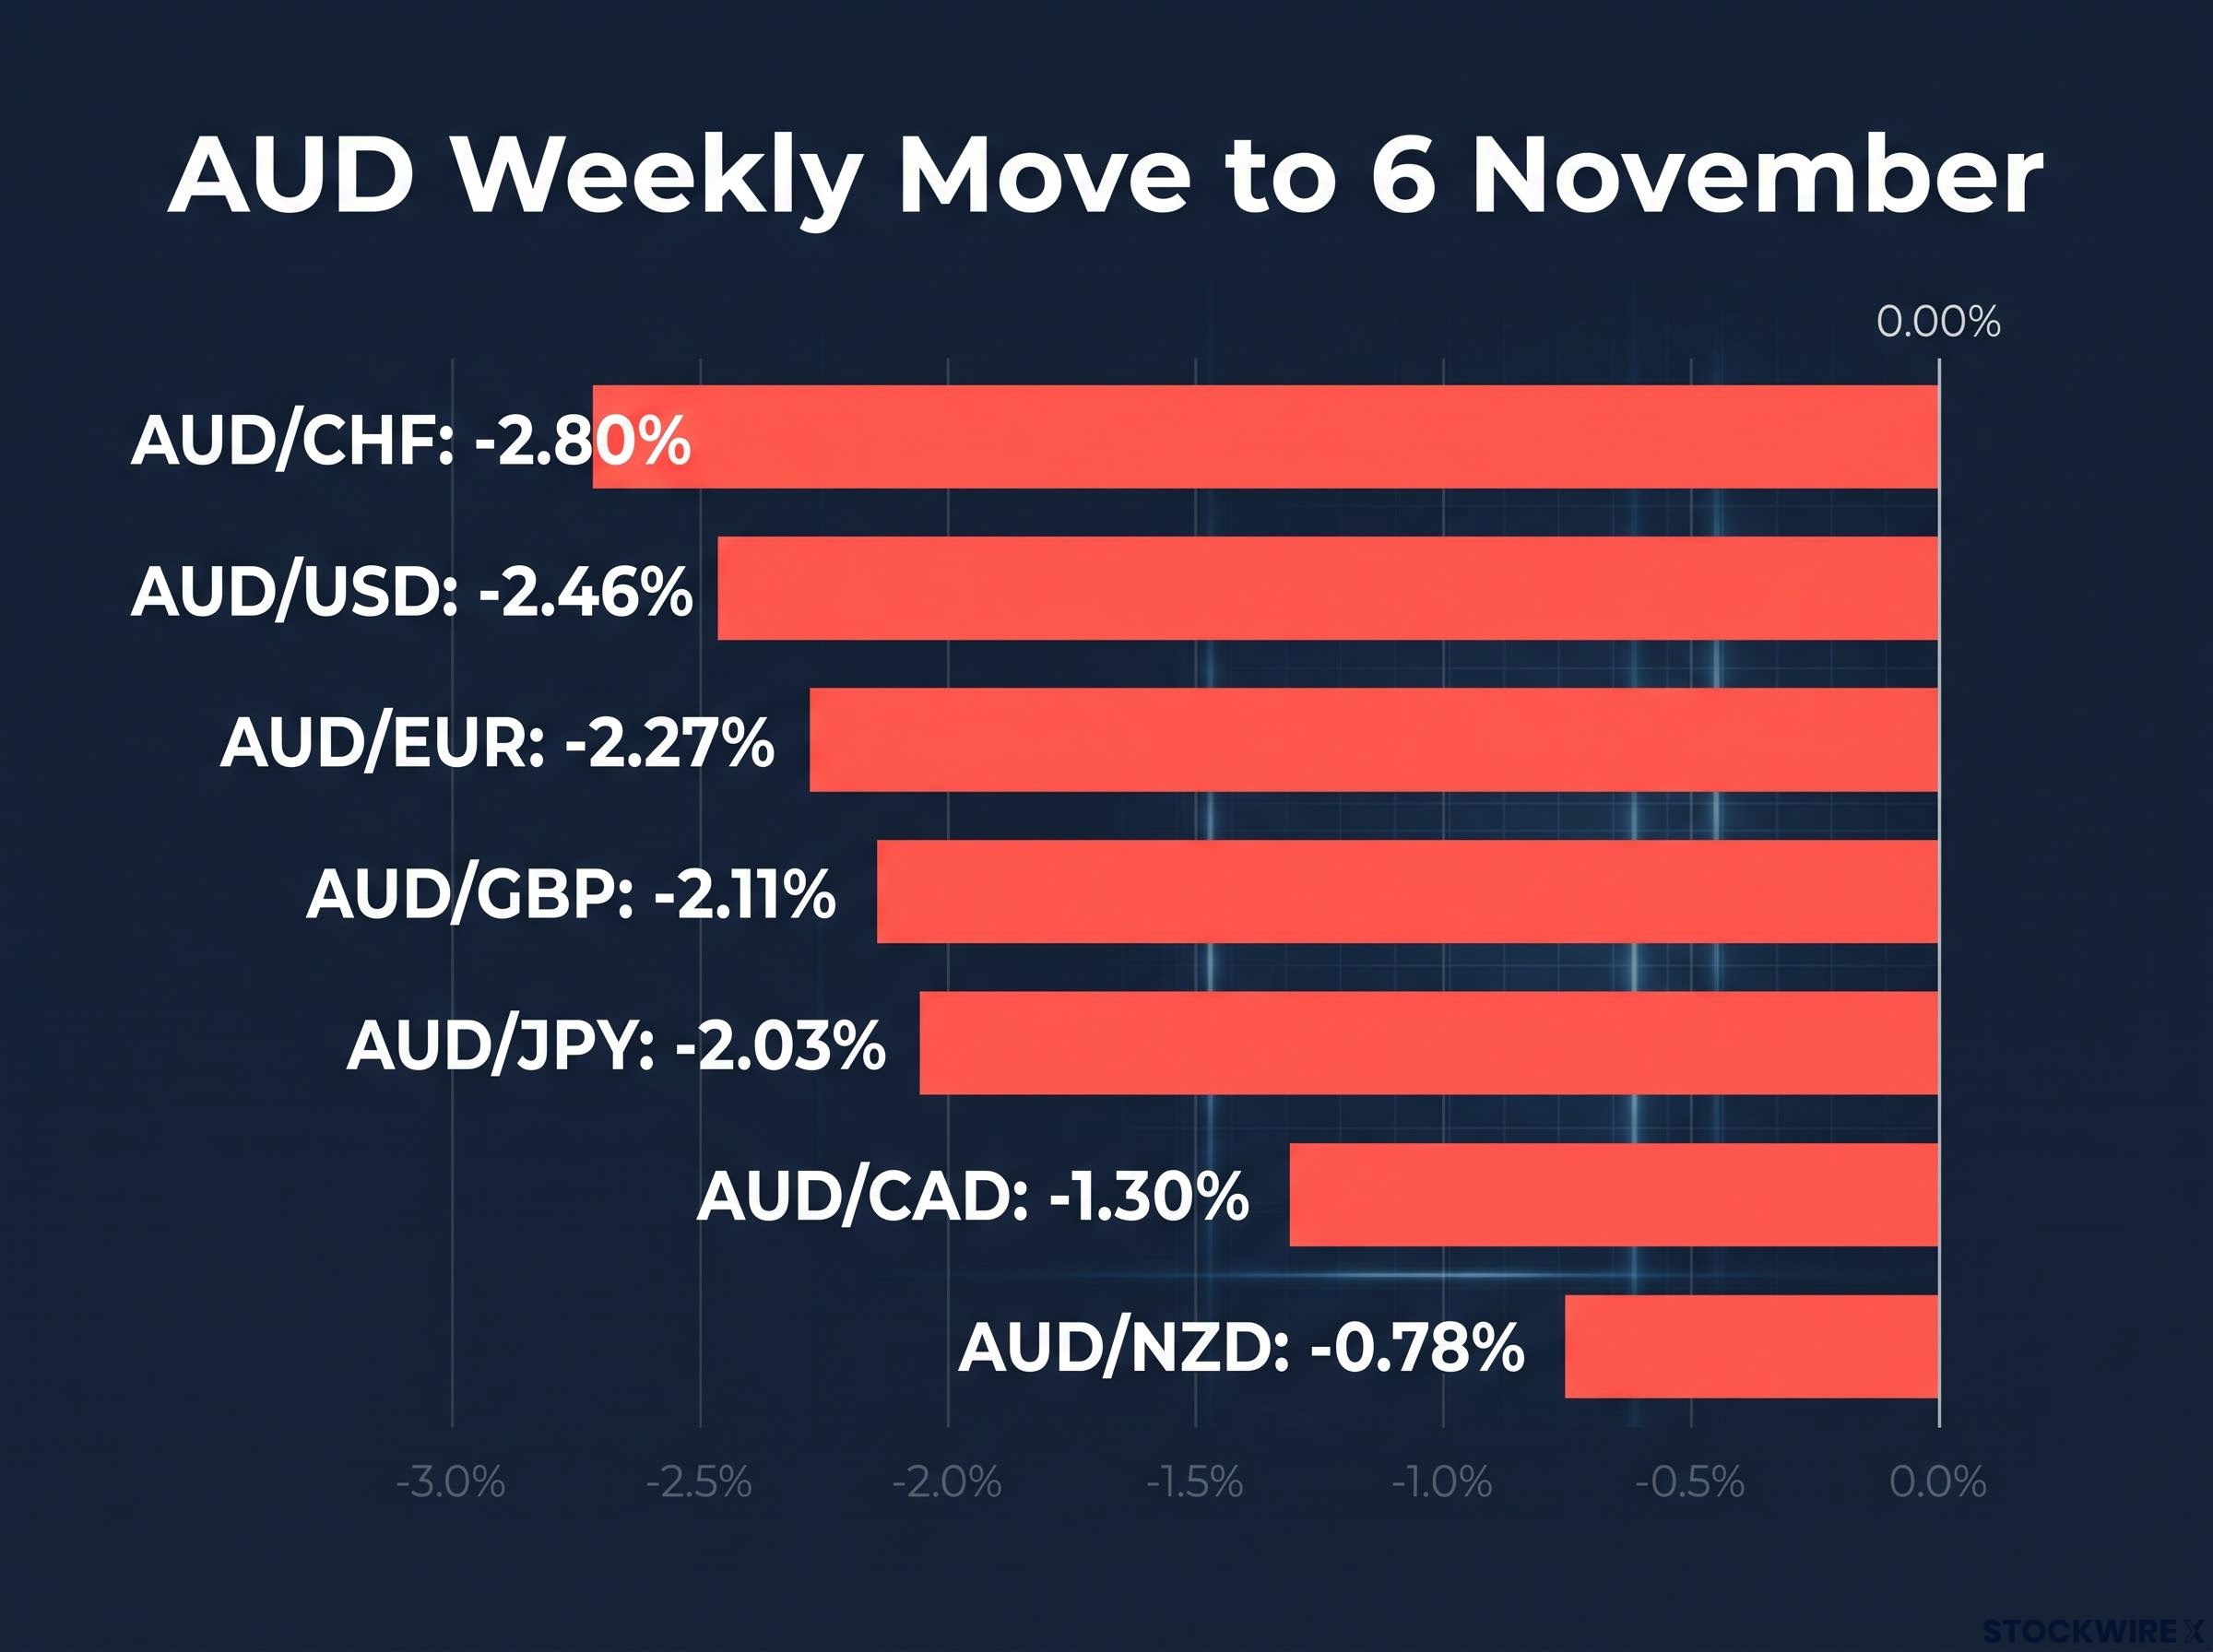
The Australian Dollar saw broad-based declines in the weekly move to 6 November, dropping 2.80% against the Swiss franc and 2.46% against the US dollar.
| Pair | AUD weekly move to 6 November |
|---|---|
| AUD/CHF | -2.80% |
| AUD/USD | -2.46% |
| AUD/EUR | -2.27% |
| AUD/GBP | -2.11% |
| AUD/JPY | -2.03% |
| AUD/CAD | -1.30% |
| AUD/NZD | -0.78% |
Only the New Zealand dollar, a fellow risk-sensitive currency, held up reasonably well. A sell-off in AI-linked technology stocks also cut demand for growth-linked currencies like the Aussie.
The breadth of the fall matters for you. When a currency drops against nearly every major peer, the problem sits with that currency. A pullback in the US dollar alone would not repair this week’s damage.
The gap between RBA hawkishness and currency strength has appeared before: a September episode saw the Aussie lose ground against six of seven major peers despite some of the firmest forward guidance in nearly two decades.
Why did a rate hike and a jobs beat push the AUD lower together?
The two forces arrived in sequence. The RBA’s message came first, and the US jobs data followed at the end of the week.
The RBA: hawkish on inflation, dovish on what comes next
On 3 November, the RBA raised the cash rate by 25 basis points to 4.85%. It was the fifth hike this year. Markets expected it, and the board was split 6-3, with three members preferring to hold at 4.60%.
The bigger change was in the RBA’s statement about what comes next:
- Kept: inflation remains broadly based and is expected to stay above 3% for the coming year
- Removed: the explicit line that rates could rise “further if needed”
- Added: the board will stay attentive to the data and is well placed to respond
Governor Michele Bullock said that after five increases it was probably “a good point to stop for a minute.” AUD/USD slid toward 0.6975 soon after the decision.
Commerzbank pointed to the split vote and the softer tone. OCBC sees 4.85% as the peak for this cycle, while NAB argues the rate already sits about 150 basis points above its estimate of neutral, the level that neither stimulates nor restrains the economy. CBA called it an “insurance hike,” meaning a one-off move to guard against inflation risk.
The US jobs surprise that revived Fed hike bets
On Friday, the US data hit. Nonfarm payrolls, the monthly count of jobs added outside the farm sector, far exceeded expectations.
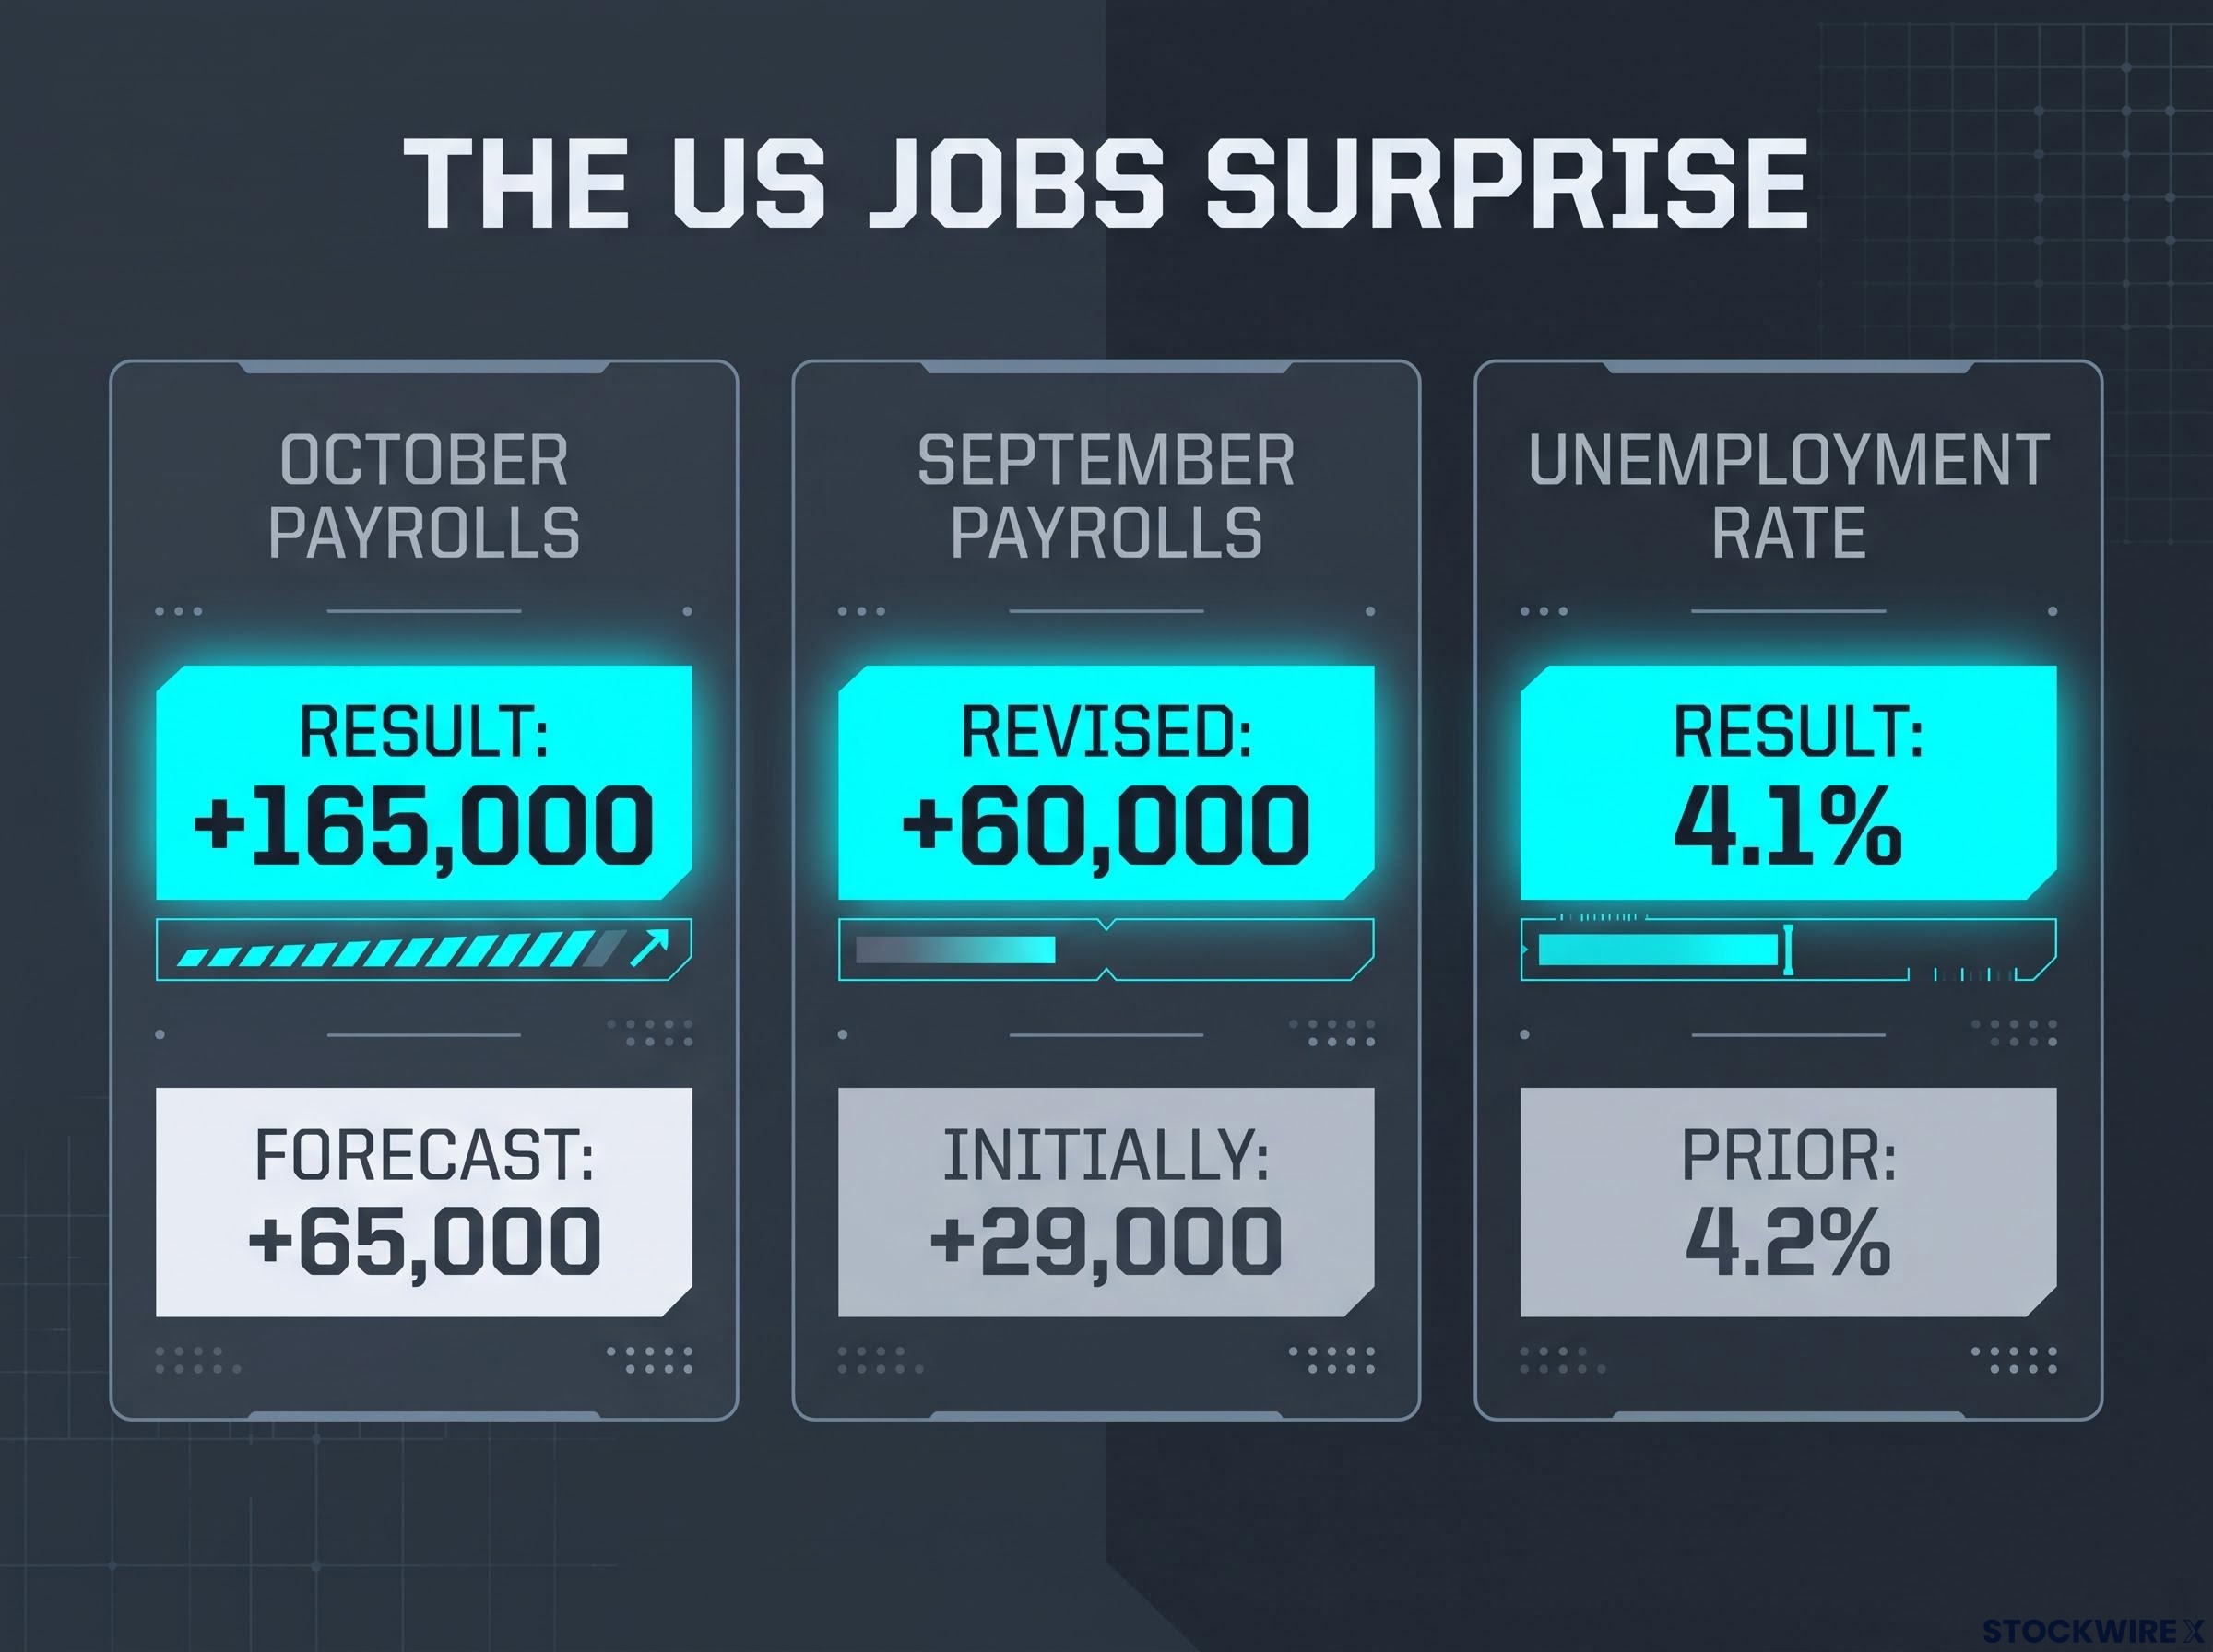
The October Payrolls result of +165,000 easily beat the forecast of +65,000, while the Unemployment Rate ticked down to 4.1%.
| Indicator | Result | Expectation or prior |
|---|---|---|
| October payrolls | +165,000 | +65,000 forecast |
| September payrolls (revised) | +60,000 | +29,000 initially |
| Unemployment rate | 4.1% | 4.2% prior |
The US dollar index (DXY), which tracks the greenback against a basket of major currencies, rebounded from a five-week low near 101.24. FedWatch-based pricing put the odds of a December Fed hike at about 69% on 6 November, down from about 83% the day before. An earlier report cited roughly 80%.
The result is a narrower expected gap between Australian and US interest rates. That gap underpins the carry trade, in which investors borrow in a low-yielding currency to hold a higher-yielding one. For you, the takeaway is that the RBA’s next step matters more than the headline rate.
Earlier in the year the AUD carry trade looked attractive as oil fell and volatility compressed; that window depends on contained cross-asset volatility and a widening yield gap, both of which this week’s moves challenged.
What levels matter next for the Aussie, and who feels the fall?
Technical analysts are watching one level above the rest.
| Level | Meaning | Source |
|---|---|---|
| 0.7100 | End-2026 forecast | ING, 5 Nov |
| 0.7058 | 200-day simple moving average | OCBC-linked analysis, 5 Nov |
| 0.7024 | 38.2% Fibonacci resistance | OCBC-linked analysis, 5 Nov |
| 0.7015 | Resistance | UOB, 5 Nov |
| 0.6970 | Near-term support or resistance | FX technical analysis, 6 Nov |
| 0.6833 | 30 March low, major support | FX technical analysis, 6 Nov |
| 0.6660 | Downside target if 0.6833 breaks | FX technical analysis, 6 Nov |
ING keeps its 0.710 year-end target, arguing that carry still supports the Aussie. UOB is neutral, with a near-term range of 0.6970-0.7040.
The bull case rests on weaker revised US payrolls or fading Fed hike pricing. The bear case rests on resilient US jobs, a broader risk-off move or softer Chinese demand. A break below 0.6833 would separate a pullback from a deeper slide, so it is the level to watch if you hold US dollar exposure or have travel booked.
These levels are market context, not predictions. Fed pricing depends on the data and can reverse quickly, and these views are speculative and subject to change.
What a weaker Aussie means for your money
| Group | Effect |
|---|---|
| Importers | US dollar priced goods, software and fuel cost more; unhedged margins tighten |
| Travellers | Trips to the US, Europe, the UK and Switzerland cost more |
| Exporters | US dollar revenue converts into more Australian dollars |
| Investors | Unhedged overseas assets gain in AUD terms; hedged holdings benefit less |
Three signals to watch before the next RBA and Fed decisions
This week’s fall came from several forces at once: strong US jobs data, firmer Fed pricing, softer RBA guidance and weaker risk appetite. No single decision caused it.
The Aussie is structurally exposed to five simultaneous forces, spanning RBA policy, iron ore, Chinese demand, risk sentiment and the trade balance, which helps explain why one central bank decision rarely settles its direction.
Three signals will shape what comes next:
- US labour and inflation data: any revisions or a soft inflation print could cool Fed hike bets.
- RBA communication and Australian data: watch whether the board’s pause language firms or fades.
- Risk sentiment and China: a deeper tech sell-off or weaker Chinese demand would add pressure.
If you have currency exposure, the 0.6833 line is the one to check before you act.
This article is for informational purposes only and should not be considered financial advice. Investors should conduct their own research and consult with financial professionals before making investment decisions. Past performance does not guarantee future results. Financial projections are subject to market conditions and various risk factors.
—