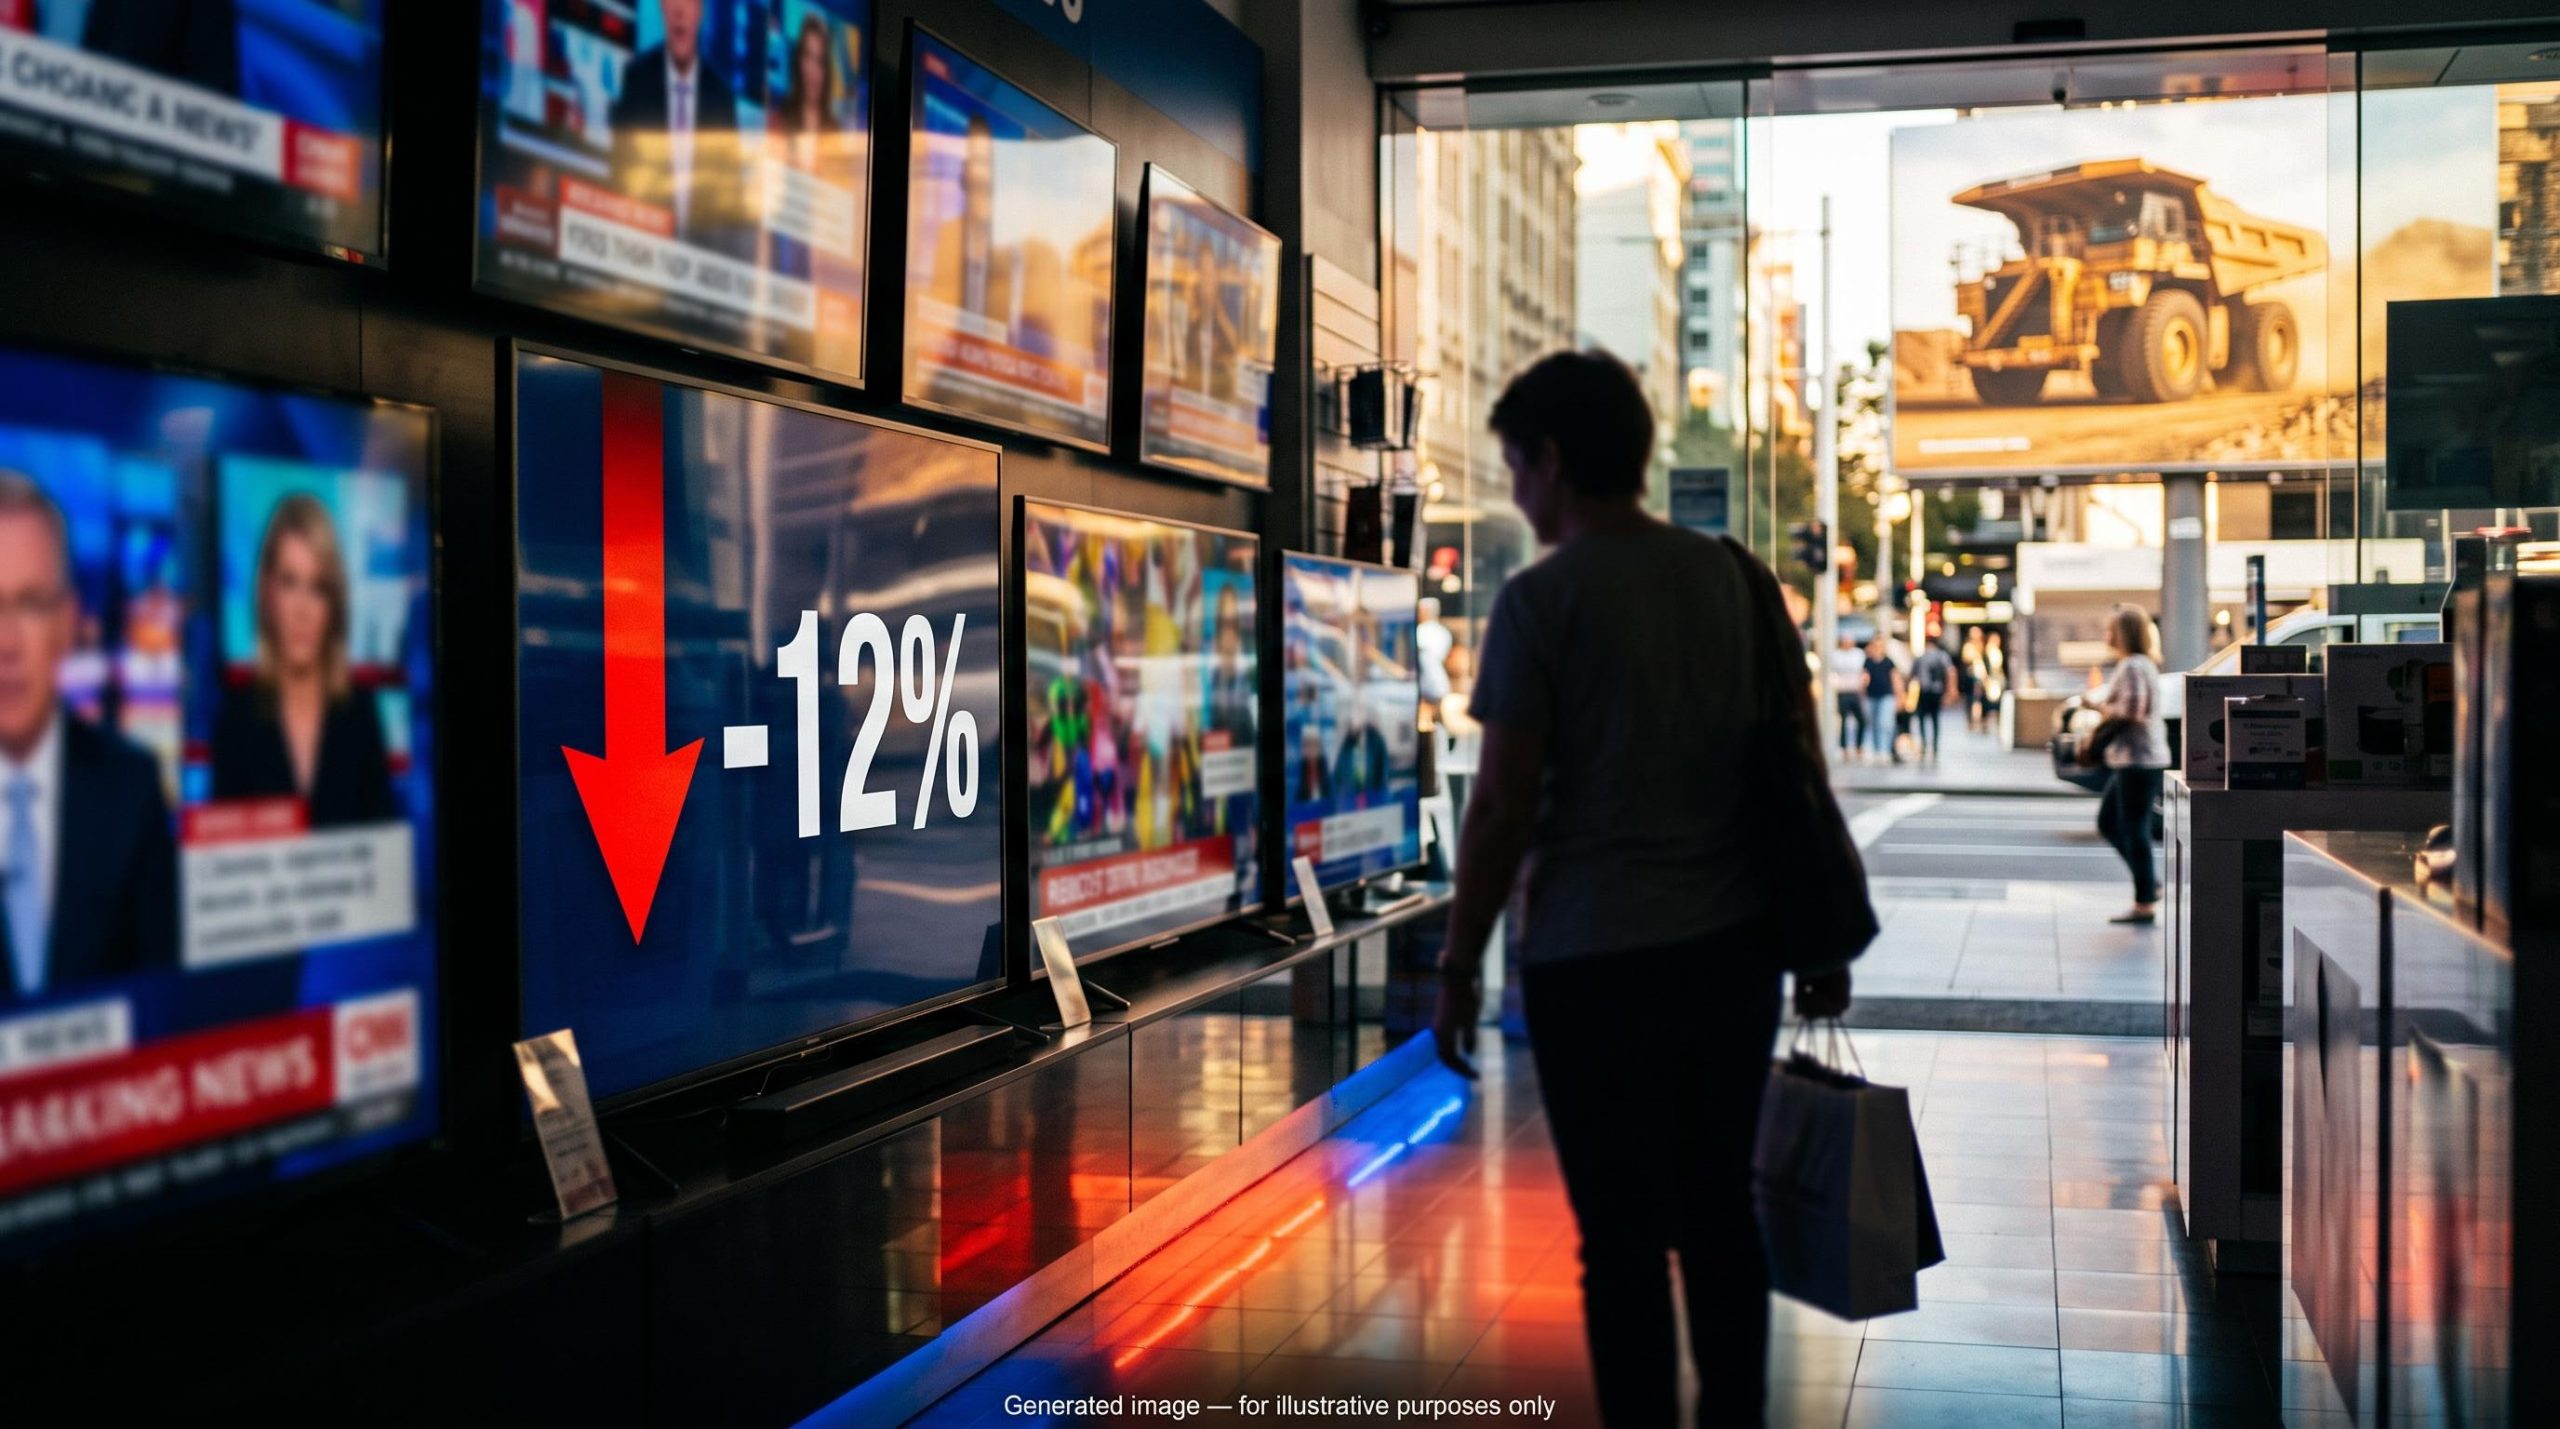
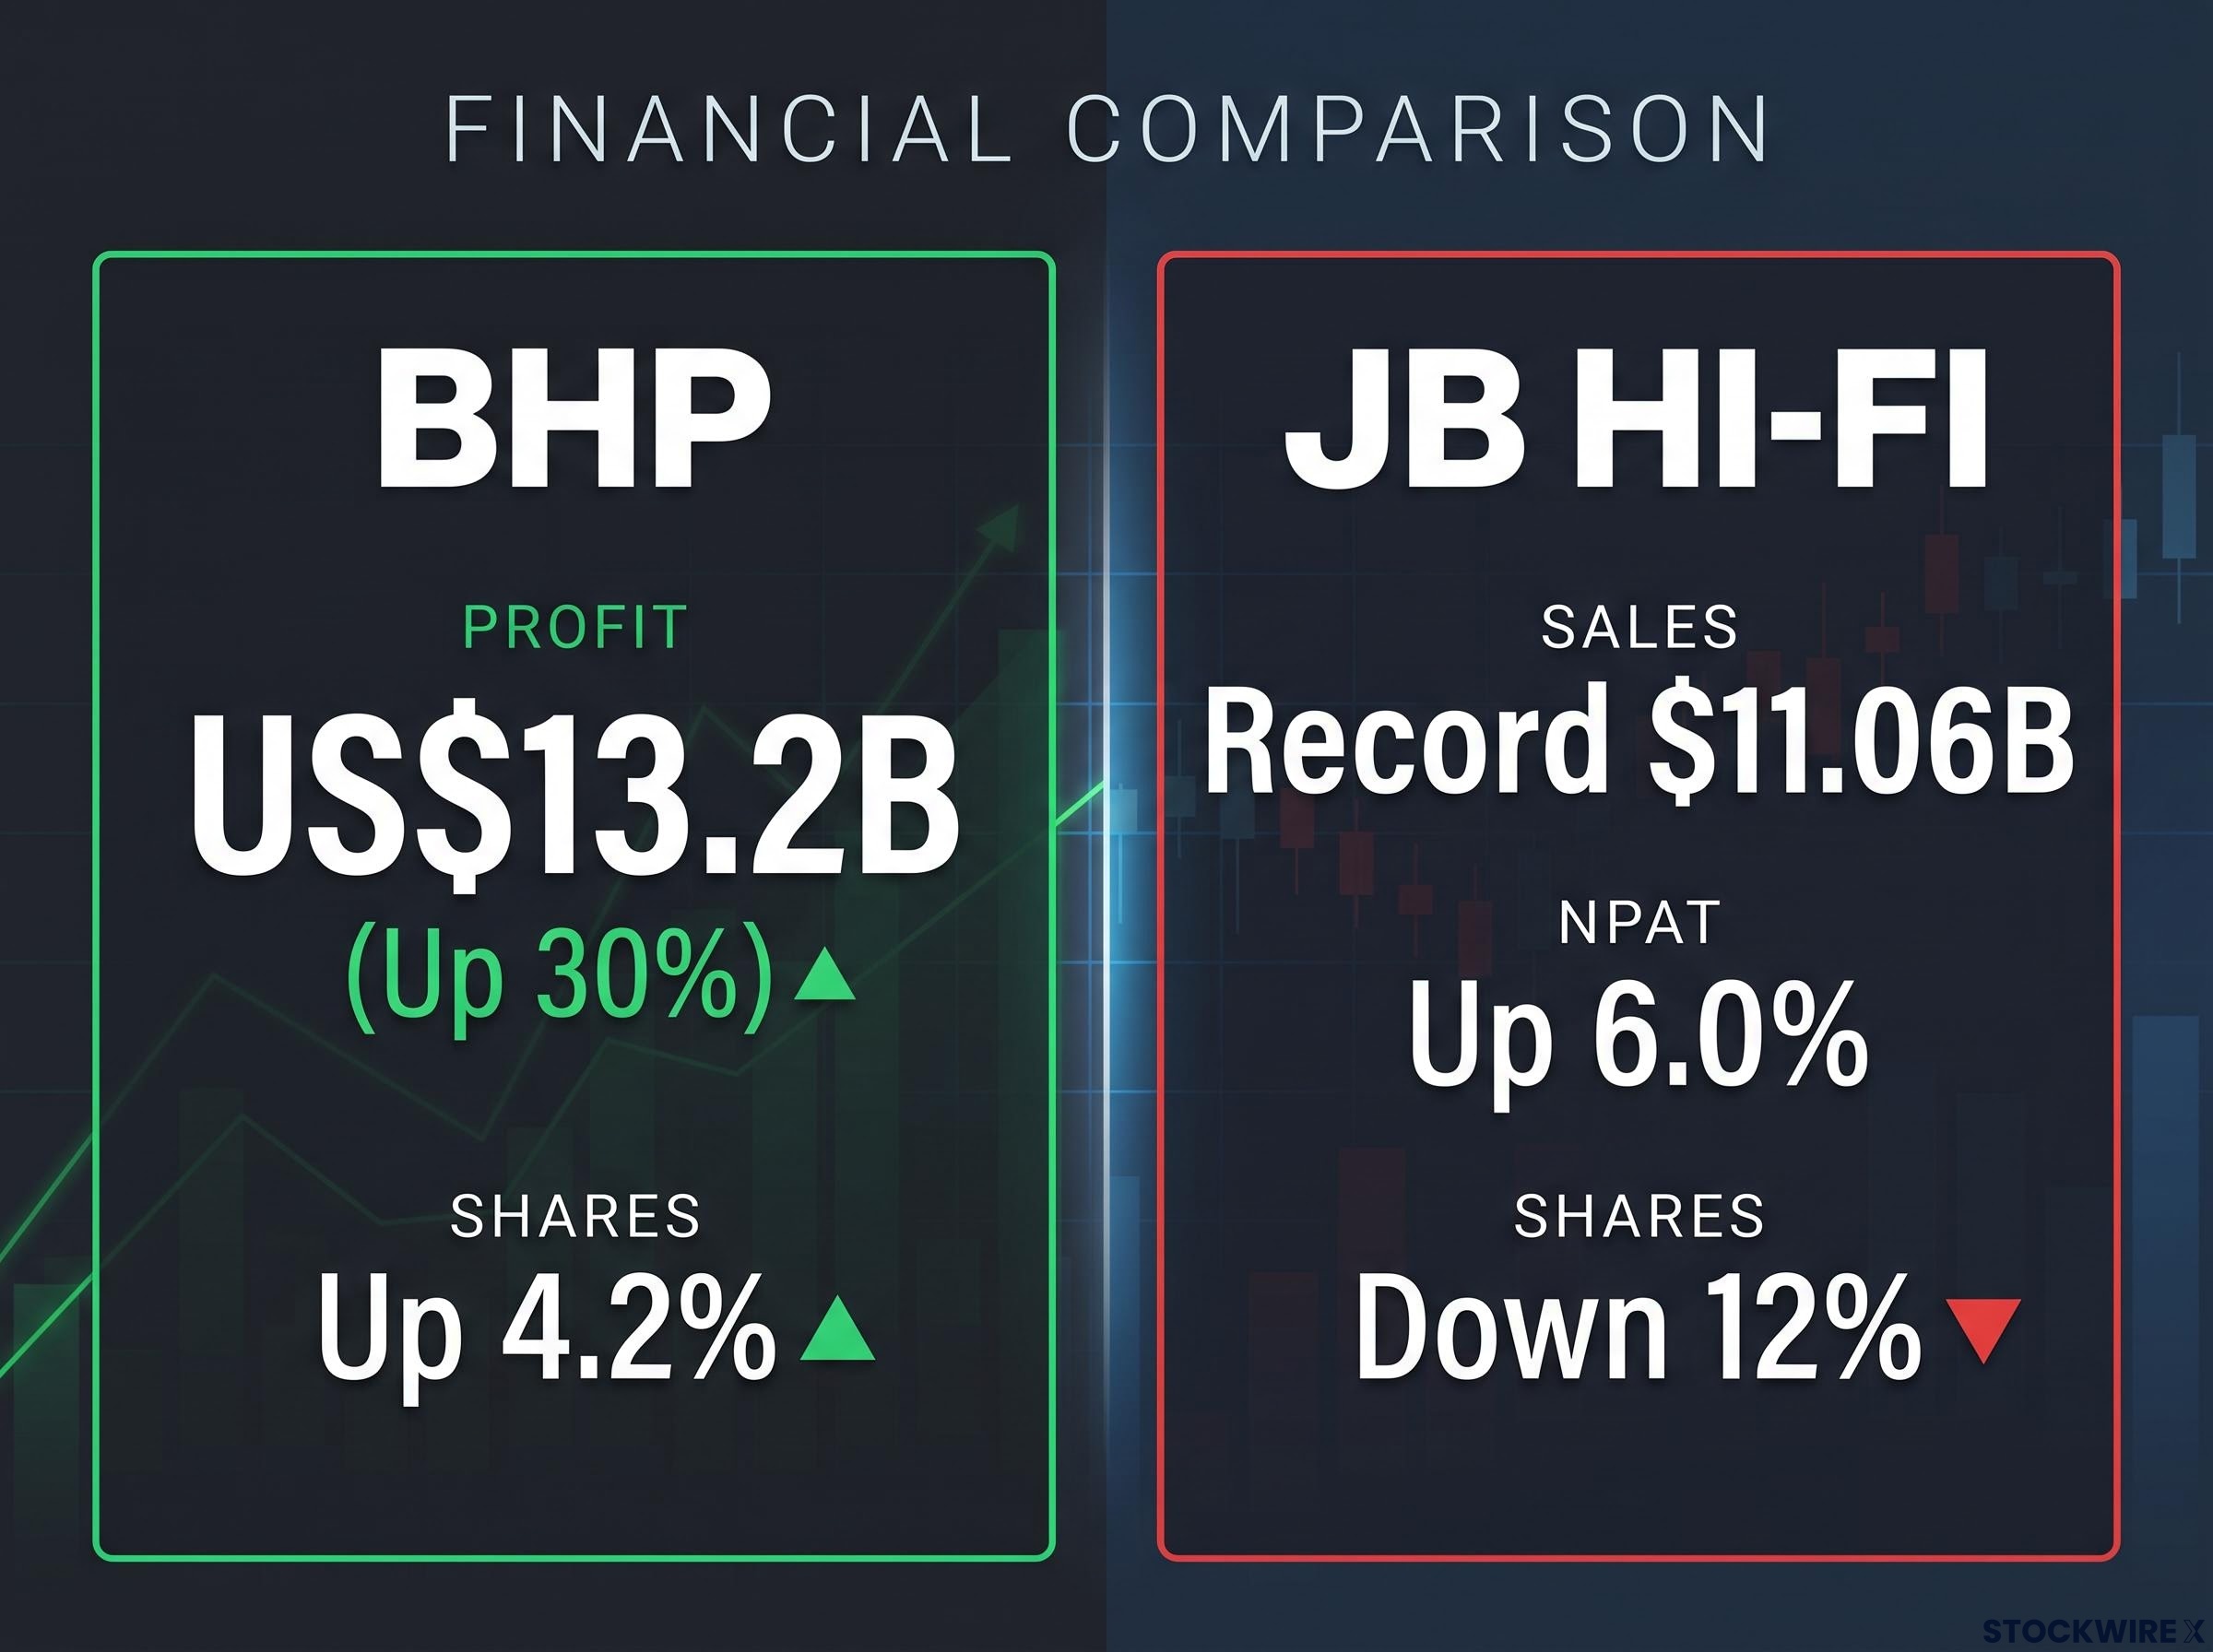
BHP lifted its annual profit by 30% and its shares rose. JB Hi-Fi posted record sales and lifted its dividend by 22.5%, and its shares fell about 12% in a single session. On the surface both looked like good results. The market treated them as opposites.
That gap is the most useful lesson from the latest ASX reporting season: the headline profit is rarely what the market is paying for.
The August-September 2026 results period, outside the banks, split in two. Resources and energy companies delivered strong profits and larger dividends. Across much of the rest of the market, companies reported solid or even record numbers and watched their share prices drop sharply.
It is now early November, so there is time to take these lessons into the next round of half-year results. You will leave with a practical way to judge whether a result is likely to help or hurt a share price, built around three things: guidance, expectations and dividends.
Where did the profits and dividends actually land?
The resources results were large. BHP reported FY26 underlying attributable profit of US$13.2 billion, up 30% and ahead of Visible Alpha’s US$12.66 billion consensus (the average forecast from analysts covering the stock). Its final dividend of US99¢ took the full-year payout to US$1.72, the highest in four years, at a 72% payout ratio. A payout ratio is the share of profit a company returns to shareholders as dividends.
Shares rose as much as 4.2% to $64.79. The reason for the lift was not hard to find.
What investors noticed Andy Forster, portfolio manager at Argo Investments, said investors particularly liked the dividend and called the result solid, while observing that copper was doing most of the work and that capital spending was expected to climb by more than US$1 billion the following year (Reuters, 17 August 2026).
South32 told a similar story. Underlying earnings jumped 55% to US$1.032 billion, linked to stronger silver and copper prices, and its fully franked final dividend more than doubled to US5.4¢ from US2.6¢. In energy, Woodside Energy declared a fully franked interim dividend of US57¢, payable 25 September 2026, while Santos declared an unfranked interim of US11.6¢ and its shares reached about a 12-year high.
| Company | Profit or earnings move | Dividend | Share reaction |
|---|---|---|---|
| BHP | Underlying profit US$13.2B, up 30% | Final US99¢; full year US$1.72 | Up as much as 4.2% |
| South32 | Underlying earnings US$1.032B, up 55% | Final US5.4¢ vs US2.6¢ | About 0.8% higher |
| Woodside Energy | Profit outlook lifted by gas prices | Interim US57¢, fully franked | Not specified in research |
| Santos | Strong free cash flow | Interim US11.6¢, unfranked | About a 12-year high |
The catch: profit growth was narrow
Analysis from E&P on 16 October 2026 found realised profits rose 12.0% year-on-year across the season. Strip out materials, and growth was just 4.6%.
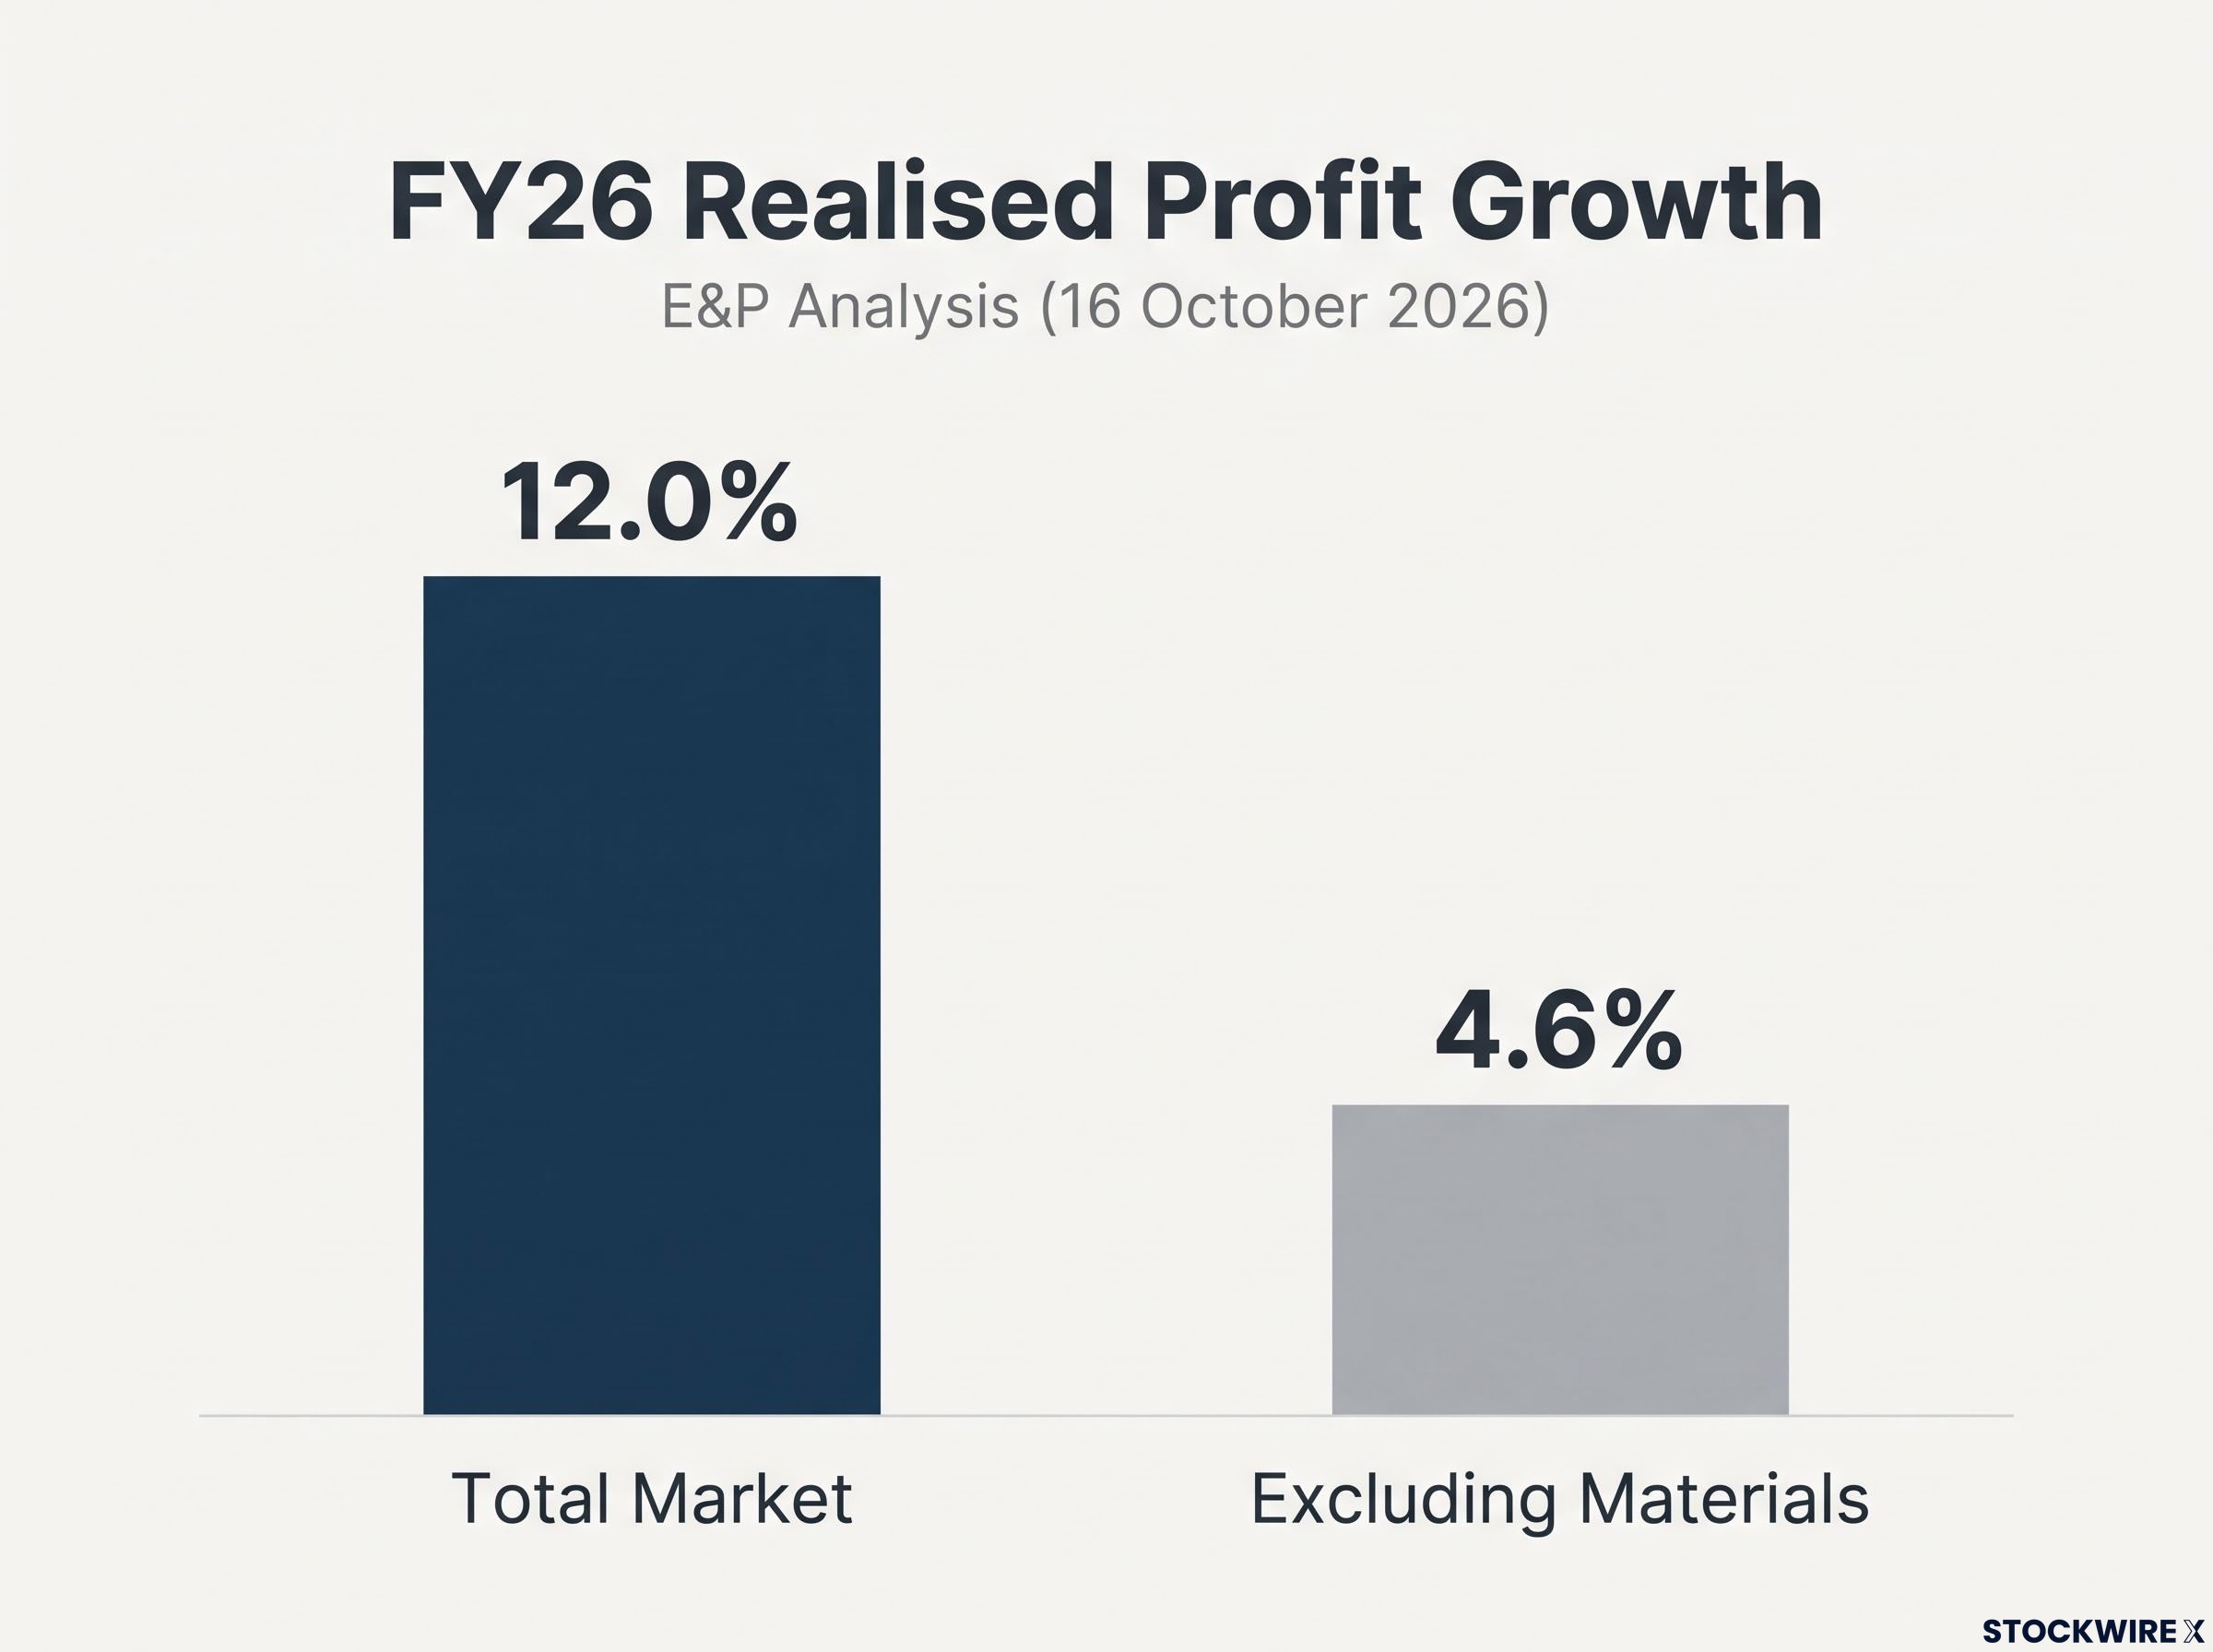
So a “strong season” headline mostly described one sector. A resources result is largely a call on commodity prices, which means the question for you is whether the price and the payout can last, not simply whether profit went up.
When big ASX news breaks, our subscribers know first
Why did good results still send shares down?
Outside resources, beating forecasts proved a weak shield. Woolworths shows what the rewarded version looked like: underlying net profit after tax (NPAT) of about $1.60 billion against $1.55 billion consensus, EBIT of $3.105 billion against $3.052 billion, and FY26 dividends of 97¢, up 15.5%. Shares climbed as much as 6.0% to $41.19, their highest in about five years.
The others did not get the same treatment.
Momentum and guidance: JB Hi-Fi and SGH
JB Hi-Fi delivered record sales of $11.06 billion, NPAT of $489.9 million (up 6.0%) and dividends of 337¢. But Australian sales growth slowed from 5.0% in the first half to 2.6% in the third quarter, then turned negative in the fourth, and July stayed weak. Shares fell about 12%, the worst day since April 2025.
Seven Group Holdings (ASX: SGH) reported flat underlying NPAT of $920 million, in line with its own guidance. Its FY27 guidance, however, pointed to flat to low-single-digit EBIT growth against consensus of about 3.7%. Shares fell as much as 12%, even alongside a buyback of up to $500 million.
Regulation and mix: Tuas and Life360
Tuas beat Morgan Stanley’s estimates, with revenue of S$187.6 million and NPAT of S$29.6 million against a S$22.7 million forecast. Shares still fell 17%, because there was no clarity on resolving a regulatory breach that had stopped the M1 transaction.
Life360, a calendar-year reporter, lifted Q2 revenue 38% to US$159.0 million, with advertising up 315% but hardware down 20%. Shares fell 15%. The full reasons for the drop were not established, so treat the mix shift as one possible factor, not the explanation.
| Company | What the headline said | What the market focused on | Share reaction |
|---|---|---|---|
| Woolworths | Profit beat, dividend up 15.5% | Beat plus higher payout | Up as much as 6.0% |
| JB Hi-Fi | Record $11.06B sales | Negative Q4 and weak July | Down about 12% |
| Tuas | Beat broker estimates | Unresolved regulatory breach | Down 17% |
| SGH | In line with own guidance | Below-consensus FY27 outlook | Down as much as 12% |
The pattern repeated elsewhere. WiseTech fell about 14% on weaker revenue guidance. Zip posted record cash EBITDA of $268.9 million, up 57.9%, yet later research shows its shares reversed as investors questioned FY27 guidance.
Each sell-off was the market repricing next year. On result day, your first question should be what changed in the outlook, not how big the profit was.
How do guidance, expectations and dividends move a share price?
Most investors assume a profit beat should lift the price. The season showed why that assumption fails so often.
A share price reflects what investors expect a company to earn in future, not what it earned last year. NABtrade put it plainly on 3 September 2026: the market was looking through FY26 and pricing FY27. Guidance, a company’s own forecast for the year ahead, is therefore often the most price-sensitive line in a result.
The numbers show this was market-wide:
- Morningstar Australia: across 164 companies, the average result-day move was -1.96%.
- Montgomery Investment Management: only 36% beat expectations, against roughly 40% historically.
- Investor Daily: 18% guided FY27 at least 2.5% above the market, 30% below consensus and 55% left guidance unchanged.
- Livewire: FY27 earnings expectations were revised down about 2%.
The disconnect in one number Morningstar recorded an average result-day fall of -1.96% even though analysts made 45 fair-value upgrades and only 29 downgrades. Stocks with unchanged fair values fell an average 3.1%.
Valuations raised the stakes. Pitcher Partners put the market at about 18.1 times FY27 expected earnings, a 12.2% premium to its 20-year average. When prices already assume growth, any softening in the outlook can cut the multiple. E&P found reactions bore little relationship to the size of the beat.
| Mechanism | How it works | Season example |
|---|---|---|
| Priced-in expectations | A beat can disappoint if investors assumed more | Tuas beat estimates but fell 17% |
| Forward valuation | High multiples punish any growth slowdown | SGH’s below-consensus FY27 guidance |
| Dividend policy | Payouts are a visible part of shareholder return | BHP, South32 and Woolworths |
| Commodity cycle | Profits track prices that can reverse | Copper drove BHP’s result |
| Regulatory risk | One unresolved issue can outweigh a beat | Tuas and the M1 transaction |
| Consumer slowdown | Recent sales trends outweigh annual records | JB Hi-Fi’s negative Q4 |
Dividends work the same way. BHP’s larger-than-expected final, South32’s doubled final and Woolworths’ 15.5% rise all gave investors something concrete. The takeaway for you: a result is only good news if it beats what was assumed, and a dividend only helps if it looks repeatable.
How can you read the next result season more clearly?
That framework becomes a checklist you could run on one holding this week:
- Compare with expectations. Check the result against consensus, not just last year.
- Read the outlook. Look at guidance on revenue, margins, costs and capital spending before headline profit.
- Test the dividend. Ask whether recurring cash flow or a commodity peak is funding it.
- Check the latest quarter. Recent trading, as JB Hi-Fi showed, can outweigh a record year.
- Flag regulatory items. Treat unresolved matters as valuation issues, not footnotes.
- Look at capital returns. Telstra added a further buyback of up to $1 billion and lifted its total dividend 10.5% on a cash basis despite a revenue decline.
Not every fall was wrong. Some signals help separate the two:
- May be fair: hard evidence of slowing trade, such as JB Hi-Fi’s negative fourth quarter
- May be fair: rising costs, as with Northern Star, which posted a record profit but flagged higher costs and sold off
- May be overdone: a fall after analysts raised fair value
- May be overdone: a drop with no change to the long-term thesis
A reminder from Morningstar Short-term earnings reactions do not always change a company’s long-term fair value.
Resources dividends carry their own caveat. South32’s 41% payout matched its 40% minimum policy, which shows discipline but not permanent security if commodity prices reverse. ClearBridge and Franklin Templeton (19 October 2026) also pointed to higher costs, weaker demand and funding pressure, with companies using pricing or cost savings to defend earnings.
Treat a result-day move as a prompt to re-test your thesis against the new guidance, not as a verdict or a reason to act automatically.
What the FY26 results tell you before the next reporting cycle
The season had a clear through-line. Resources profits were strong and backed by real dividends, but they rested on commodity prices. Everywhere else, the outlook, not the record result, set the share price.
Before the next reporting window, three variables deserve your attention: commodity prices, which will decide whether resources payouts hold; early FY27 trading updates, which will show whether consumer weakness spreads; and guidance against consensus, which drove more of this season’s moves than profit itself.
When your holdings next report, ask one question first. What does this result change about the next 12 months? If the answer is nothing, the headline matters less than it looks.
This article is for informational purposes only and should not be considered financial advice. Investors should conduct their own research and consult with financial professionals before making investment decisions.