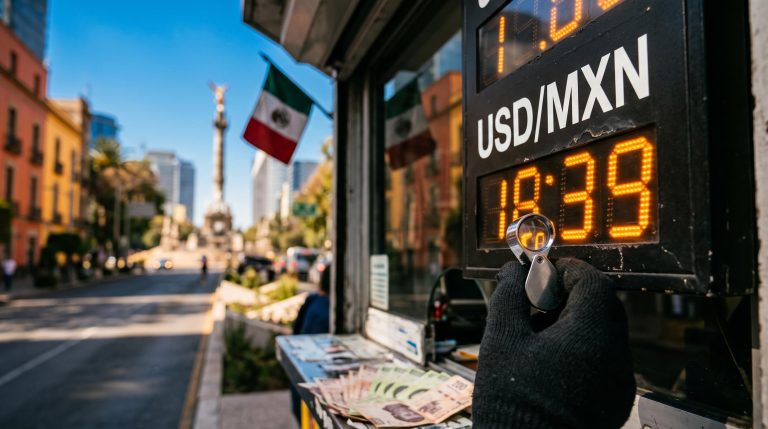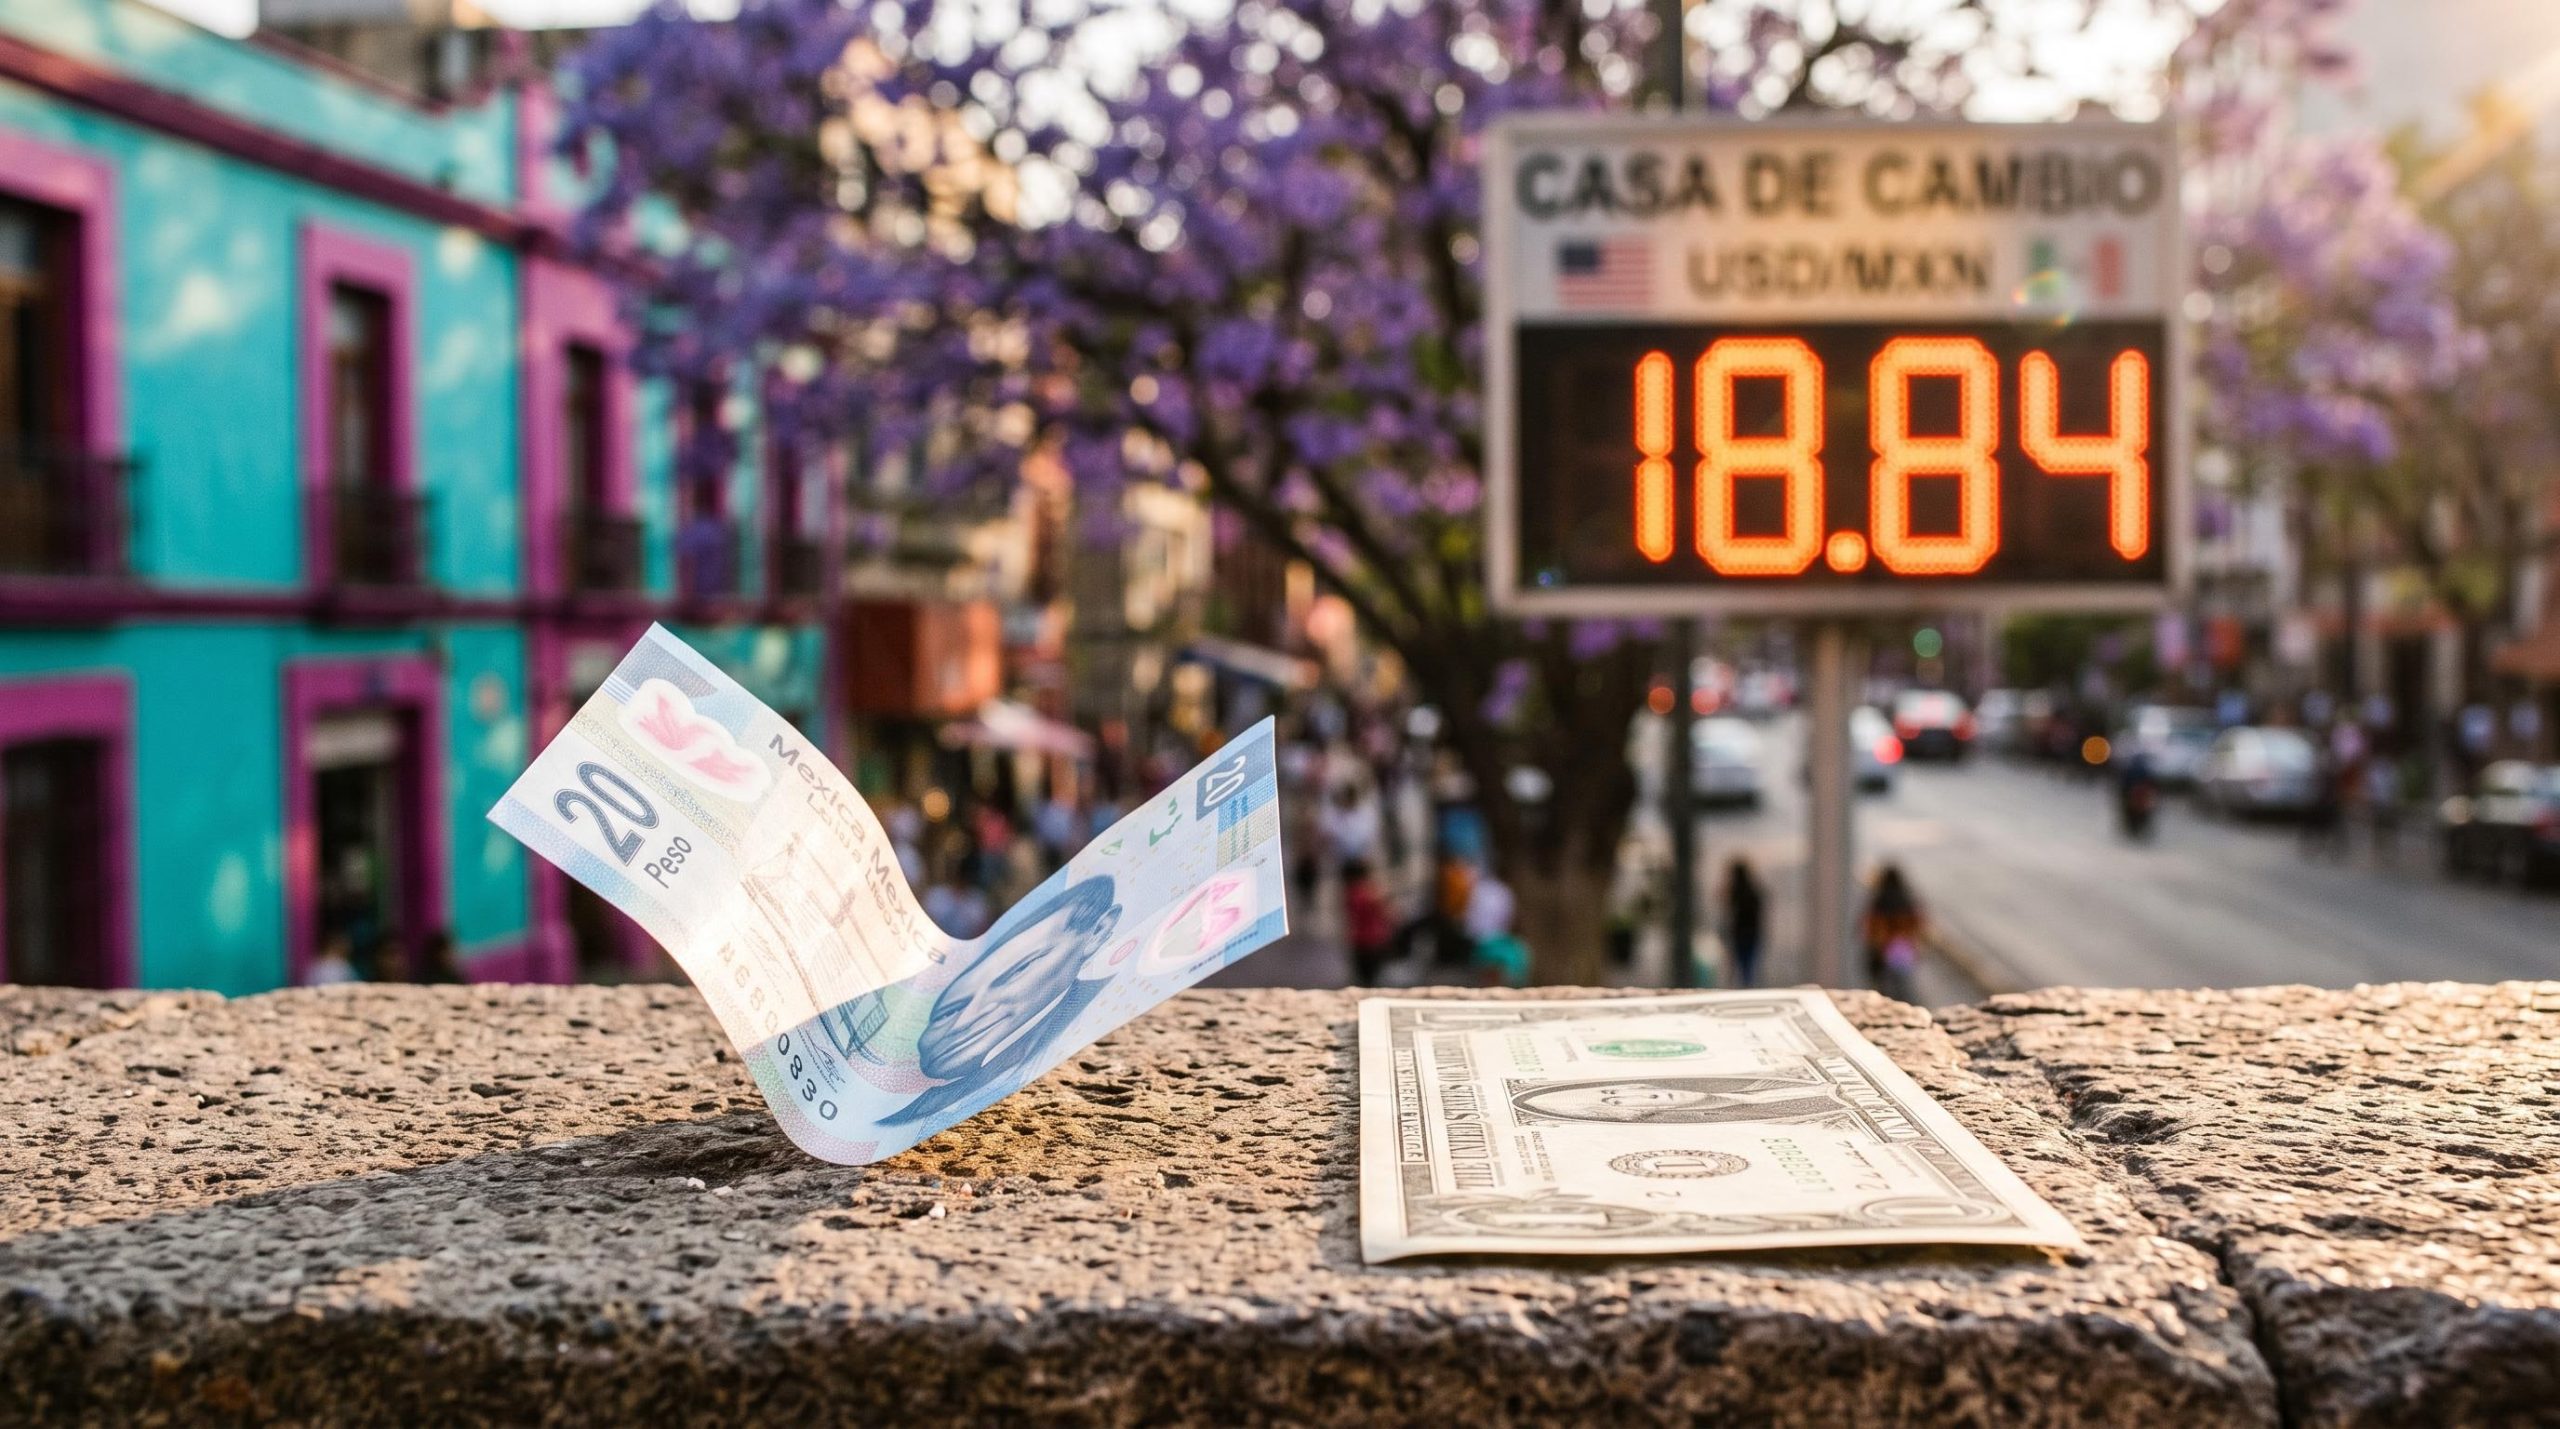
A US election can move the Mexican peso harder than it moves the dollar itself. In one case-study session, USD/MXN (the number of pesos one US dollar buys) jumped more than 1.40% to about 18.84. Meanwhile the US Dollar Index (DXY), which tracks the dollar against six major currencies, barely moved near 101.85, and Wall Street was in a positive mood.
That gap matters for any reading of the Mexican peso outlook. The peso often works as the market’s preferred liquid stand-in for both US and emerging-market political risk, so it can absorb shocks that have little to do with Mexico’s own policy.
A note on dates before you read the numbers. The figures come from a report dated 3 November 2026, but the original source also describes them as historical readings from a midterm-election period. They are treated here as a case study, not a live quote.
Here is how to tell which forces actually move USD/MXN, how to separate a headline shock from a lasting trend, and how to read the chart levels without trusting them too much.
What happened to the peso, and why one day tells you so much?
On the screen, the session looked simple. USD/MXN sat near 18.84, up more than 1.40%. The DXY hovered near 101.85. Risk appetite on Wall Street was positive, yet the dollar still gained against emerging-market currencies, the peso included.
The gap in one line USD/MXN rose more than 1.40% while the DXY moved only about 0.05%. Something beyond broad dollar strength was hitting the peso.
Look closer and that one day holds three separate stories. The first was uncertainty over the US midterm elections and the makeup of Congress. The second was weak Mexican factory data, and the third was firm US economic data.
The S&P Global Mexico Manufacturing PMI fell to 49.5 from 50.3. A Purchasing Managers’ Index (PMI) is a monthly survey of company managers, and a reading below 50 means activity is shrinking. Firms blamed cash-flow strain, inflation pressure, raw-material shortages and weak sales.
| Indicator | Latest | Prior |
|---|---|---|
| Mexico Manufacturing PMI (S&P Global) | 49.5 | 50.3 |
| US JOLTS job openings | 7.523 million | 7.190 million |
| US factory orders | +1.8% m/m, +7.2% y/y | +0.3% m/m (revised) |
Politics added a third layer. BetInt’s aggregation on 3 November 2026 put Democratic control of the House at about 95% and the Senate at about 76%. These are market-implied probabilities, and they shift by platform and timestamp. The original source cited similar Polymarket odds (96% House, 75% Senate) that reflected early-2022 positioning, and Republicans won the House that year.
The dating needs one more caveat. The same original source places spot near 18.60 on 3 November 2026, so every figure here is labelled by source and date.
The lesson for you is discipline. When local weakness, US strength and political risk land on the same day, no single cause deserves full credit for the move.
Strategists writing on the midterm dollar outlook argue that a Democratic House was largely priced in, so the Fed path and Treasury refunding may steer the DXY more than the vote itself.
When big ASX news breaks, our subscribers know first
The core drivers: how Banxico, risk sentiment, oil, remittances and nearshoring move USD/MXN
Start with one simple idea: the peso is a yield-plus-risk currency. It pays you to hold it, and it punishes you when fear rises. As the most traded currency in Latin America, it is also easy to buy and sell quickly, which makes it a favourite tool for traders expressing a view.
Banxico and the carry advantage
The Bank of Mexico (Banxico) cut its policy rate by 25 basis points to 6.50% in May 2026. It then held in June, August and September. Headline inflation was 3.42% against a target of 3%, plus or minus one percentage point, and analysts expect no change in rates through the end of 2027.
That rate gap with the US creates the carry trade. A carry trade means borrowing in a low-yielding currency and investing in a higher-yielding one to pocket the difference.
Yet a high rate is no shield on its own. If political risk lifts expected volatility, the cost of hedging and the expected loss on the currency can consume the extra yield, even with the policy rate unchanged.
Risk sentiment and the unwind
Sentiment works unevenly. Calm markets encourage gradual peso buying as investors collect the yield. A shock reverses that in a hurry, because leveraged positions unwind, stop-loss orders trigger and thin liquidity amplifies the jump in USD/MXN.
Banxico’s own financial-stability report described this pattern. The peso appreciated in early 2026 as volatility fell and carry trades returned, then weakened when a geopolitical shock drove investors away from risk.
When the yield gap narrows, you can see why carry trade unwinds tend to start quietly: fewer new inflows arrive first, and only later do leveraged holders rush for the exit, which is when the peso moves fastest.
Oil, remittances and nearshoring
These supports are real but conditional. Higher oil helps Mexico’s export and fiscal revenue, unless the rise comes from a supply shock that frightens global markets. Remittances add dollar supply, yet a stronger peso shrinks what each dollar buys for the families receiving them.
Nearshoring, where companies move production closer to the US, can attract foreign direct investment (FDI). Morningstar DBRS has reportedly warned that weak rule of law, infrastructure, energy, water and skills could stop announced projects from becoming real capacity. Nearshoring works over years, not days.
| Driver | Usually supports MXN when | Usually hurts MXN when | Time horizon |
|---|---|---|---|
| Banxico rate differential | Gap with US is wide and volatility is low | Fed stays restrictive or more Mexican cuts are expected | Weeks to months |
| Risk sentiment | Markets are calm and carry trades build | Shocks trigger leveraged unwinds | Hours to weeks |
| Oil | Prices rise on demand | Prices rise on a supply shock that spooks markets | Weeks to months |
| Remittances | US jobs are strong and flows are steady | US employment or enforcement cuts flows | Months to years |
| Nearshoring and FDI | Investment turns into capacity | Institutional or trade risk delays projects | Years |
Keep this table as your checklist. Any future peso move will run through at least one of these channels.
Why political uncertainty hits the peso: 2016, 2024 and the midterms
Politics flows straight through the risk channel, and the pattern repeats with striking consistency.
- 2016 US election: As Donald Trump’s chances rose, the peso weakened on fears of tariffs and a NAFTA renegotiation. After his win it fell more than 13% intraday, to just below 21 per dollar.
- 2024 Mexican election: Claudia Sheinbaum and Morena won a bigger mandate than expected on 2 June 2024. The peso fell as much as 4.29% at first and roughly 8-12% overall as the judicial overhaul advanced, according to Reuters.
- The midterms case study: Nothing changed in Mexican cash flows. The peso moved on expectations for US fiscal and trade policy, gridlock, possible USMCA or tariff fights, US growth, the Federal Reserve’s path and emerging-market risk appetite.
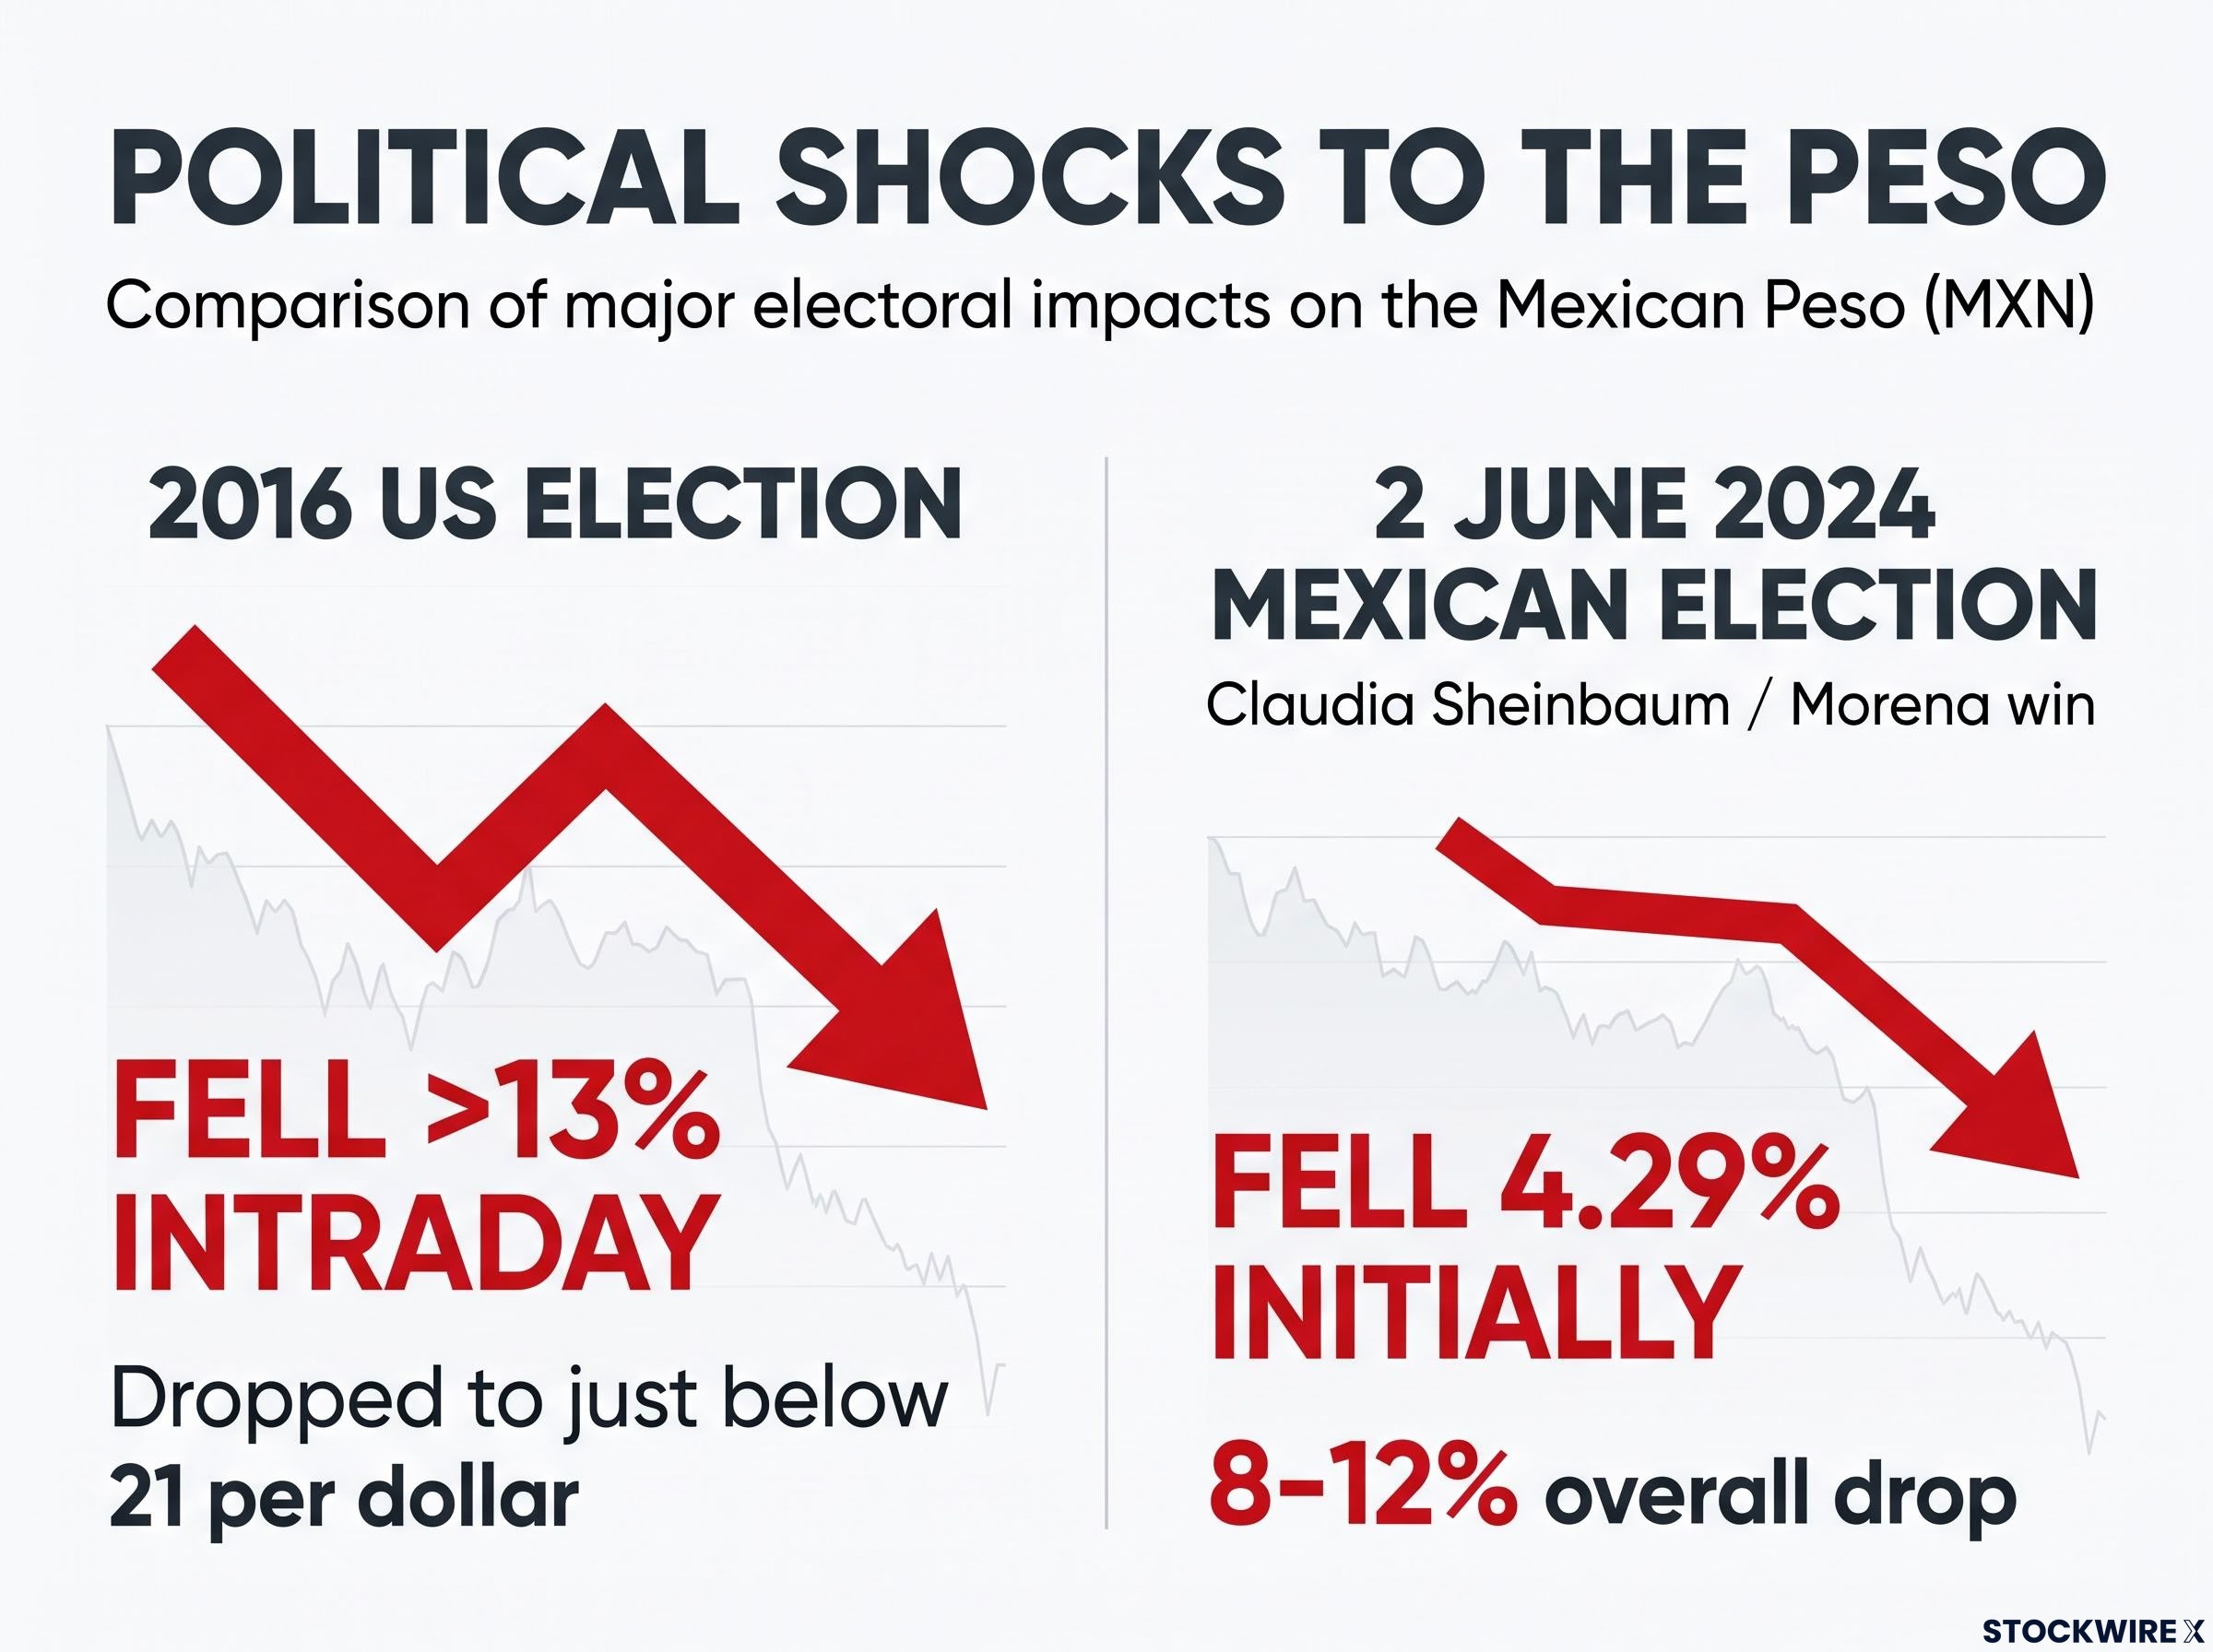
2016 in one number The peso fell more than 13% intraday after the US election, without any change in Mexican policy that day.
The 2024 episode deserves a careful read. Markets were not simply reacting to an election. They were repricing court independence, property rights and fiscal discipline.
Why the peso, and not some other currency? Mexico is tightly tied to the US economy, and USD/MXN is liquid enough to carry big bets on emerging markets and global risk.
The takeaway for you: markets price the odds of political outcomes in advance. A result that matches the odds may barely move the peso, while a surprise can move it violently.
A flat index can mislead, because the DXY stalls when supportive news such as hot inflation and Fed hike odds is already priced in, which is why a surprise matters far more than a headline.
How to read the USD/MXN chart: levels, moving averages and their limits
Begin with the map. On the daily chart in the original FXStreet analysis, which was written with an AI tool, price sat well above a cluster of the 50, 100 and 200-day simple moving averages (SMAs) around 17.78-17.82. A moving average is the average closing price over a set number of days, updated each day.
The Relative Strength Index (RSI), a momentum gauge running from 0 to 100, stood near 65. That signalled a firm but not extreme near-term bias towards a stronger dollar.
Support is a price zone where buying may slow a fall. Resistance is a zone where selling may cap a rise. Treat both as areas of pressure rather than exact prices.
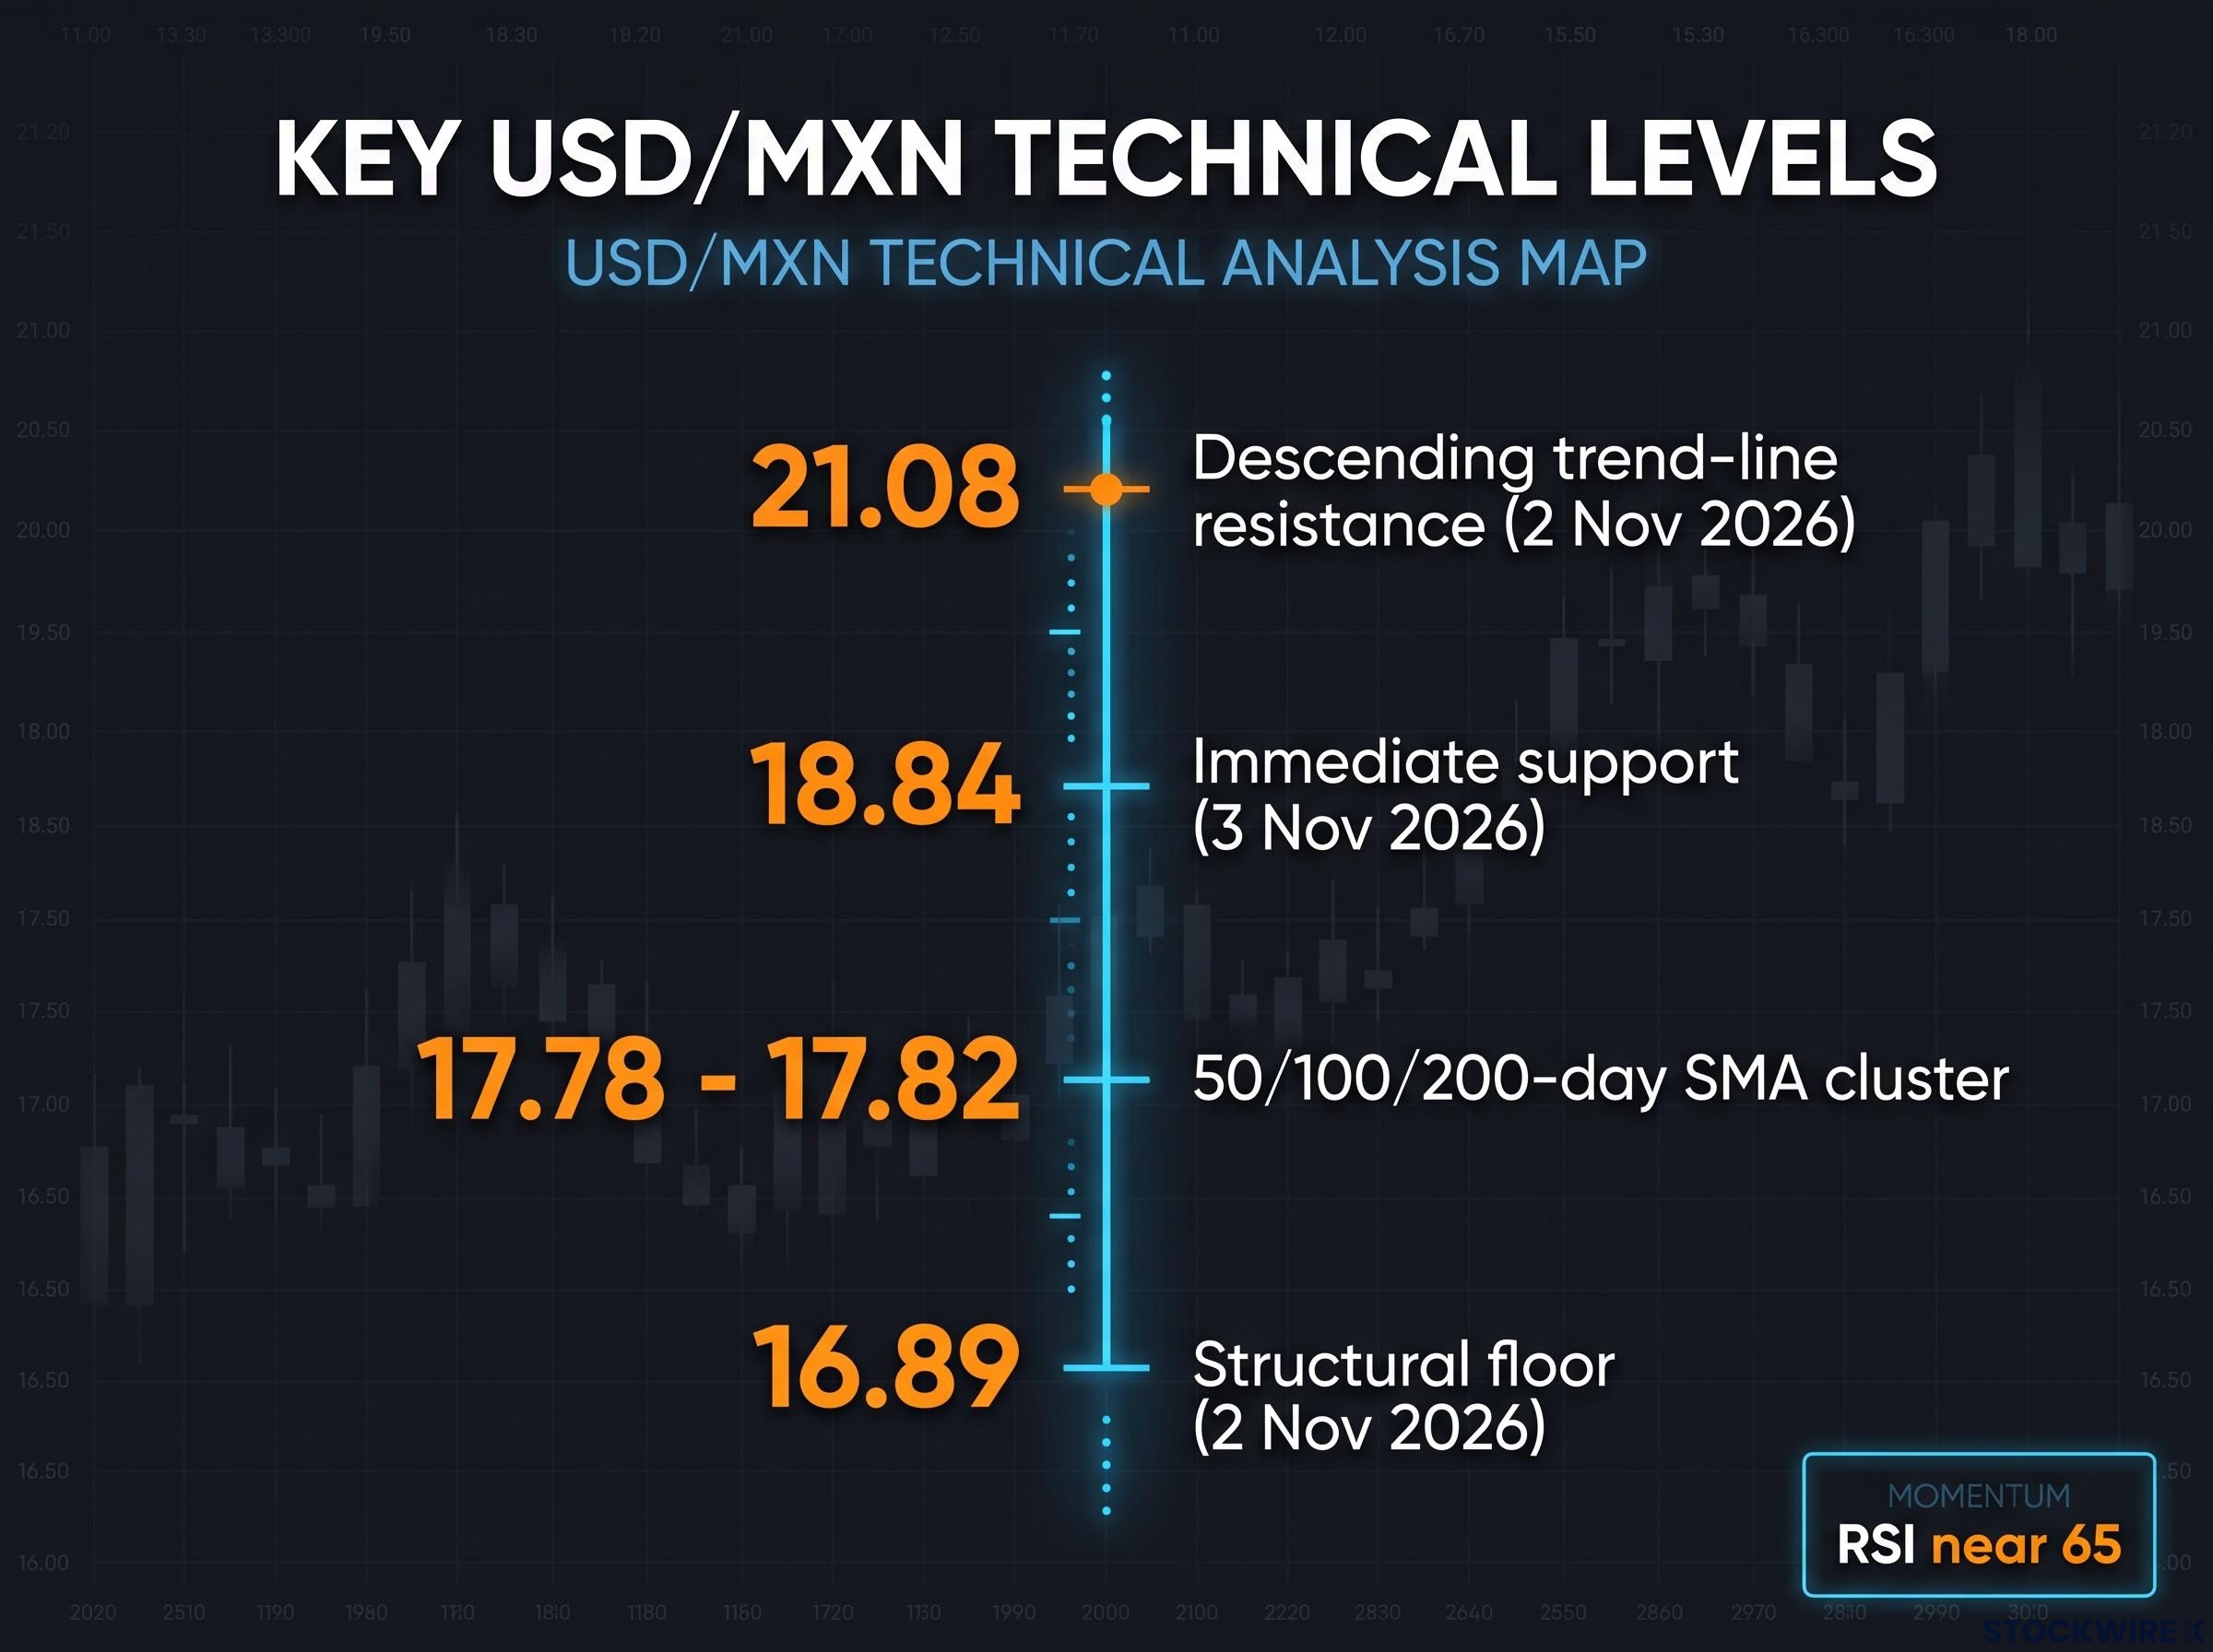
| Feature | Level | Source and date |
|---|---|---|
| Immediate support (latest close) | 18.84 | FXStreet/TMGM, 3 November 2026 |
| 50/100/200-day SMA cluster | 17.78-17.82 | FXStreet/TMGM, 3 November 2026 |
| Structural floor | 16.89 | FXStreet, 2 November 2026 |
| Descending trend-line resistance | 21.08 | FXStreet, 2 November 2026 |
| Shorter-term resistance | 18.41, 18.50, 18.66 | Monex, 6 October 2026 |
| Shorter-term support | 18.20, 18.00, 17.90 | Monex, 6 October 2026 |
Now complicate it. The Monex resistance levels sit below the 18.84 support level, which looks contradictory until you check the dates. They come from a different month and a different horizon, so they form a separate map.
The common traps are worth knowing:
- Levels age quickly: an election gap can make yesterday’s level irrelevant.
- Data feeds differ: spot, fixing and futures give slightly different highs and lows.
- False breaks are common: especially in thin election-time trading.
- Charts show no cause: they cannot tell you whether Banxico, tariffs or politics drove a move.
- Correlations shift: links between oil, US yields, the DXY and the peso change across episodes.
- Round numbers attract orders: 18.00, 19.00 and 20.00 matter regardless of chart patterns.
- Risk management beats precision: position size and stops matter more than any single level.
Moving averages lag. A political headline can move USD/MXN hundreds of pips before they catch up, so read levels as context, not prediction. The charts show you where pressure may build; politics decides whether a level holds.
Structural support versus cyclical shock: edge cases that complicate the peso outlook
Two stories about the peso are both true, just on different clocks.
- Structural support (years): supply-chain integration with the US, nearshoring, large remittances, a positive real-rate differential and deep, liquid markets.
- Cyclical risk (days to weeks): political and constitutional uncertainty, USMCA and tariff risk, a PMI of 49.5, possible carry liquidation and reliance on US demand. Analysts also expect Mexican growth to undershoot the government’s 2% forecast.
A carry unwind could follow a surprise Fed tightening, strong US jobs or inflation data, geopolitical escalation, a Mexican fiscal or constitutional shock, or a sudden swing in election odds.
When good US data hurts the peso
Strong JOLTS and factory orders help Mexican exporters. They can also lift US yields and the dollar, and over short horizons that second effect often wins.
Views also split on the bigger questions. Some see the 2024 premium as a lasting institutional break, others as an overdone one-off. Trade uncertainty may delay investment, or raise Mexico’s value if supply chains shift from Asia. Before judging any forecast, ask whether you mean days, months or years.
Forecasts show how wide the gap between horizons can be: Citi’s peso forecast of 18.20 by end-2026 came after a steep September slide, and remittance and oil export weakness thinned the dollar inflows supporting the currency.
Reading the next peso move: a framework for sorting signal from noise
When the peso moves next, work through it in order. Name your horizon first. Then check Banxico and the rate gap, read risk sentiment and volatility, weigh political and trade expectations, and only then use chart levels as zones.
Remember that every figure here is a dated snapshot, and prediction-market odds belong to a specific moment. Check current data before drawing any conclusion.
The variables worth watching are Banxico’s decision path and inflation against its 2%-4% band, US data and Fed expectations, USMCA and tariff developments, and Mexican institutional news. Each one feeds a different horizon, and that is where your read on the peso will be won or lost.
This article is for informational purposes only and should not be considered financial advice. Investors should conduct their own research and consult with financial professionals before making investment decisions.
These statements are speculative and subject to change based on market developments and company performance.