Jim Bianco spent six years bearish on bonds. Within the past month, the founder of Bianco Research dropped that stance and moved to neutral, with the 10-year Treasury yield sitting near 4.9% on 2 November 2026, according to CNBC.
That timing runs against a common instinct. For many investors, a yield approaching 5% reads as a warning sign, a reason to stay away from bonds or to brace for trouble. Bianco reads the same number as roughly fair value for bond yields, given how fast the economy is growing in nominal terms.
The disagreement comes down to anchoring. Much of the market still measures today’s rates against the 2010-2020 decade of near-zero and even negative yields. Bianco calls that period the anomaly, not the baseline. Judge a 5% yield against that era and it looks extreme. Judge it against growth and inflation and it looks ordinary.
The sections below give you a practical way to test whether a yield is fair. They use the return a coupon locks in, a nominal-growth yardstick and the structure of inflation, then set out the risks that would break the logic.
Why does a 5% yield look like fair value to Bianco?
The surprise is the source. Bianco was bearish from 2020 and even launched a bond fund during those years. He now says he likes bonds for the first time since then.
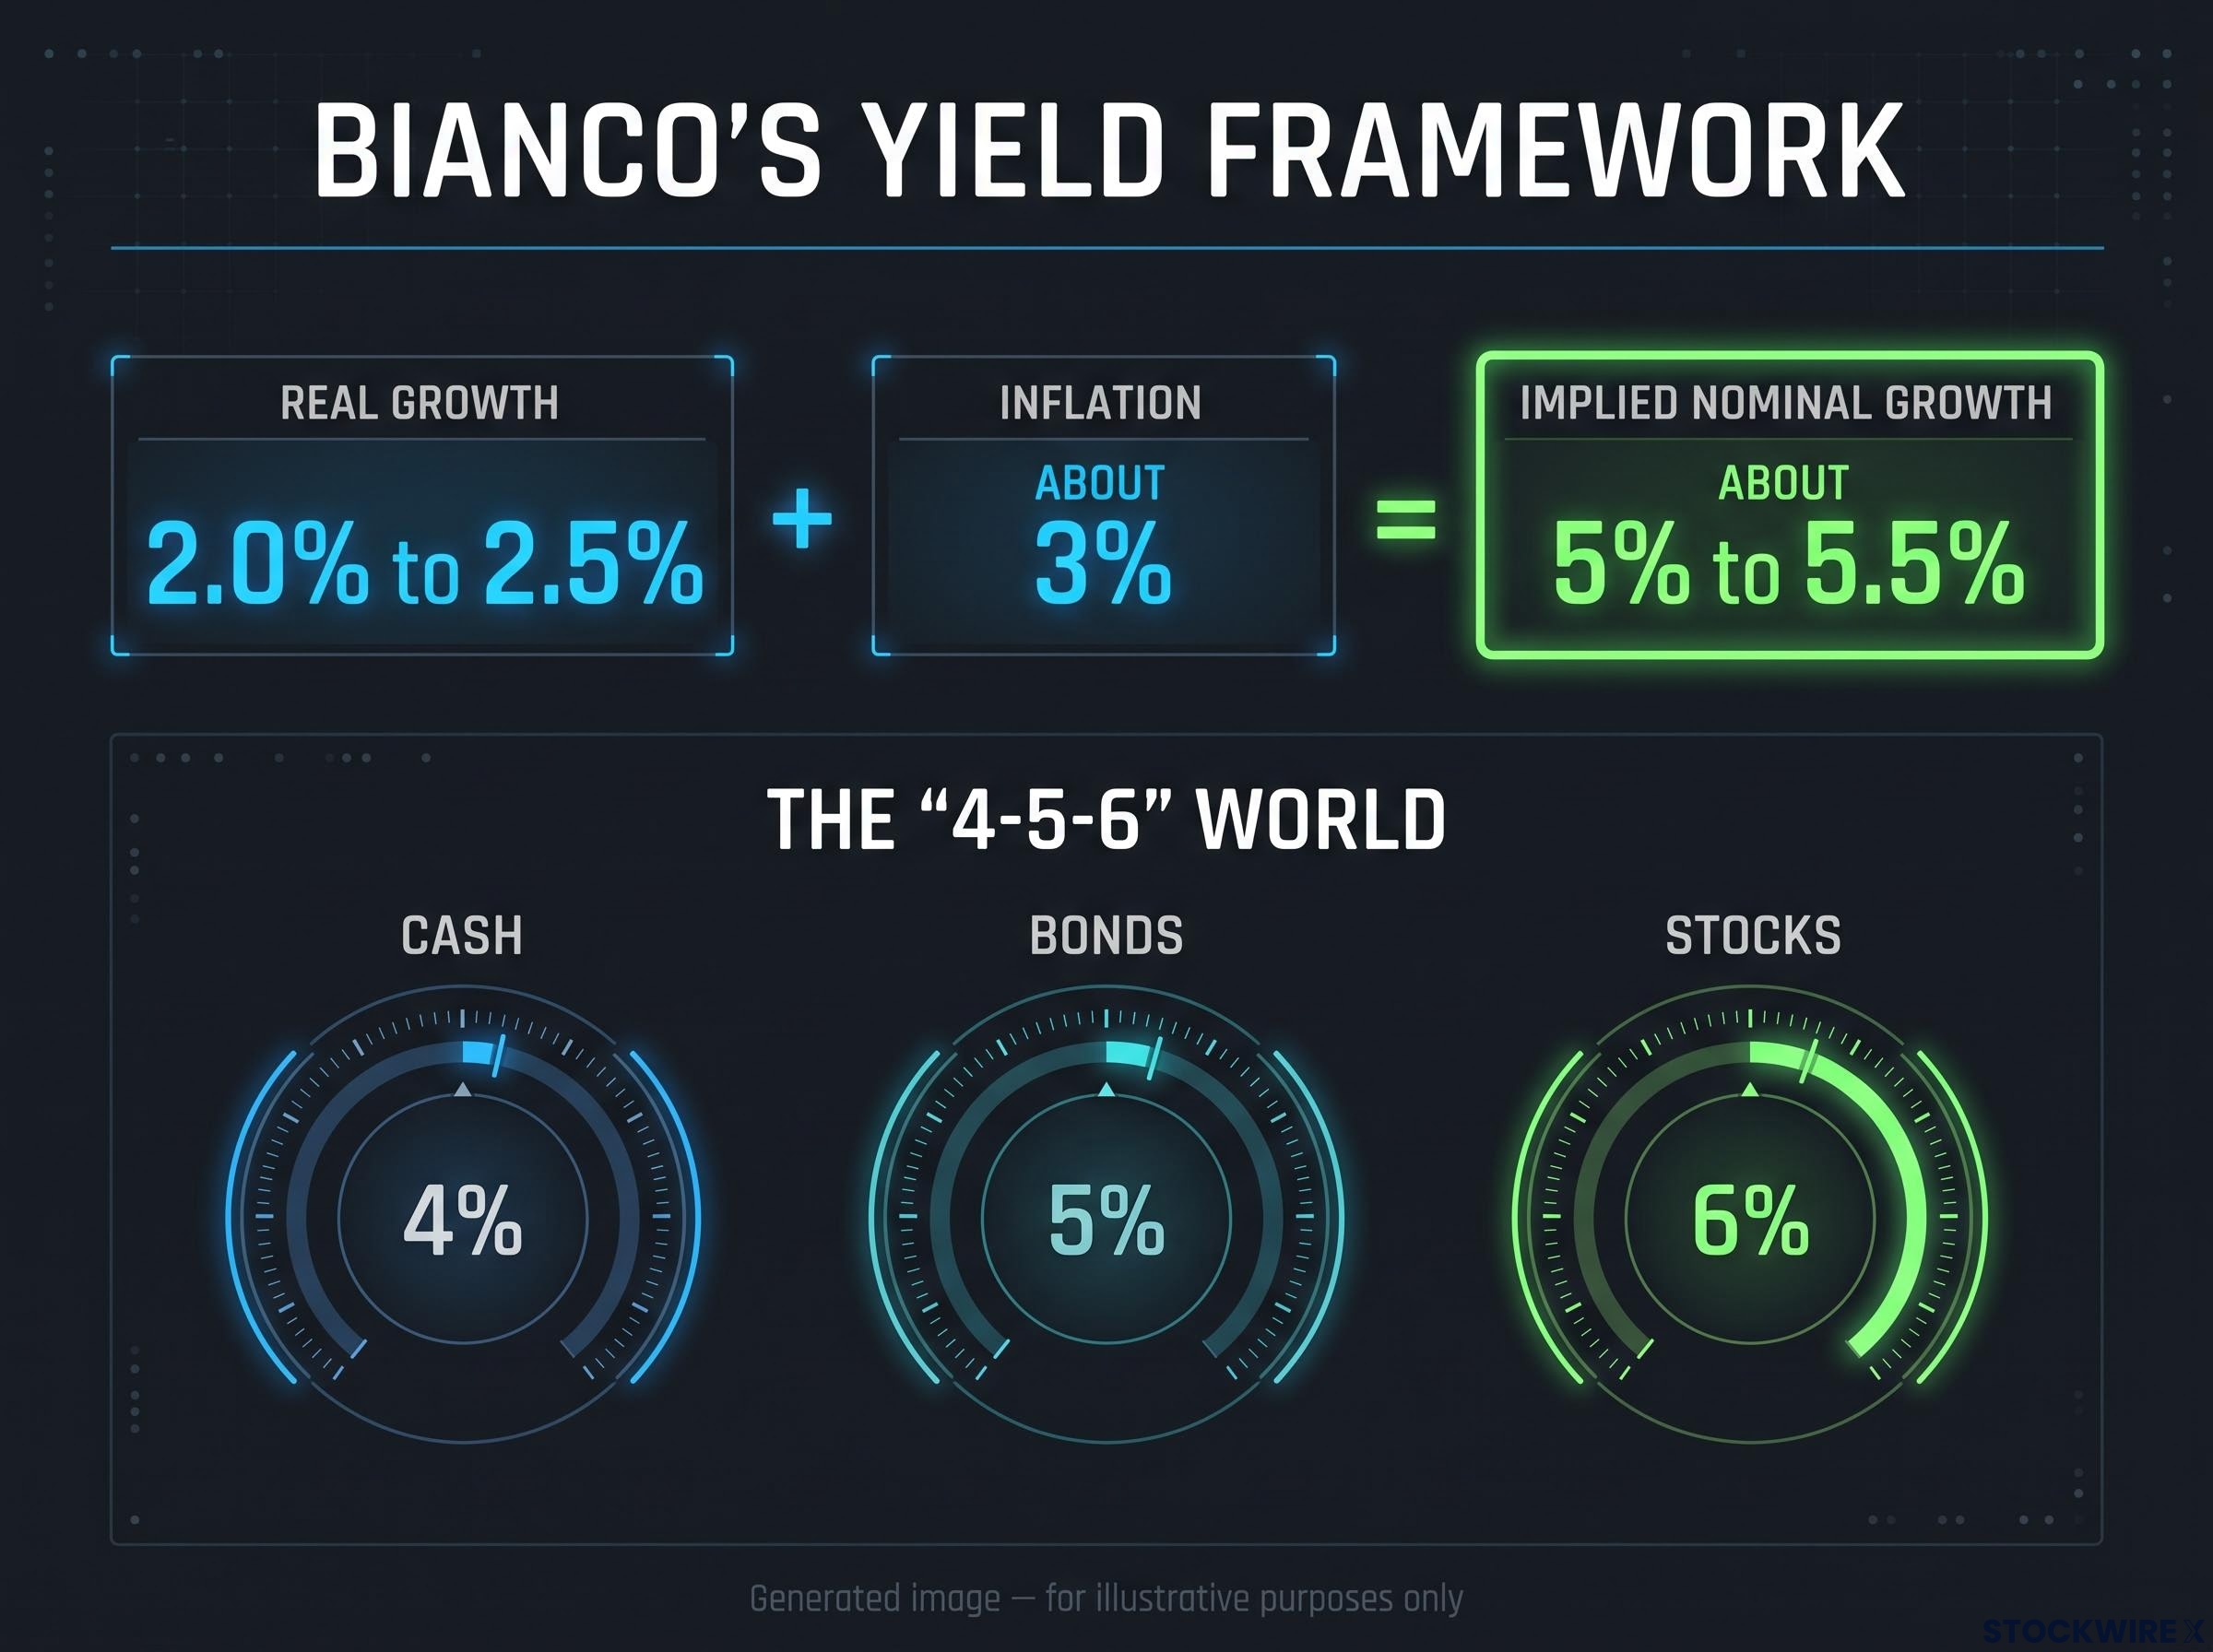
His reasoning starts with a simple rule: interest rates should roughly track nominal growth. Nominal growth is real economic growth plus inflation. Bianco sees inflation near 3% and real growth of 2% to 2.5%, which adds up to about 5% to 5.5%.
The current data fits that range. The Bureau of Economic Analysis (BEA) put real GDP growth at 2.2% at an annual rate for Q2 2026 in its third estimate, released 30 September 2026.
| Component | Figure | Source |
|---|---|---|
| Inflation assumption | About 3% | Bianco |
| Real growth | 2% to 2.5% (Q2 2026 actual: 2.2%) | Bianco; BEA |
| Implied nominal growth | About 5% to 5.5% | Derived |
| 10-year Treasury yield | 4.906% (Tradeweb: 4.924%) | CNBC, 2 November 2026 |
The rest of the curve tells the same story. CNBC had the 2-year at about 4.594% and the 30-year at 5.279%, while Tradeweb showed 4.595% and 5.301%. Bianco adds a ceiling: rates meaningfully above 5% would begin to choke borrowing and activity.
He sums up the regime in three numbers.
The “4-5-6” world Bianco describes a market offering roughly 4% on cash, 5% on bonds and 6% on stocks. In his view, this is the new normal rather than a temporary spike.
Be clear about what the rule is. It is an anchor for judging value, not a law that sets prices. What it tells you is that a 5% yield is neither a bargain nor an alarm. It is about what growth would predict. The one number that challenges it comes from the Congressional Budget Office (CBO). The CBO projects 2.2% growth for 2026 but an average of just 1.8% a year from 2027 to 2036, which would pull the yardstick lower.
Where the rule bends
Yields carry more than growth. They also reflect expected short-term rates, inflation risk, liquidity and the term premium. The term premium is the extra return investors demand for locking money away for longer.
The global bond sell-off has put the term premium at the centre of the debate, with supply, quantitative tightening and a fading safe-haven bid all pushing it higher across several sovereign markets at once.
Brookings’ summary of New York Fed research found that strong demand for safe assets, particularly Treasuries, can hold yields below nominal growth for long stretches. Even so, independent work lands in the same zone. Vontobel‘s 2 October 2026 analysis put 10-year fair value at 4.7% to 5.2% and estimated the term premium at 0.96%, the highest since 2010.
When big ASX news breaks, our subscribers know first
What does a 5% coupon actually earn you?
The fair-value case rests on income, so it helps to see how bond returns work. A coupon is the fixed interest payment a bond makes each year. If you hold a bond to maturity and the issuer is very unlikely to default, the yield you buy at is a close guide to your long-run nominal return.
The logic runs in three steps:
- Buy at a yield. Your entry yield sets the income you will receive.
- Collect the coupon. A 5% coupon pays roughly 5% a year until maturity.
- Yields move. If market yields change, the bond’s price changes, but your coupon does not.
Entry point is everything here. A 10-year bought near 1% locks in very little. One bought near 5% pays about five times the annual income.
| Entry yield | Annual income | If yields rise to 6% | Held to maturity |
|---|---|---|---|
| 1% | Low; locks in a thin return | Large price fall, little coupon to cushion it | Price loss recovers, but return stays low |
| 5% | About five times higher | Price falls; coupon stays at 5% | Price loss recovers; roughly 5% a year earned |
Now the catch. Bonds are marked to market, meaning their price is updated daily to reflect current yields. A long-duration bond bought at 5% can lose far more than a year’s coupon if yields jump to 6%. Duration measures how sensitive a bond’s price is to changes in rates.
Bond duration translates that sensitivity into dollars: a $500,000 position in a duration-17 fund loses roughly $85,000 on a 1 percentage-point rate rise, against about $30,000 for a duration-6 fund.
Holding to maturity erases the price loss, but you still sit through the paper losses and face uncertain rates when you reinvest coupons. Bianco’s own line is clear: value disappears if yields climb another 100 to 150 basis points, to about 6% to 7%, with the economy unchanged. A basis point is one hundredth of a percentage point.
For you, this means a 5% yield gives a much firmer return base than the 2010s offered. It does not stop a long-duration holding from posting negative total returns for years if yields keep rising.
Why could inflation stay near 3% instead of falling back to 2%?
The yardstick only works if 3% inflation is realistic. Bianco’s case starts with history. Core PCE, the Fed’s preferred inflation measure excluding food and energy, averaged 1.7% from 2001 to 2020. Since COVID it has averaged about 3.4%, and the BEA reported 3.1% for September 2026 in its 29 October release.
The low-inflation era had a specific cause. After China joined the World Trade Organization, cheap imports pulled goods prices down while services inflation stayed elevated. Bianco’s figures show the split clearly.
| Measure | 2001-2020 | Post-COVID |
|---|---|---|
| Core PCE | 1.7% | About 3.4% (Sept 2026: 3.1%) |
| Core goods | About -0.5% a year | – |
| Core services | About 2.5% | About 4% |
Seen this way, 2001-2020 looks less like a policy triumph and more like a special circumstance. Bianco points to former Fed governor Daniel Tarullo’s 2017 Brookings remark that the Fed lacks a working theory of inflation. He also links bipartisan support for protecting manufacturing jobs to the harm described in Case and Deaton’s work on deaths of despair.
Six forces now push against a return to cheap goods:
- Tariffs and trade barriers raise the landed cost of imports.
- Reshoring and duplicated supply chains cost more than concentrated global ones.
- Chinese EV restrictions keep the roughly $15,000 Chinese electric car effectively out of the U.S.
- Sticky services, including housing, health care and insurance, are shielded from import deflation.
- Wages and labour scarcity, aided by an ageing population, keep service prices firm.
- Energy and geopolitics could add a sharp oil shock.
Bianco is careful too: he is not forecasting 4% to 6% inflation, nor a fall to 2%.
The case for lower inflation
The counterarguments deserve weight. The CBO cites faster productivity growth as generative AI spreads. The Conference Board sees weaker household demand restraining growth, and supply chains could normalise further.
What this tells you is that fair value depends less on any single print than on whether goods prices can still drag the average down. Bianco’s answer is that they probably cannot.
What would change the call, and which risks matter most?
A neutral view is conditional, so the useful step is stress-testing it. The biggest risk Bianco names is energy.
Bianco’s oil warning A severe Middle East disruption could push oil to around $200 a barrel, in Bianco’s view.
The Conference Board’s 30 October forecast treated sustained $150 oil as a recessionary scenario and expected inflation to stay above the Fed’s 2% target into 2027. That points to stagflation, where weak growth and high inflation arrive together, which is bad news for bonds even in a downturn.
Other pressures stack up. Vontobel estimates rising debt could add roughly 40 to 75 basis points to the term premium over a decade. The Federal Open Market Committee raised its target range to 3.75%-4.00% on 16 September, with minutes published 7 October, keeping policy restrictive. EY’s September 2026 analysis argued Fed independence and fiscal dominance matter more when inflation runs above target.
| Bullish trigger | Bearish trigger | Data to watch |
|---|---|---|
| Clear fall in core inflation | Core inflation near or above 3% | Monthly core PCE |
| Weaker payrolls and demand | More tariffs | Jobs data, trade policy |
| Falling oil | Middle East escalation | Oil price |
| Credible deficit restraint | Rising deficits, issuance and term premium | Treasury supply, term premium estimates |
| Recession lowering expected short rates | Lost confidence in Fed independence | Fed policy path |
Bianco would turn bullish on a slowing economy or substantially lower inflation, neither of which he currently sees. For you, the practical point is that 5% can be fair value and still a poor entry if the term premium rises. These triggers are the signals to monitor before adding or trimming bond exposure.
The cost of being wrong is large: a 6% Treasury yield would push 30-year mortgage rates toward 8% and lift equity discount rates by 100-300 basis points, which is why the 6% to 7% zone matters beyond bonds.
Fair value is a starting point, not a signal to buy
Put the layers together and the picture is consistent. Nominal growth points to about 5%, a 5% coupon locks in far more income than the 2010s offered, and structural forces make 3% inflation a plausible assumption. Neutral means you are being fairly paid, not that bonds are cheap.
Keep four variables in view: core PCE against 3%, the 10-year against the 6% to 7% zone, oil, and the term premium. If they hold steady, the yardstick holds.
The decision for a U.S. investor is relative. With cash near 4% and stocks expected near 6% in Bianco’s framework, bonds at 5% sit in between. Whether they earn a place in your portfolio depends on how much price volatility you can tolerate while the coupon does its work.
For readers deciding how much duration to hold, our dedicated guide to managing a bond portfolio as rates normalise explains why institutions favour the 1-5 year curve.
Past performance does not guarantee future results. Financial projections are subject to market conditions and various risk factors. This article is for informational purposes only and should not be considered financial advice. Investors should conduct their own research and consult with financial professionals before making investment decisions.