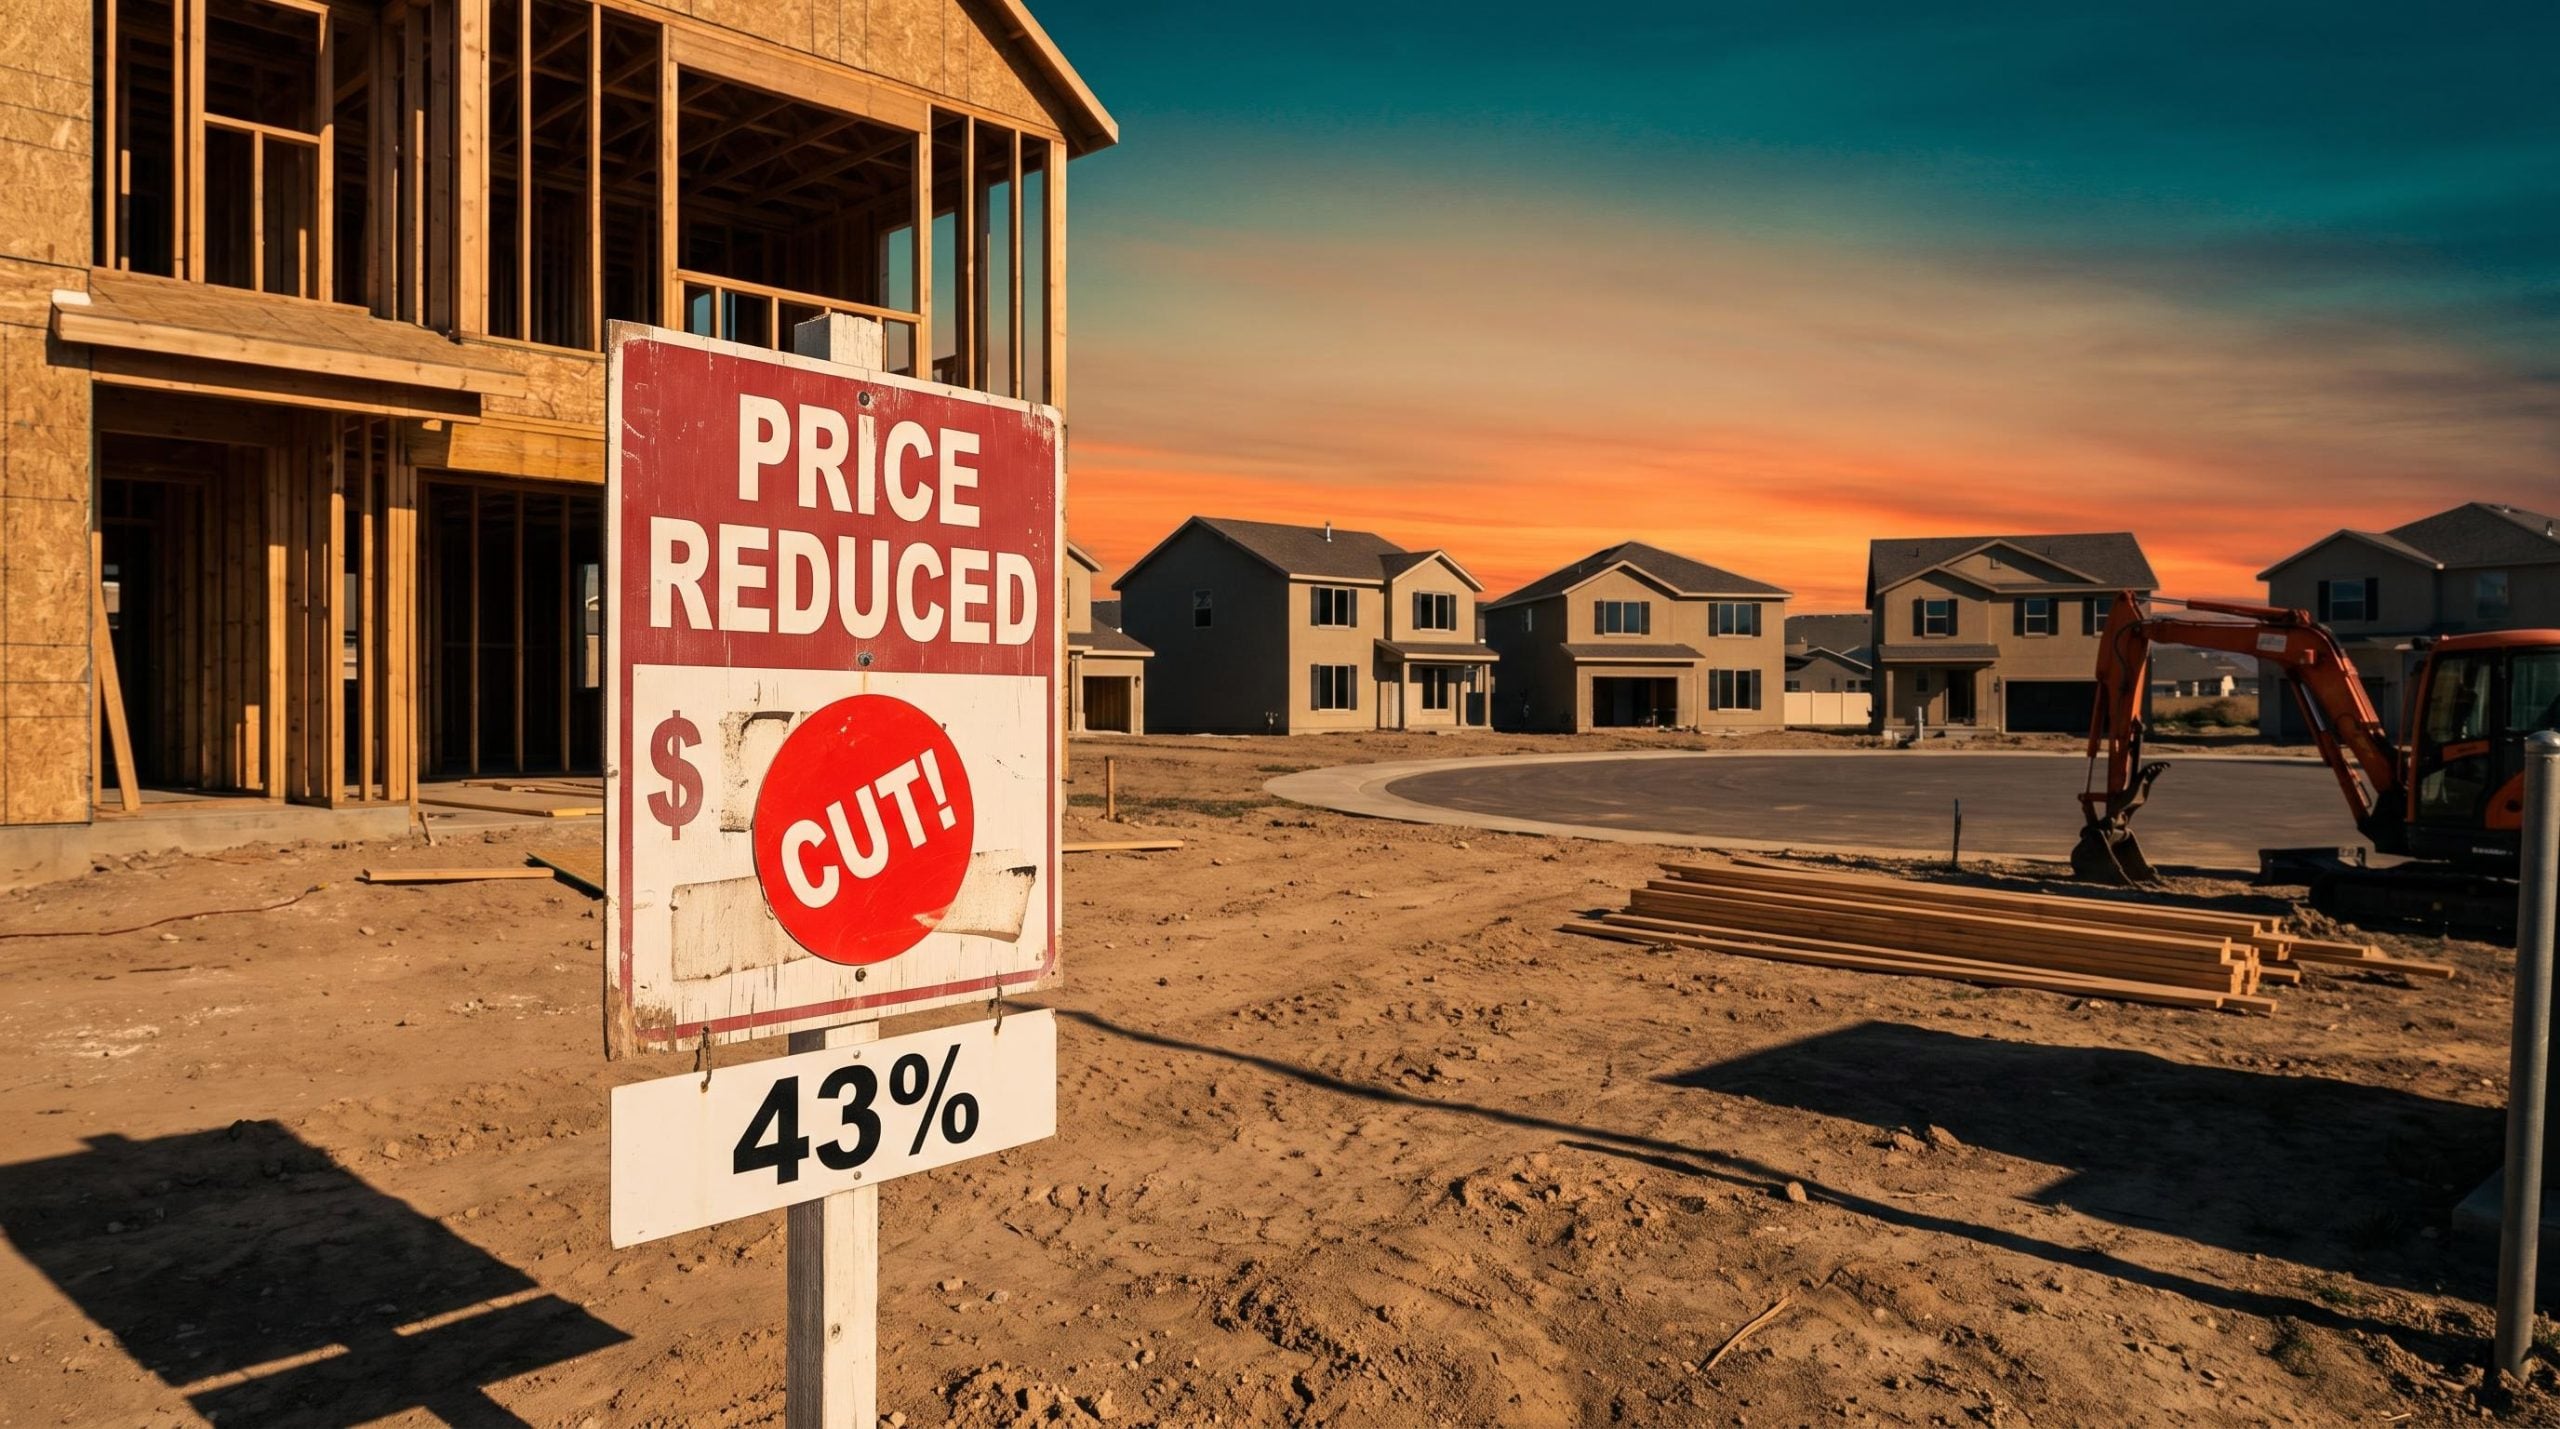
Roughly 80% of new homes in the United States now sell with a mortgage rate buydown. Yet 43% of builders still cut prices in October, according to The New York Times. If incentives were enough to shield homebuilder stocks from high borrowing costs, that second number would be far smaller.
Rates explain the gap. Freddie Mac’s average 30-year fixed rate was 7.32% for the week ending 22 October 2026, the fifth straight week above 7%.
Mortgage rates track long-end Treasury yields more closely than the Fed’s benchmark rate, which is why borrowing costs have stayed above 7% and why builders cannot count on policy easing alone to restore buyer traffic.
Ivy Zelman, co-founder of Zelman, a Walker & Dunlop company, describes the result as a slow grind rather than a crash. The damage is showing up in builder margins and land values, not in mortgage defaults.
Here is how to tell which parts of the sector are structurally exposed, which hold a lasting advantage, and which signals to watch before you commit capital.
Where is the housing slowdown showing up in the numbers?
Start with construction. Housing starts ran at a 1.221 million annualised pace in September, down 7.4% year over year. Single-family starts fell about 4.6% in a month to 859,000.
Sales tell the same story. New-home sales slipped 0.6% in September to 676,000 annualised, 5.3% below a year earlier. Months’ supply, the time it would take to sell current inventory at today’s pace, reached 8.4, well above the 5-6 months considered balanced.
| Measure | Latest figure | Period |
|---|---|---|
| Housing starts | 1.221 million annualised | Sept 2026 |
| Single-family starts | 859,000 annualised | Sept 2026 |
| New-home sales | 676,000 annualised | Sept 2026 |
| Months’ supply | 8.4 | Sept 2026 |
| NAHB/Wells Fargo HMI | 29 | Oct 2026 |
| Prospective-buyer traffic | 18 | Oct 2026 |
Builder sentiment confirms it. The NAHB/Wells Fargo Housing Market Index (HMI), a monthly builder confidence survey where readings below 50 signal poor conditions, sits at 29. Its buyer-traffic gauge is just 18.
Price cuts are spreading 43% of builders cut prices in October, with the average cut holding at 6% (The New York Times, 22 October 2026).
Zelman’s September builder survey showed some of the weakest rates of change in key indicators, and the weakness carried into October. Entry-level buyers have been in recession-like conditions, while move-up and luxury demand eroded as consumer confidence slipped. The Sun Belt, Southwest and Southeast were already down considerably.
Her framing ties it together: the industry is roughly five years into a flat market. With supply at 8.4 months and traffic at 18, buyers are scarce, not just cautious. That means earnings recovery depends on demand returning, not on cost-cutting.
Why cancellations are lower than in 2022
Spec homes, built before a buyer signs, close quickly, so cancellations have risen less than in 2022, when they jumped 40-50% as rates first spiked. Build-to-order builders carry more renegotiation risk and are working to protect their backlogs.
When big ASX news breaks, our subscribers know first
How rate buydowns quietly erode builder margins
A rate buydown is a payment the builder makes to a lender so the buyer gets a lower mortgage rate. The buyer’s monthly payment falls, but the sticker price stays the same.
That sounds painless. It is not. The builder absorbs a financing cost on top of land, labour and materials, and that cost climbs as market rates rise.
Freddie Mac’s weekly survey is the benchmark most builders and lenders reference when pricing buydowns, which is why a fifth straight week above 7% matters for incentive budgets and for the buyers those incentives are meant to qualify.
The buydown maths Buying a rate down 250 bps can cost nearly 900 bps of gross margin, according to Zelman. (A basis point, or bps, is one hundredth of a percentage point.)
Zelman notes one top builder offered incentives worth about 12% of average selling price to reach a 4.99% rate. Builders now cite 5.5% as the buydown target, a sign the tool is reaching its limit.
| Builder | Gross margin | Incentives | Date |
|---|---|---|---|
| D.R. Horton | 20.7% (fiscal Q3 2026) | Buydown 1.6% of price | 21 July 2026 |
| Lennar | 15.8% (17.5% a year earlier) | About 12.0% (Zelman all-in 12.9%) | 17 Sept 2026 |
| PulteGroup | Not found | 10.4%, down 50 bps | 3 Aug 2026 |
| NVR | About 130 bps above Zelman estimate | Not found | 3 Aug 2026 |
Zelman puts aggregate public-builder gross margin at about 20.3%, down roughly 210 bps year over year. Because margin is being traded for volume, steady orders do not prove a builder is healthy. Read incentive levels alongside gross margin every time.
Buydown versus price cut: which costs more?
A price cut hits revenue immediately. A buydown can be cheaper when temporary and targeted, but costlier as rates rise, and it fails if the payment still disqualifies the buyer.
Zelman argues buydowns are losing power above 7%. The counter-view holds that big builders with captive mortgage arms and cheap capital can sustain them, with D.R. Horton’s margin as evidence. Even D.R. Horton management says it needs lower rates, stronger confidence or better traffic before trimming incentives.
Why land prices and land-bank returns face a reset
The margin squeeze does not stay with the builder. It travels upstream.
Land banking is an arrangement where a third party buys and develops finished lots while the builder holds options to purchase them later. The builder pays for that flexibility through a higher lot cost but commits less capital upfront. An unverified July 2026 industry estimate put the option fee at roughly 10-20% of finished-lot value.
The size of the exposure About 500,000 lots are land banked, with roughly $35 billion available or deployed, and the count may have peaked (Zelman, 30 September 2026).
Slower absorption strains that structure. Key pressure points include:
- Single-family starts down 7% year over year in the September survey
- Hard costs (regulatory and impact fees plus development) making up half of developer costs
- Higher diesel prices limiting developers’ margin flexibility
- Builders walking from option deposits and renegotiating terms, though no figure has been quantified
Land prices had decelerated without falling until the latest Zelman survey showed a modest dip in finished-lot prices. Zelman expects a fuller reset, with land sellers and bankers likely forced to concede.
Public builders largely avoid holding land, so first-order losses fall on private equity land bankers and developers. Builders with heavier land-banking exposure already show lower margins. If values reset, option holders can walk while bankers absorb the hit, so check how much land-bank exposure sits behind any builder you own.
Option contracts with non-refundable deposits and mandatory take-down schedules are central to the asset-light homebuilder thesis that short sellers such as Third Point now challenge, since they create fixed-like land obligations when demand weakens.
Why scale wins: how public builders pull away from private rivals
That ability to walk away is one advantage of size. Stacked together, the advantages compound:
- Cost of capital: Zelman estimates a public-versus-private gap of 500-1,000 bps.
- Purchasing leverage: Zelman’s October capital-markets panel highlighted bigger buying power and overhead spread across a larger platform.
- Diversification: national builders can shift capital toward stronger markets while private rivals sit in one metro.
- Funding flexibility: cash flow, revolvers, bonds and multiple lenders keep projects moving when one bank tightens.
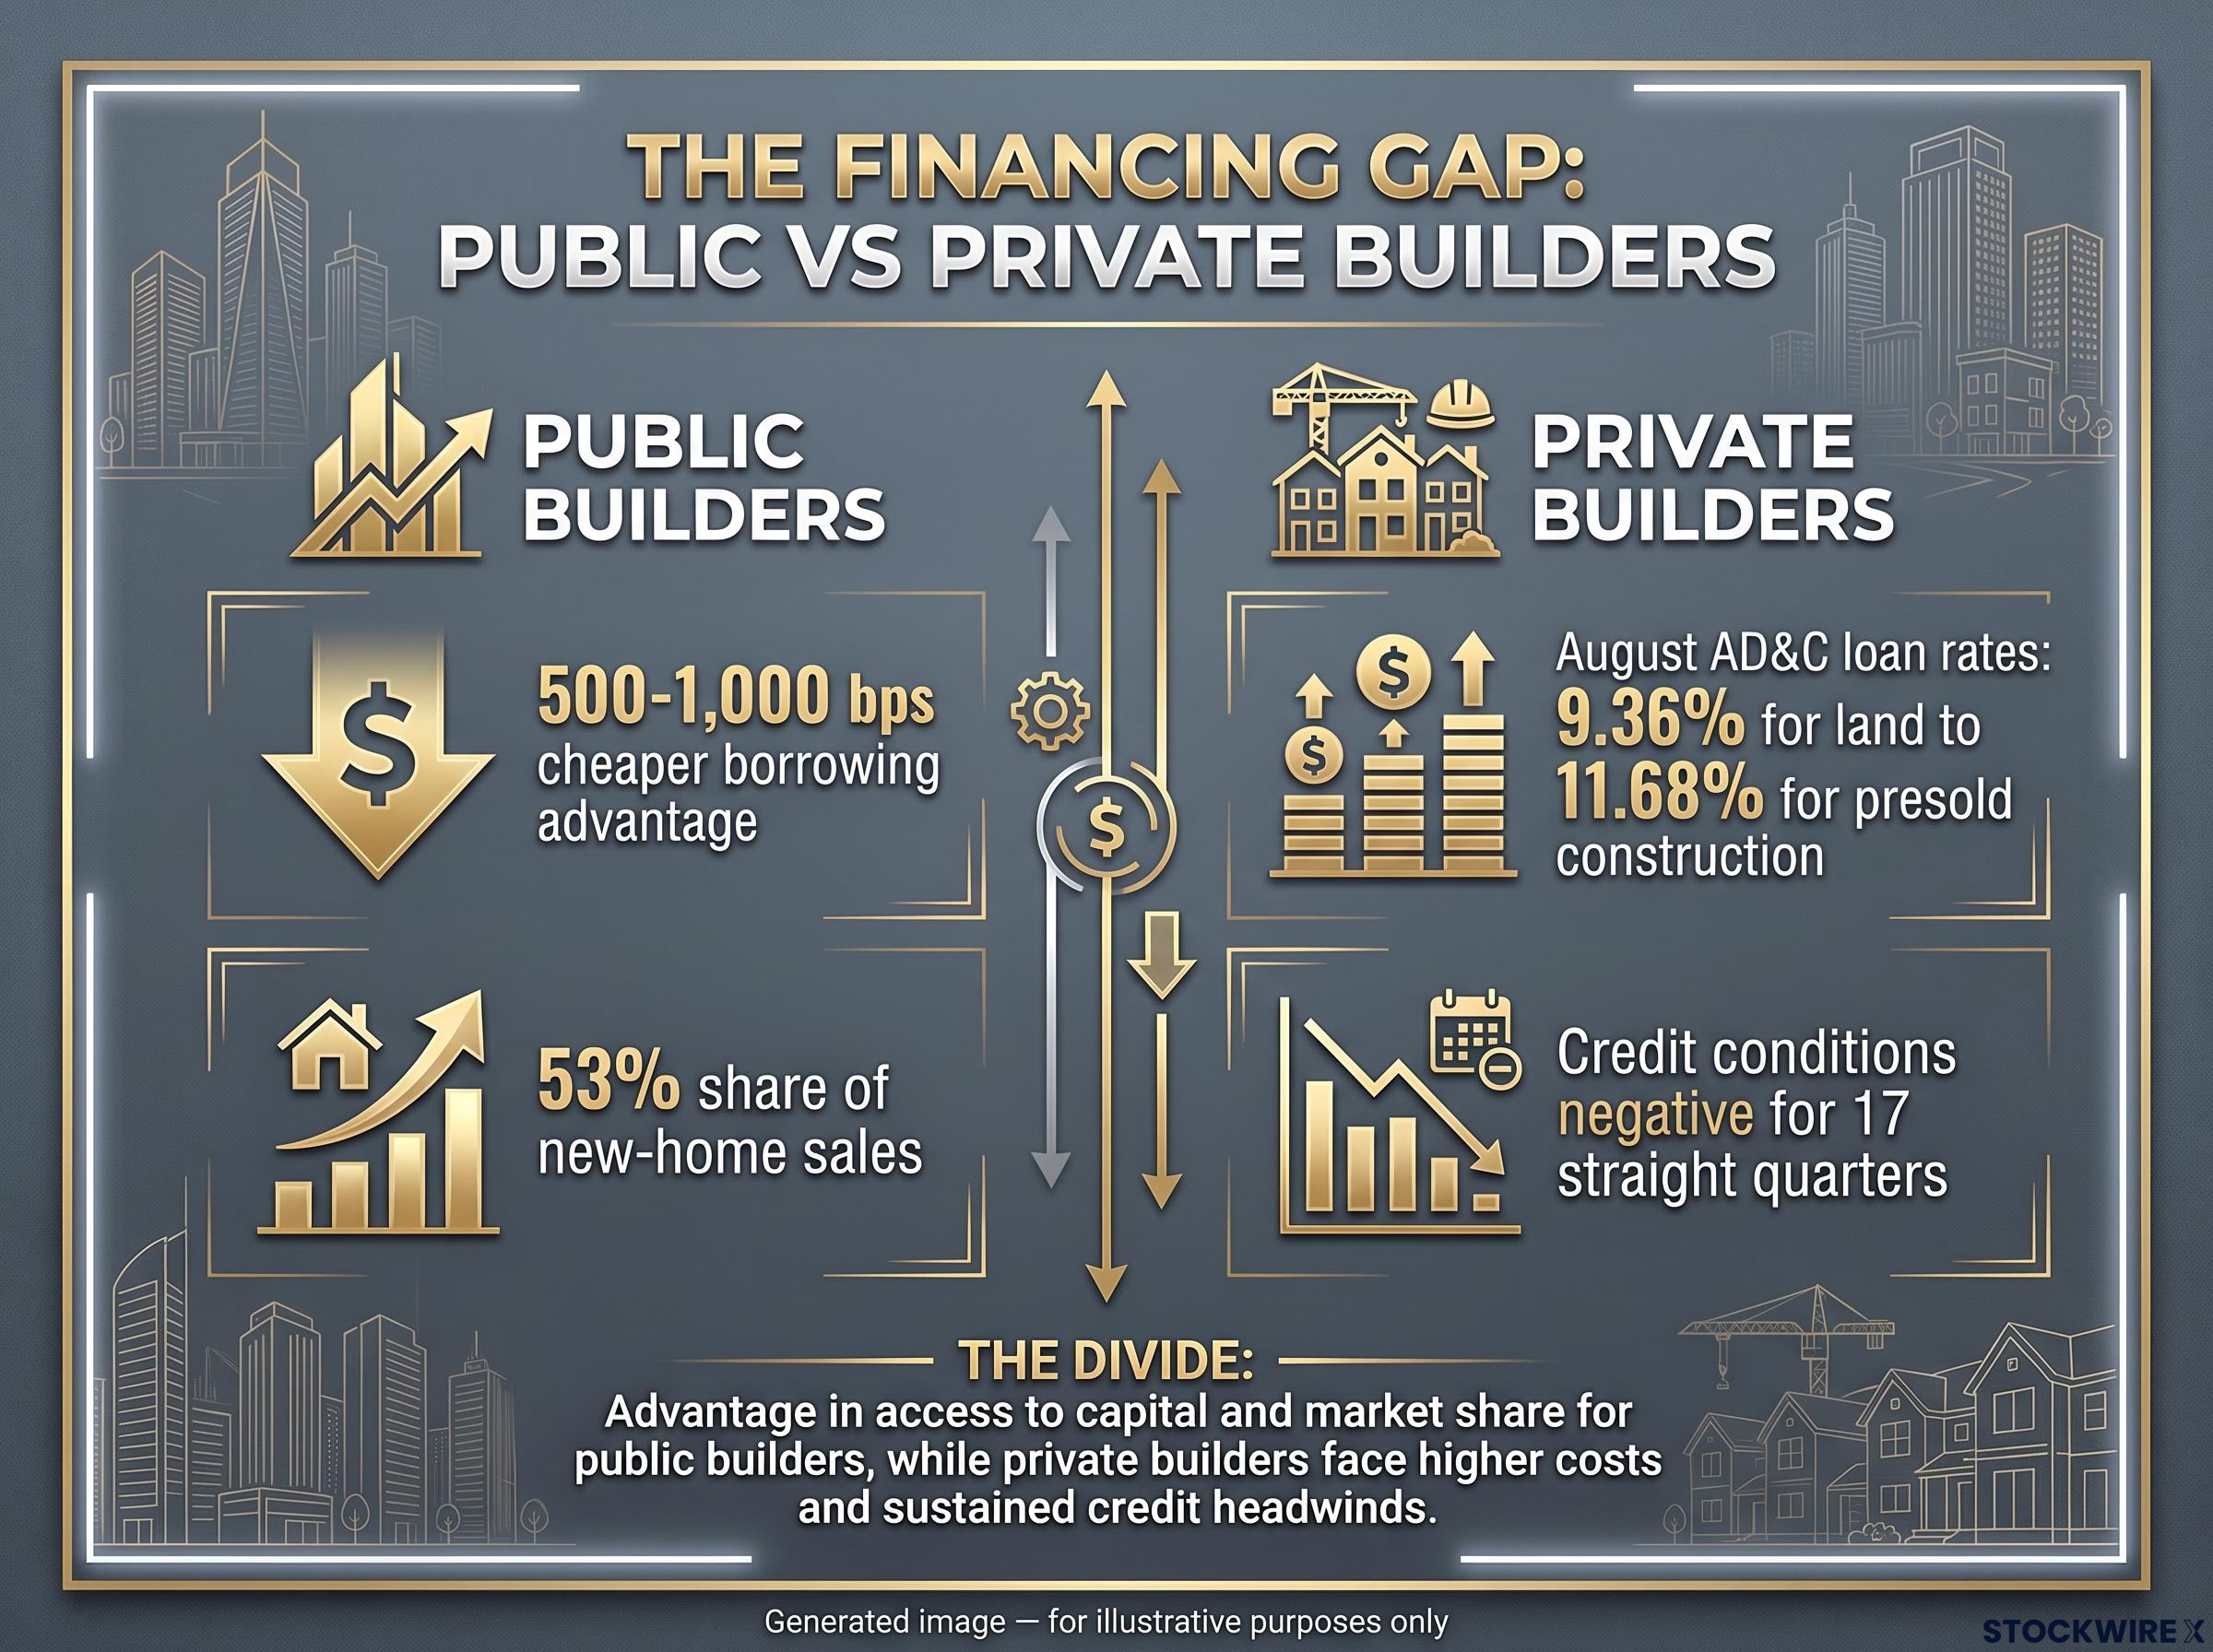
The financing gap Public builders may borrow 500-1,000 bps more cheaply than private rivals, according to Zelman.
Private builders feel the other side. HousingWire, citing NAHB data in August, reported acquisition, development and construction (AD&C) loan rates from 9.36% for land to 11.68% for presold single-family construction, with credit conditions negative for 17 straight quarters.
Public builders already account for about 53% of new-home sales, and Japanese firms plus Berkshire hold about 12%. BuilderOnline found the share of builders approached about a merger doubled from 9% in August 2025 to 18% in June 2026.
Where the scale argument has limits
BuilderOnline also notes that large builders can face friction juggling several lenders, while some small builders run efficiently on one private-credit relationship. No major 2026 private-builder bankruptcy has been identified with primary-source detail. Still, share gains look likelier to accrue to large public builders, which is why you should separate sector exposure from company-specific exposure.
Is this another 2008? The case against a GFC-style crisis
Scale explains who survives a downturn. The bigger question is what kind of downturn this is.
Why the 2007-09 playbook does not fit
Dodd-Frank qualified-mortgage rules, in force since 2014, require lenders to assess repayment ability, and subprime lending is far smaller. Public builders are land-light with lower leverage. Supply is high at 8.4 months, but homes for sale are down year over year and starts are falling, which is not a credit-fuelled overbuilding boom.
| Precedent | What drove it | Lesson for 2026 |
|---|---|---|
| 2022 | Rapid rate spike; cancellations up 40-50% at first | Closest analogue as an affordability shock; builders now more practised with buydowns |
| 2007-09 | Excess leverage, weak underwriting, overbuilding | Tighter lending and stronger balance sheets make a repeat less likely |
| 1980s | Very high rates without a securitised-credit collapse | Points to a prolonged volume downturn, not a financial crisis |
Zelman expects a slow grind with no GFC-style crisis and a downturn entering its sixth year.
What could still make the grind worse
Calibrated concern still requires a watchlist:
- Long-bond yields and national debt
- Labour shortages since late summer, linked to immigration enforcement (Morningstar DBRS)
- Material costs and tariff uncertainty
- Land-bank delays and abandoned options
- Buydown exhaustion forcing permanent price cuts
- Consumer confidence hit by geopolitical events
Because stress appears in incentives, orders and land values rather than defaults, expect a long earnings grind. Size positions for duration, not for a crash.
Selective ownership, not a sector bargain: what the squeeze means for investors
The bull and bear cases share the same evidence and read it differently.
| Case | Core argument | What would confirm it |
|---|---|---|
| Bull | Scale, capital access and share gains, plus operating leverage if rates ease | Falling incentives with margins recovering |
| Bear | Reset may be early; Lennar margin fell from 17.5% to 15.8% with about 12% incentives | Further margin erosion and land-bank write-downs |
Long-horizon money is leaning in: Berkshire Hathaway holds a large Lennar position, and Zelman says a value approach suits long horizons. Morningstar DBRS expected builders in May 2026 to favour capital efficiency, inventory discipline and careful land buying over volume.
A checklist for the entry point
A falling share price alone is not a buy signal. The stronger case arrives when these stabilise:
- Net orders
- Incentives as a share of price
- Gross margin
- Land write-downs
Zelman’s forecast horizon runs into 2027 and beyond. Past performance does not guarantee future results, and projections depend on market conditions. This is analysis, not personalised financial advice.
What the squeeze changes, and what it does not
The slowdown is a margin and land-value grind, not a credit collapse. Scale protects the largest public builders, while private rivals and land bankers carry more of the cost.
Four variables will decide whether the grind eases: incentives as a share of price, gross margin, land-bank activity and the 30-year mortgage rate. Watch them together, since any one alone can mislead.
Patience and selectivity matter more here than timing a bottom across the whole sector.
This article is for informational purposes only and should not be considered financial advice. Investors should conduct their own research and consult with financial professionals before making investment decisions.