The S&P/ASX 200 was up almost 1% within 90 minutes of Wednesday’s open, riding a strong overnight lead from Wall Street technology and AI-linked shares. By the close it had slipped under 3 points to 8,847.30. The turn came at 11:30 a.m., when the September-quarter consumer price index (CPI) landed.
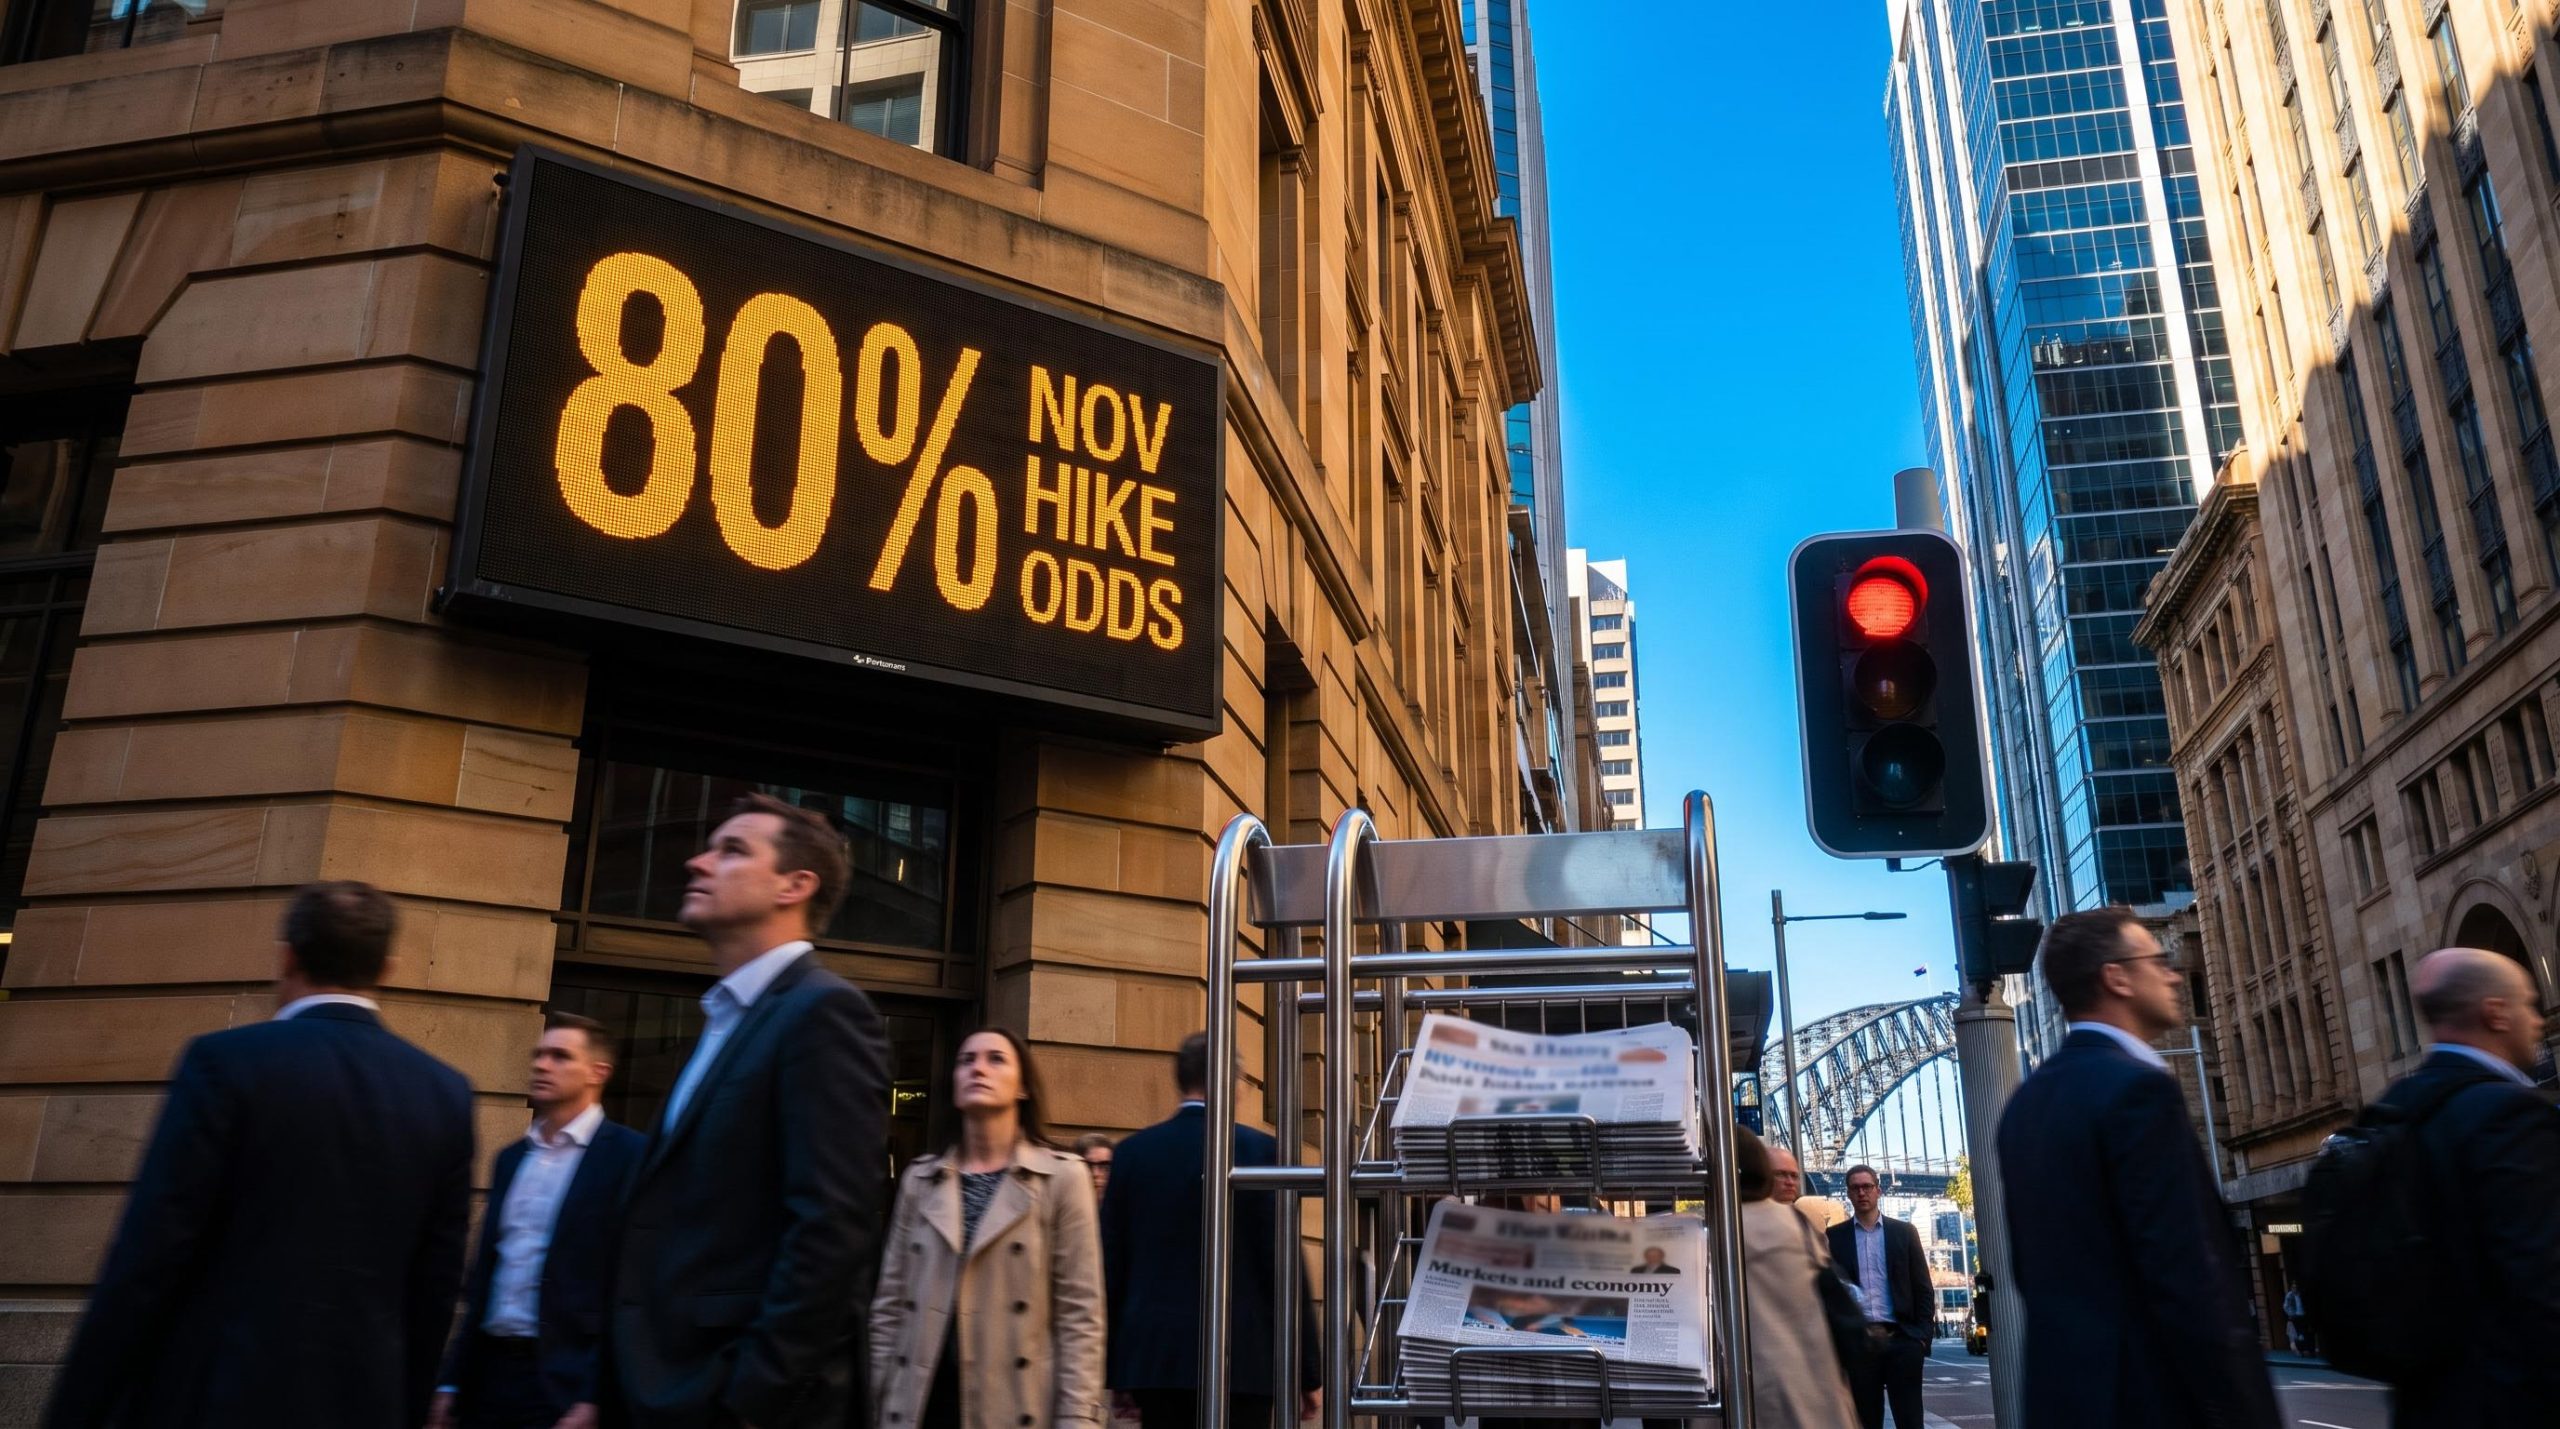
That reversal shows how quickly a rally can be erased when rate expectations move. Market-implied odds of a November RBA rate hike jumped from roughly 56%-60% before the release to about 80% afterwards, with some reports citing 85%.
A move next Tuesday would be the Reserve Bank’s fifth increase of 2026, lifting the cash rate from 4.60% to 4.85%. The RBA’s board meets in less than a week.
Here is what the data tells you: why an inflation print with an in-line core still shifted the market, which sectors and stocks carry the most rate risk, and which dates matter before and after the decision.
What did the inflation data actually say, and why did the odds jump?
The CPI sent two messages at once. The Australian Bureau of Statistics (ABS) reported headline inflation running hotter than forecast, while the trimmed mean, the underlying measure the RBA watches most closely, matched consensus. The trimmed mean strips out the largest price rises and falls each quarter to show the core trend.
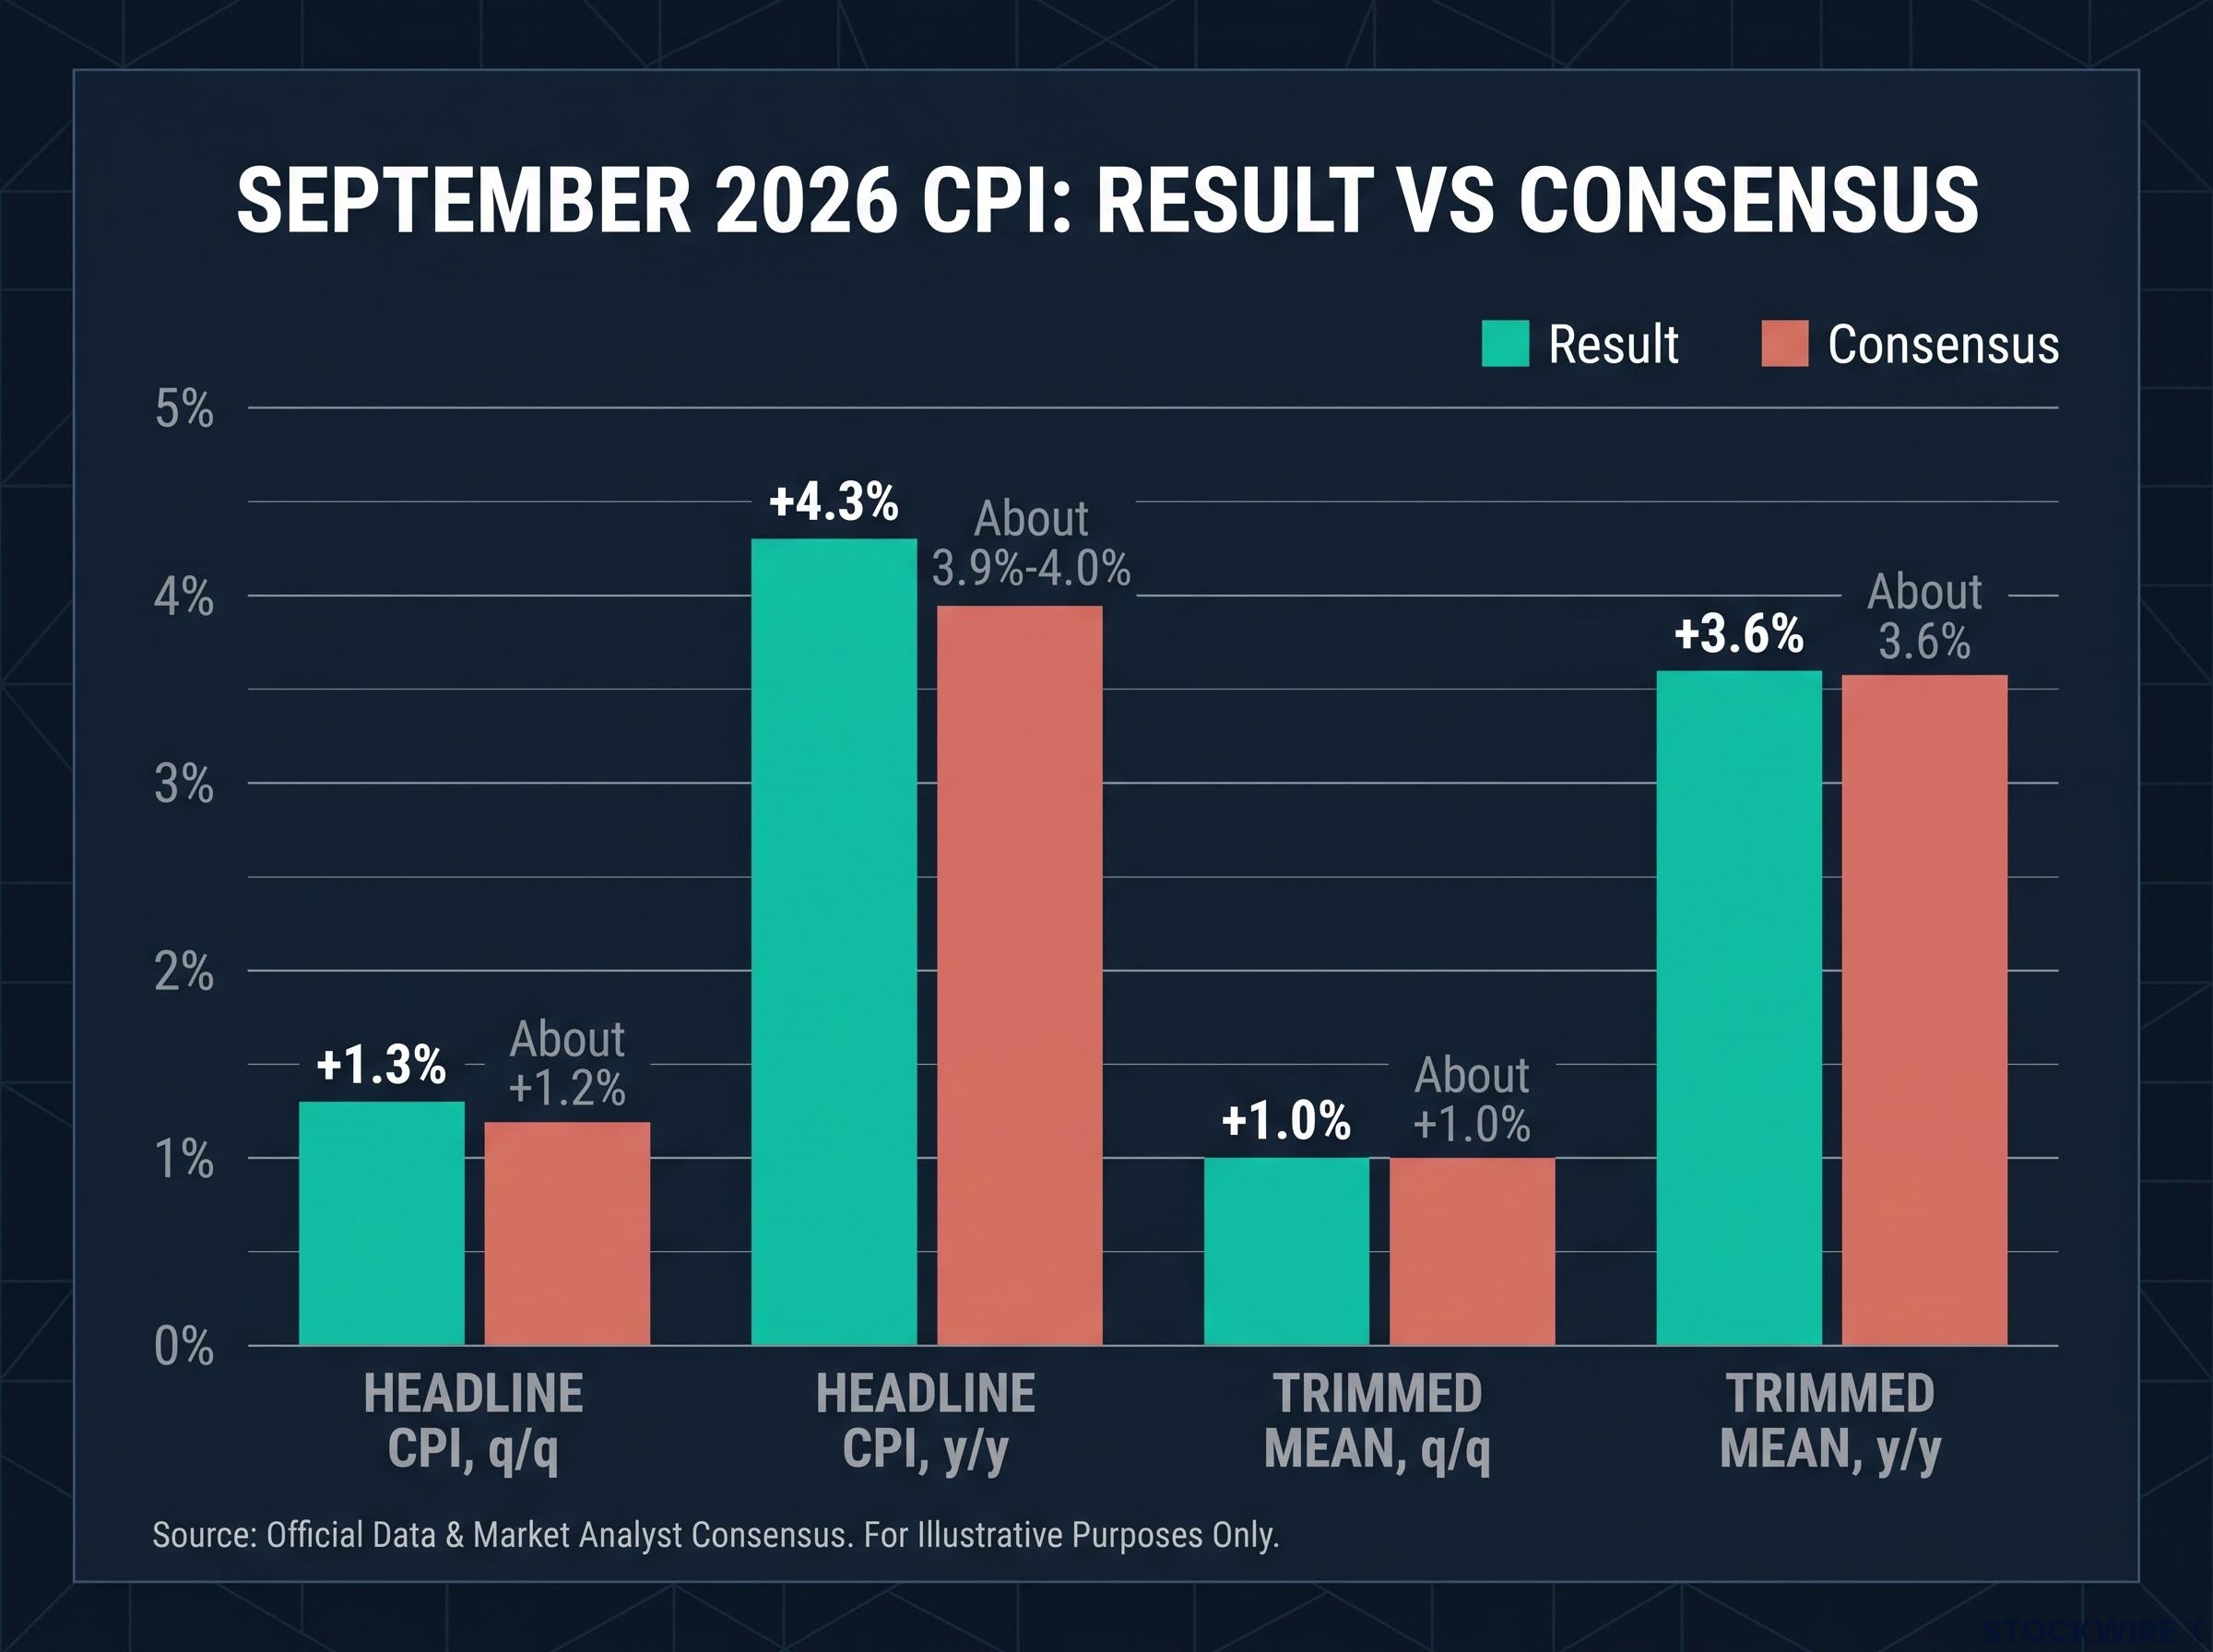
| CPI measure | September 2026 result | Consensus |
|---|---|---|
| Headline CPI, q/q | +1.3% | About +1.2% |
| Headline CPI, y/y | +4.3% (from 4.0%) | About 3.9%-4.0% |
| Trimmed mean, q/q | +1.0% | About +1.0% |
| Trimmed mean, y/y | +3.6% | About 3.6% |
So why did an in-line core number push the odds so sharply higher? Because the ground had already been prepared. RBA deputy governor Andrew Hauser had said the inflation outlook was materially worse than the bank projected in August, and Governor Michele Bullock‘s guidance signalled a hawkish stance until inflation clearly declined. A hot headline then confirmed the warnings.
The RBA’s own forecast for Q3 trimmed-mean inflation sat below 0.83% quarter-on-quarter, so a print of 1.0% left the Board with little room to argue the underlying trend was cooling.
Sources differ on the exact figures: The Conversation reported odds moving from 56% to 80%, the Canberra Times from about 60% to 80%, and the ABC about 85%. The direction is consistent.
The economists split on persistence, not on whether inflation was uncomfortable. Westpac‘s Luci Ellis and ANZ both forecast a November hike, though Ellis did not expect a long run of increases afterwards. CommBank‘s Trent Saunders shifted from a hold baseline to expecting a hike, while NAB had been more cautious before the release.
Temporary shocks versus stickier pressures
The split between drivers decides whether a fifth hike is the last one:
- Volatile: automotive fuel up 9.4% in September and 23.6% over the year; domestic holiday travel and accommodation up 8.0% in the month
- Stickier: housing up 5.2% annually, with new dwellings up 4.7% as builders passed through costs; medical and hospital services up 4.8%; domestic capacity pressures cited by the RBA
Fuel is excluded from the trimmed mean, so the headline overstated the persistent component. One analysis also showed housing inflation easing to 5.2% from 5.7% in August.
An 80% market price is a probability, not a decision. If services and housing stay firm, the cycle may run longer; if fuel and travel fade, November could close it.
When big ASX news breaks, our subscribers know first
How does a rate hike signal travel from CPI to your portfolio?
The chain is simple. Hotter data raises the odds of a higher cash rate, and higher expected rates lift the discount rates investors use to value future earnings. Shares reprice on the expectation, not the eventual decision, which is why Wednesday’s moves happened within minutes.
The mechanism in one line Higher rates lower the present value of future earnings.
Each link then reaches specific parts of the market:
| Sector | Transmission channel | Direction of pressure |
|---|---|---|
| Real estate | Higher mortgage costs, lower borrowing capacity, higher discount rates on property earnings | Negative |
| Retailers | Repayments squeeze disposable income and discretionary spending | Negative (less so for food) |
| Banks | Margin support versus weaker credit demand, arrears and collateral values | Mixed |
| Growth and technology | Long-duration valuations fall as risk-free rates rise | Negative |
REA Group is exposed through listing and transaction volumes, which shrink when borrowing gets dearer. Woolworths sits on the safer side of retail because food spending is far less discretionary than furniture or fashion.
Company news can swamp the rate effect. NEXTDC is long-duration in rate terms, yet its story this week was about power supply, not the cash rate.
Why banks do not follow the simple script
Higher rates can initially widen net interest margins, the gap between what banks earn on loans and pay on deposits. Against that sit weaker loan demand, rising arrears and falling collateral values. The coverage conflicts: the original session data shows financials up about 0.2%, while other reports had them lagging.
The 2022-24 tightening cycle hit housing turnover, discretionary retail, leveraged property vehicles and long-duration tech. The 2026 risk centres on borrowers rolling from fixed to variable rates. Look at your own holdings and ask whether the earnings, or the valuation, depends on cheap money or discretionary household spending.
The 2022 cycle sector rotation showed industrials and energy producing the strongest performers while real estate, technology and consumer discretionary produced almost none, which is a useful template for the current tightening.
Who won and who lost when the rally unwound?
The flat close was a tug of war. The index closed down 0.03%, missing what would have been a fourth straight gain, while the Australian dollar firmed to about 70.3 US cents. Gains in the two heavyweight sectors held the line against falls elsewhere.
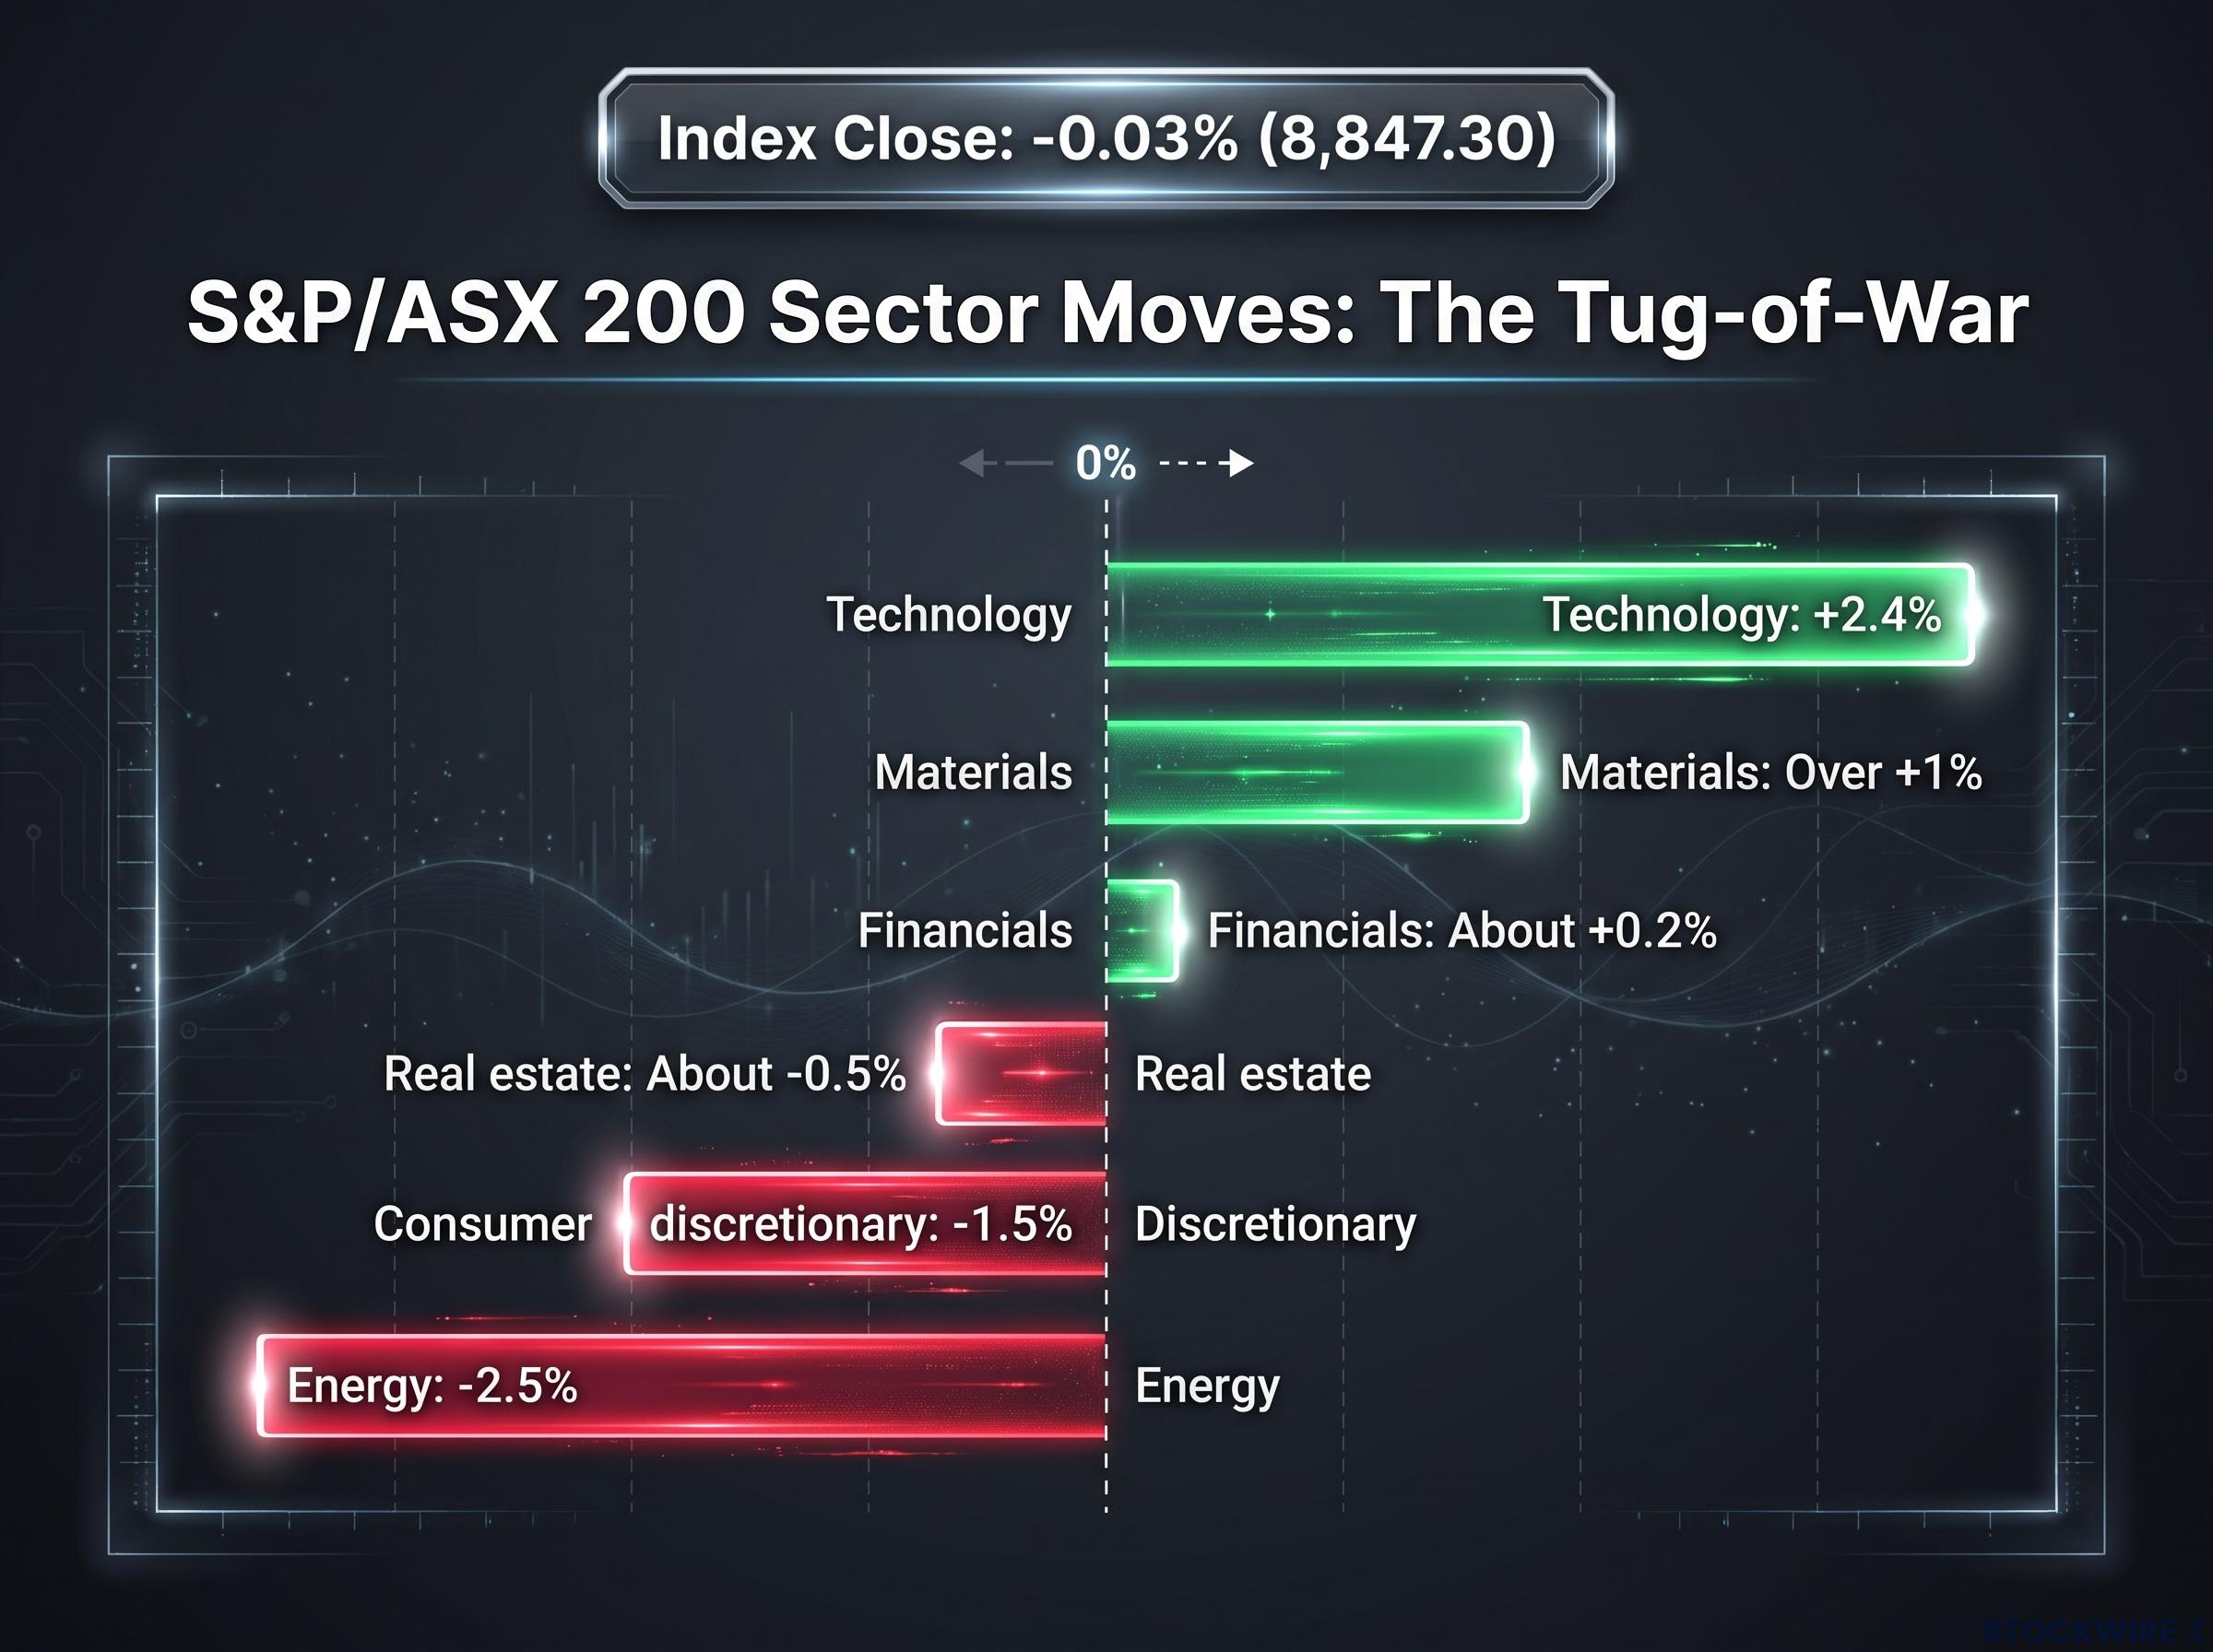
| Sector | Move |
|---|---|
| Technology | +2.4% |
| Materials | Over +1% |
| Financials | About +0.2% |
| Real estate | About -0.5% |
| Consumer discretionary | -1.5% |
| Energy | -2.5% |
Rate-sensitive pressure
- Real estate: up almost 2% before the CPI, finishing about 0.5% lower, the clearest evidence of rate repricing
- REA Group: down about 1.4%, mostly after the release
- Consumer discretionary: down 1.5% as retailers absorbed expectations of another hike
- Woolworths: marginally lower despite quarterly sales up almost 5%
Moves that had nothing to do with rates
- Alcoa: up 8.2% as mineral sands revenue and sales rose
- NEXTDC: up 9.4%, rebounding after a roughly 40% fall the prior week
- Reece: down almost 9% on a broker downgrade
- Woodside Energy: down 3.2% on weaker oil prices
- The Star Entertainment: trading halt after a $260 million Federal Court penalty, between Star’s proposed $100 million and AUSTRAC’s requested $400 million, a day after surging about 13%
Figures conflict for several names. Boss Energy rose about 10% in the original source (about 6.7% elsewhere), PLS Group 3.8% (versus 8.4%), and REA fell 3.9% in other coverage.
A flat index hid heavy dispersion. On a rate-shock day, the benchmark tells you little about your own portfolio, and the RBA should not take the blame or credit for every move.
What could change the picture before and after the November decision?
The week’s calendar
- Wednesday night: the Bank of Canada was broadly expected to hike 25 basis points, though one calendar showed a hold as the base case. The RBNZ had already surprised with a hold, sending the Australian dollar up about 2% against the kiwi.
- Thursday morning (Australian time): the US Federal Reserve is expected to hold. Microsoft is forecast to report fiscal Q1 earnings per share of $4.72 (+14.3%), revenue of $90.1 billion (+16.8%) and capex of about $46.6 billion; Alphabet‘s Q3 result is also due.
- Thursday: AGMs for Woolworths, Challenger, Perpetual, JB Hi-Fi, Super Retail Group and Wesfarmers.
- Next Tuesday: the RBA decision.
- Later, dates unconfirmed: AGMs for BHP, Woodside and CSL.
The retail AGMs deserve your attention. Management commentary may show how household spending is holding up under four hikes already.
The case against a longer cycle
- The underlying quarterly result matched expectations, and fuel sits outside the trimmed mean
- CommBank’s baseline was a hold before the release, and the RBA could judge fuel and travel shocks will fade
- A fifth hike risks weaker consumption, mortgage stress and slower construction
- The odds swing proved sensitive to timing and data provider
Even hike forecasters see limits. Ellis did not expect an unbroken series of increases, though she flagged the risk of a February move had risen.
Treat the 80% pricing as a base case to monitor, not a settled outcome. These statements are speculative and subject to change based on market developments.
The ASX RBA Rate Tracker shows how market-implied probabilities for a November hike shift with each data release, and it is the benchmark to watch when you judge whether the 80% pricing holds or fades.
What the CPI changes for investors, and what it does not
The September quarter raised the odds of a fifth hike without settling whether it is the last. The market’s verdict landed in specific places: property, discretionary retail and rate-exposed names gave ground, while miners, financials and stock-specific stories carried the index.
Your decision point is exposure. Check how much of your portfolio depends on borrowing costs, discretionary spending or long-duration valuations, then read next Tuesday’s RBA statement for any signal that the cycle is ending. The following CPI cycle will test whether services and housing inflation keep pressure on the bank into next year.
Past performance does not guarantee future results. Financial projections are subject to market conditions and various risk factors.
This article is for informational purposes only and should not be considered financial advice. Investors should conduct their own research and consult with financial professionals before making investment decisions.