
Brent crude above $110 a barrel should have been bad news for the yen. Japan imports most of its energy, so expensive oil usually means a weaker currency. Yet USD/JPY slid from 158.68 to below 156.50 last week, with oil still elevated.
Most yen commentary misses this point. The same shock can push the pair in opposite directions, depending on which transmission channel dominates on a given day.
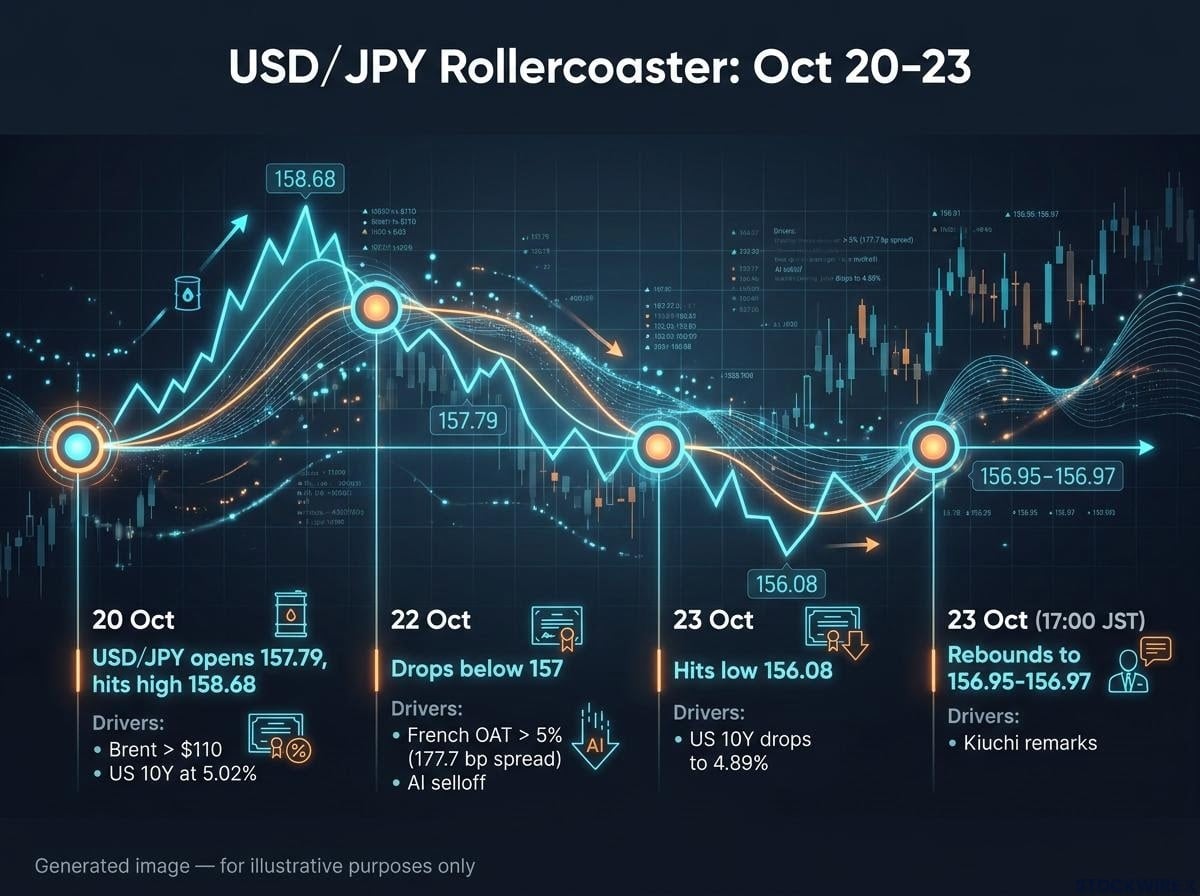
The week of 20-23 October played out in two stages. The pair climbed from 157.79 to 158.68, fell to a low near 156.08, then recovered toward 157. With the Bank of Japan (BoJ) meeting ending on 30 October and a Federal Reserve decision close behind, how you read that sequence shapes any credible USD/JPY forecast.
Here is a working map of the forces that move the yen, the levels that matter, and the catalysts most likely to break the current range.
Why did USD/JPY rally to 158.68 and then reverse in a single week?
Stage one: oil and US rates lift the pair
The week opened at 157.79, and for two days the obvious trade worked. Houthi attacks in Saudi Arabia raised fears of a regional energy supply disruption, Brent pushed past $110, and the US 10-year Treasury yield sat at 5.02% on 20 October.
That combination lifted USD/JPY to its weekly high of 158.68 the same day. Teppei Ino of MUFG traced the rise to higher crude and US rates as Middle East tensions escalated.
Stage two: France, AI stocks and the yen bid
Then the pair changed character. On 22 October, French political turmoil over the 2027 budget pushed the 10-year French government bond (OAT) yield above 5%, its highest since July 2002. The France-Germany spread widened to about 177.7 basis points, the widest since November 2011.
At the same time, AI-related equities fell. Investors bought government bonds, the US 10-year yield dropped to 4.89% by 23 October (official close), and markets priced out more than 20 basis points of Fed tightening.
Three shocks at once Chris Scicluna of Daiwa Capital Markets described the 22 October move as simultaneous anxiety about AI, oil and France, with capital flowing into Treasuries, gilts and Japanese government bonds.
Yen buying from Tokyo trading took the pair below 157, the month’s prior low, and briefly under 156.50 early on 23 October. Reuters recorded a low of 156.08.
The rebound came after remarks from Minoru Kiuchi, Japan’s Minister of State for Economic and Fiscal Policy.
| Date | USD/JPY level or move | Driver | Source |
|---|---|---|---|
| 20 Oct | High 158.68 | Oil, Middle East, US yields at 5.02% | MUFG |
| 22 Oct | Below 157 | French stress, AI selloff | MUFG, Reuters |
| 23 Oct | Low 156.08 | Treasury rally, carry cuts | Reuters |
| 23 Oct | 156.95-156.97 at 17:00 JST | Kiuchi-aided rebound | BOJ table via Reuters |
Yahoo Finance lists a 156.494 close for 23 October, but the BOJ reference cited by Reuters is the more authoritative figure. The lesson is plain: a forecast built on oil alone would have been wrong within days.
When big ASX news breaks, our subscribers know first
How do oil, US rates and risk sentiment actually move the yen?
Oil rose and the yen strengthened anyway. Both outcomes were logical, because the yen responds to several channels at once, and they do not always agree.
- Oil (yen-negative): Higher oil raises Japan’s import bill, worsening the trade balance and lifting demand for foreign currency. Last week, Brent above $110 pushed the pair to 158.68.
- Interest rates (yen-negative when US yields rise): Higher US yields make dollars more rewarding to hold. The fall from 5.02% to 4.89% worked the other way.
- Risk-off (yen-positive): When stocks fall, investors cut leveraged positions and buy yen. The AI selloff did exactly that.
- Intervention (yen-positive near 160): As the pair approaches 160, the chance of official yen buying discourages speculative dollar bets.
The carry trade sits behind the third channel. A carry trade means borrowing in a low-interest currency, here the yen, to buy higher-yielding assets elsewhere. When markets turn, those positions are closed, and repaying the yen loans forces traders to buy yen.
Why oil hurts the yen Lee Hardman of MUFG argues higher oil worsens Japan’s trade balance because the country imports most of its energy, though intervention risk and a softer dollar can cap USD/JPY near 158-160.
Steve Englander of Standard Chartered goes further, warning that another oil shock could push the pair through 160. Reuters commentary noted that last week, falling yields temporarily outweighed Brent above $110.
The yen’s safe-haven role is real but conditional. It works best when a shock lowers US yields; it falters when the shock is an energy crisis that hurts Japan more than the US.
So when you read any yen move, ask first which channel is dominant that day. The same headline can weaken the yen through oil or strengthen it through falling yields.
Is the yen’s weakness structural or cyclical, and where do analysts disagree?
Structural pressure that did not move
Last week’s rally was a cyclical burst. The forces that have kept the yen weak for years were untouched.
The US-Japan rate gap persists. Nomura Asset Management points to capital outflows tied to Japanese overseas direct investment and the Nippon Individual Savings Account (NISA), a tax-free investment scheme that channels household savings into foreign assets. Energy dependence remains. MUFG says a sustained recovery needs continued BoJ hikes and renewed confidence in Japan’s fiscal discipline.
Intervention expectations near 160 add another twist: they can trigger abrupt reversals with no change in Japanese fundamentals at all.
Where the forecasts split
The BoJ policy rate stands at 1.25% and Reuters’ base case is a hold on 30 October, with a December hike kept alive. September inflation ran at 2.1% year on year. Others are more hawkish.
| Source | View | Key condition | Level cited |
|---|---|---|---|
| Reuters base case | BoJ hold, December hike possible | Hawkish guidance | 1.25%; range 155-159 |
| Morgan Stanley | Further BoJ tightening | Hike path holds | 1.50% by March |
| Nomura Asset Management | Range-bound yen | Hikes Oct 2026, Mar 2027, Jul 2027 | Not specified |
| ING | 160 as policy ceiling | Less hawkish Fed, higher Japanese rates for 150 | 160 / 150 |
| MUFG | Reduced risk of further weakness | More BoJ hikes for durable gains | 158-160 cap |
History shows how quickly the regime can flip:
- July 2024: Japan intervened at 161.96, proving official buying can reverse a rate-driven slide.
- 2022 and 2024 carry-trade episodes: Intervention helped unwind yen-funded positions.
- Earlier 2026: The pair hit 160.72 on an oil surge; Mizuho’s Yutaka Miura said a break above 160 was difficult to avoid.
- October 2026 AI selloff: The closest comparator, with yen buying despite Brent above $110.
Given these splits, a single-point forecast deserves less trust than a view built on ranges, triggers and a clear invalidation level.
Which levels and catalysts decide the next USD/JPY move?
Levels to watch
- 160: The intervention warning zone, per MUFG and ING.
- 158.68: Last week’s high, set on the oil spike.
- 157: The pivot, and October’s prior low.
- 156.08-156.50: The weekly low zone from the risk-off flush.
- 155: The level Reuters commentary cited as an intervention target.
The 160 line MUFG expects a move above 160 to bring stronger Japanese and US official warnings and possibly coordinated intervention aimed, according to Reuters commentary, at pushing the pair below 155.
Treat 160 as a risk-management line rather than a target. Upside beyond it carries sharply asymmetric intervention risk.
Catalysts to watch
| Catalyst | Bullish USD/JPY | Bearish USD/JPY | Key level |
|---|---|---|---|
| BoJ, 30 Oct | Hold, no Government Pension Investment Fund (GPIF) reallocation | Hike or hawkish guidance | 1.25% |
| Fed decision | Hawkish surprise | Dovish surprise | US 10-year 4.89%-4.95% |
| Oil, Middle East | Fresh supply shock | Growth damage, risk-off | Brent $110-114 |
| French spreads | Calm returns | Contagion widens | Near 178 bp |
| Japanese inflation | Weak data delays hikes | Strong data brings hikes forward | 2.1% y/y |
ING warns that a BoJ hold paired with no announcement of Japan’s giant pension fund shifting money home could weigh on the yen.
These scenarios are conditional, not predictions. Past performance does not guarantee future results, and projections are subject to market conditions and various risk factors.
What this week’s range does and does not tell you about the next move
Last week showed that no single driver controls the yen. Oil pushed the pair up, then falling yields and risk aversion pulled it down, all within four sessions. Yet the structural backdrop, from the rate gap to outflows and oil exposure, remains intact despite the dip.
The BoJ on 30 October and the Fed decision are the next tests. Between 155 and 159, market drivers likely set the tone; near 160, policy risk takes over.
The sensible approach is to build your view around ranges and triggers rather than one number, and to know in advance what would prove you wrong.
This article is for informational purposes only and should not be considered financial advice. Investors should conduct their own research and consult with financial professionals before making investment decisions. These statements are speculative and subject to change based on market developments.