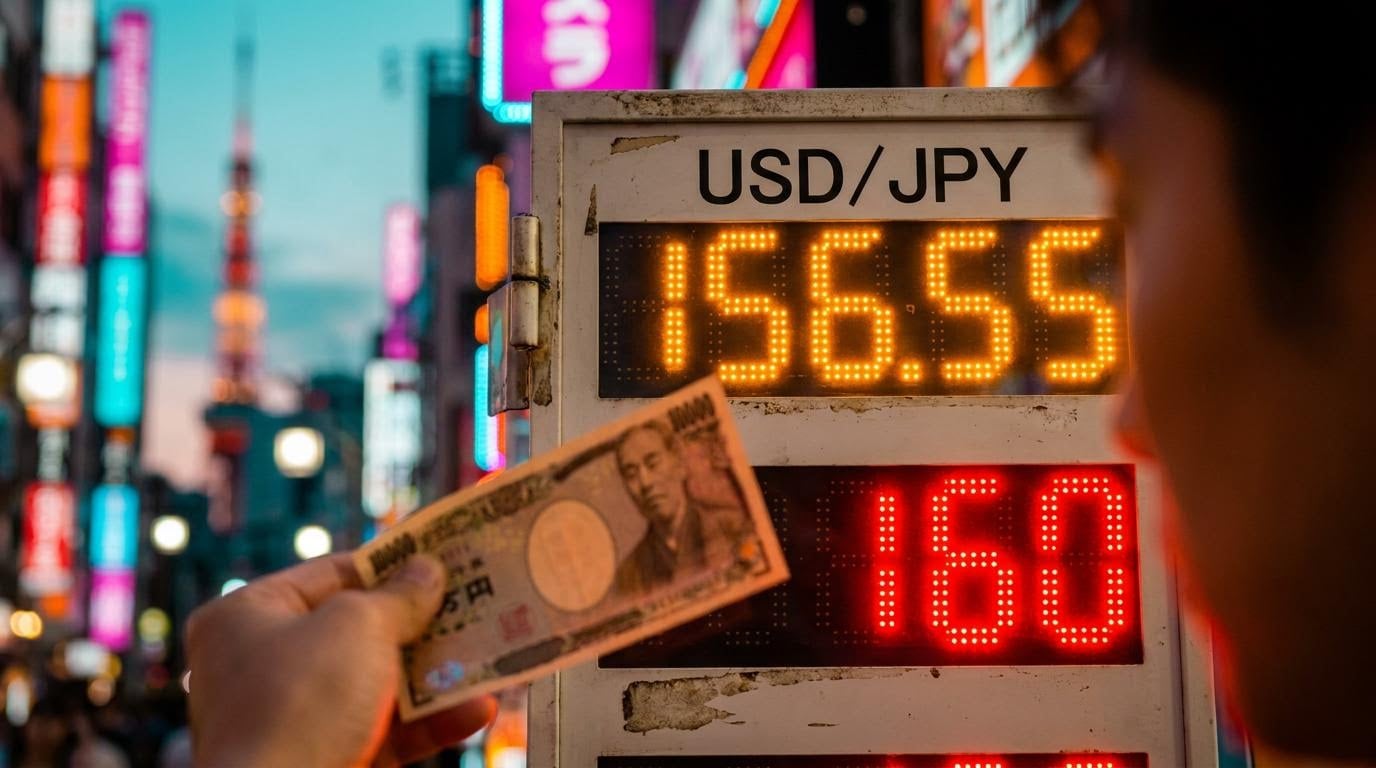
Japan’s core inflation has just printed its firmest reading since December 2025, yet the yen could not hold the gain. USD/JPY bounced off a one-month low near 156.00 on Friday and was trading around 156.55. It was struggling to stay above 157.00, but it was not collapsing either.
That gap between a hawkish data print and a muted currency response is the starting point for any USD/JPY forecast this week. Firmer Japanese inflation does not automatically mean a stronger yen.
Eight days of stacked event risk now sit in front of the pair:
- The Federal Reserve decides on 28 October.
- US Q3 GDP and PCE inflation land on 29 October.
- The Bank of Japan (BoJ) announces its decision on 30 October.
Each event can pull the pair in the opposite direction from the last. If you misread which force is dominant, you risk being caught on the wrong side of a fast move.
Here is what the data tells you about which side of the trade carries more risk, and the price levels that would confirm it.
Why Japan’s September inflation data did not deliver a lasting yen rally
On paper, the numbers looked like a gift to yen bulls. The Japan Statistics Bureau reported that every major inflation measure accelerated in September, and the broadest gauges of underlying pressure moved the most.
| Measure | September | August |
|---|---|---|
| Headline CPI (y/y) | 2.1% | 1.9% |
| Core CPI, excluding fresh food (y/y) | 2.1% | 1.7% |
| CPI excluding fresh food and energy (y/y) | 2.4% | 2.0% (revised from 1.9%) |
The detail that matters is the last row. CPI excluding fresh food and energy strips out the most volatile prices, so a jump to 2.4% shows inflation is spreading into everyday goods and services rather than riding on a fuel spike. (Some early reports put this figure at 2.5%; the latest verified reading is 2.4%.)
The yen rallied in Asian trading. Within hours, the move was fading.
A modest US dollar rebound drew in dip-buyers, and USD/JPY recovered from its low. The data was strong enough to bolster the case for a BoJ hike, but that case was already well understood. A Reuters poll taken on 20-21 October found about 69% of economists (54 of 78) expect the BoJ to lift its rate to 1.50% in Q4, generally read as December.
When a majority already expects a hike, a hot print confirms the forecast rather than changing it. The bigger risk sits on the other side.
A December hike is the consensus outcome, which is why the yen’s reaction stayed muted; a 1.50% policy rate still leaves a wide yield gap to US rates, so tightening alone does not guarantee a sustained recovery.
The cost of waiting Kazutaka Maeda of Meiji Yasuda Research Institute warns that if the BoJ delays its next move until 2027 while US and European rates rise before year-end, yen selling could accelerate.
The short-lived bounce tells you the market had already priced a December hike. For fresh direction, look to the BoJ’s guidance on 30 October, not to the inflation data itself.
When big ASX news breaks, our subscribers know first
Why the yen reacts to inflation as it does: the BoJ’s road from ultra-loose to hiking
Why would rising prices fail to lift a currency? The answer lies in a decade of Japanese policy, and in the gap between what Japan pays savers and what the US pays them.
How the policy history unfolded
The BoJ’s mandate is price stability, defined as inflation of about 2%. For years, Japan struggled to reach it, and the central bank responded with extraordinary measures.
- 2013: The BoJ launched quantitative and qualitative easing, buying government and corporate bonds in large volumes to push money into the economy.
- 2016: It added negative interest rates, meaning banks paid to park cash at the BoJ, and began capping the yield on 10-year government bonds.
- 2022-2023: Other central banks raised rates sharply to fight inflation while the BoJ stayed ultra-loose. The yen lost more than 20% from the start of 2022 through 2024.
- March 2024: With inflation above target, driven by a weak yen, higher energy prices and expected wage gains, the BoJ ended negative rates.
Here is the precedent that matters. The March 2024 hike was widely anticipated and the yield gap stayed wide, so the yen weakened toward 152. That slide prompted an emergency meeting of the BoJ, Ministry of Finance and Financial Services Agency on 27 March 2024.
Governor Kazuo Ueda has since tied further hikes to a rising probability of sustained inflation and an acceleration in trend inflation. September’s data speaks directly to that test.
Strong wage growth matters as much as the CPI print here; July cash earnings rose 4.7% year-on-year and real wages gained for a seventh month, meeting the condition the BoJ set for continued normalisation.
The channels that connect inflation to the yen
Japanese inflation reaches the currency through four routes:
- Rate differentials: Higher US rates support USD/JPY, while expectations of BoJ hikes narrow the gap and support the yen.
- Imported inflation: A weaker yen raises the local cost of fuel, food and imports, which adds pressure on the BoJ to tighten.
- Wages: Inflation backed by rising pay is far more likely to trigger tightening than a temporary energy shock.
- Real yields: The real yield is the interest rate after subtracting inflation. When Japanese rates rise while inflation expectations stay contained, holding yen becomes more rewarding.
Today the BoJ sits at 1.25% against a Fed funds range of 3.75%-4.00%. Even a 25 basis point hike (a quarter of a percentage point) leaves that gap very wide.
You should judge any BoJ hike by whether it meaningfully narrows the differential, not simply by whether it happens.
Fed hike odds, Middle East risk and intervention warnings: what is pulling USD/JPY each way?
That rate gap is the first weight on the dollar’s side of the scale, and US pricing has been adding to it. CME FedWatch now puts the probability of a December Fed hike at about 89%-89.5%, up from 84% on 7 October.
A Reuters poll found 94 of 100 economists expect the Fed to hold on 28 October before hiking later. Fed Governor Christopher Waller has argued more hikes are needed, while Fed Chair Kevin Warsh declined to prejudge the October decision. Escalating Middle East tensions add a geopolitical risk premium, lifting demand for the dollar as a safe haven.
Tokyo is pushing back. Finance Minister Satsuki Katayama warned on 16 October, with the pair near 158, that Japan was ready to act again against excessive yen weakness. FX chief Atsushi Mimura said on 22 October that he remained alert and was not reassured by recent price action.
The threat carries weight because Japan has acted before:
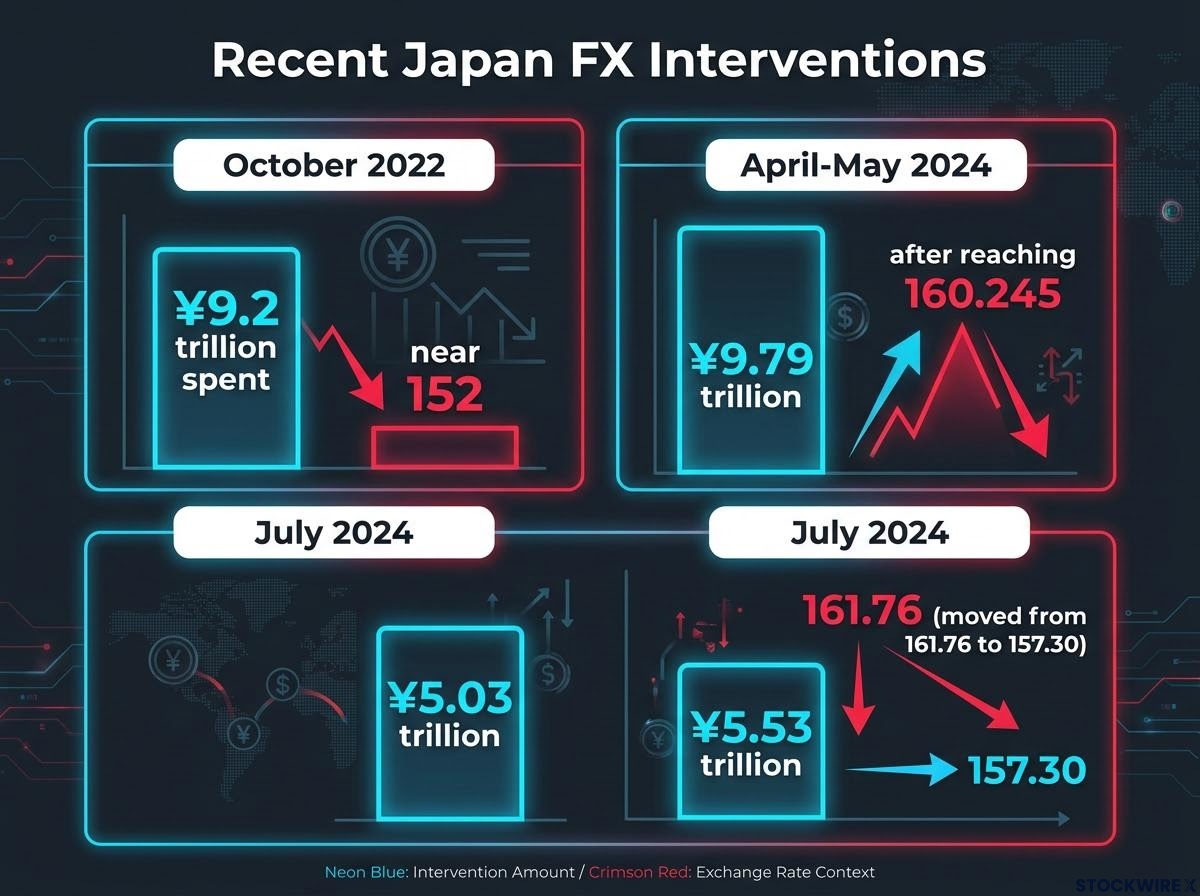
- October 2022: about ¥9.2 trillion spent near 152.
- April-May 2024: ¥9.79 trillion after the pair reached 160.245.
- July 2024: ¥5.53 trillion, moving the pair from 161.76 to 157.30.
- Late July this year: Japan and the US reportedly intervened jointly after USD/JPY moved above 160.
The Ministry of Finance does not publish a threshold. The 160 level is a zone inferred by markets, not an official line.
The reason intervention fades without a change in the rate differential is visible in 2026, when a record ¥11.7 trillion campaign still failed to stop the pair breaking through 160 as carry trade selling resumed.
| Issue | Yen-supportive view | Dollar-supportive view |
|---|---|---|
| BoJ policy | Core above 2% and ex-food-and-energy at 2.4% back a December hike; MUFG sees 25 bp in December and up to 2.00% in H1 2027 | Reuters sources expect an October hold as the BoJ assesses more data |
| Energy and Middle East | Higher import costs could force earlier tightening; Oxford Economics’ Shigeto Nagai sees scope beyond 1.75% | Oil shocks hurt household spending, and the BoJ may treat imported inflation as temporary |
| Intervention | Warnings near 158-160 deter speculation and can trigger sharp drops | Intervention tends to fade without a change in the rate differential |
| Fed pricing | Weak Q3 GDP or PCE could quickly cut hike expectations | A December Fed hike would widen the US yield advantage |
Central bank calendar Fed decision: 28 October. BoJ decision and Outlook Report: 30 October, with markets expecting a hold and December hike risk.
History shows intervention fades unless the rate gap moves. Treat warnings near 160 as a ceiling on spikes, not as a reversal of the underlying trend.
The USD/JPY technical map: levels that will decide the next move
The chart lines up with that balance. According to FXStreet analysis, the pair trades beneath both its 200-day simple moving average (SMA), the average closing price over the past 200 sessions, and the 23.6% Fibonacci retracement. Fibonacci retracements are percentage levels of a prior move that traders watch for support and resistance. Trading below both signals sellers waiting overhead.
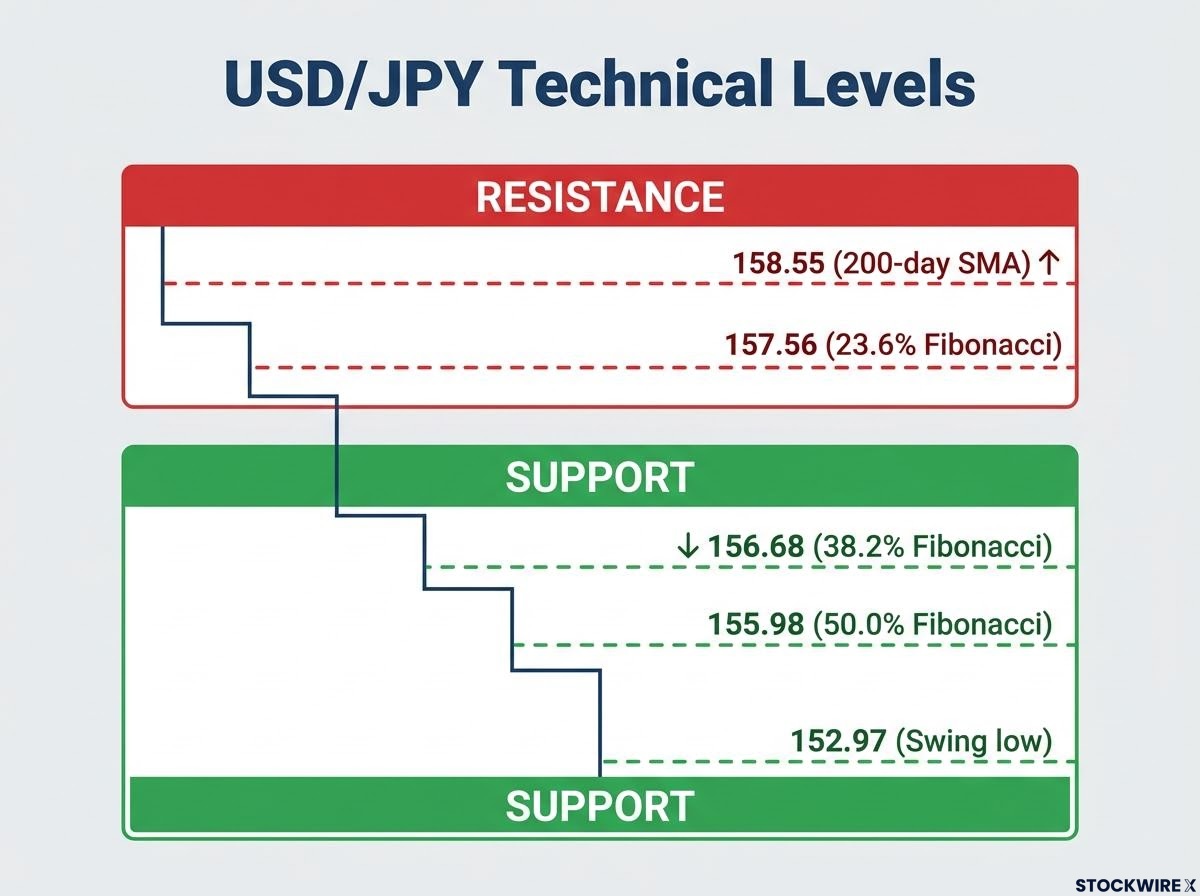
| Level | Type | Price | What a test implies |
|---|---|---|---|
| 200-day SMA | Resistance | 158.55 | A sustained close above would void the bearish bias and bring 159-160 into view |
| 23.6% Fibonacci | Resistance | 157.56 | First hurdle for any post-Fed bounce |
| 38.2% Fibonacci | Support | 156.68 | Immediate floor under current trading |
| 50.0% Fibonacci | Support | 155.98 | A break below 156 opens 155.27 and 154.26 |
| Swing low | Structural support | 152.97 | Distant base if the yen case strengthens decisively |
The scenarios attach cleanly. A BoJ hike signal, intervention and falling Fed odds could push the pair below 157-156. A BoJ hold, strong US data, higher oil and Japanese fiscal worries could revive a run at 159-160, where technical resistance and intervention risk overlap.
The sequence to track:
- 28 October: Fed decision.
- 29 October: US advance Q3 GDP and September PCE.
- 30 October: BoJ decision and Outlook Report.
With the pair under its 200-day SMA, treat a sustained close above 158.55 as the signal that the bearish bias has failed. A single intraday spike is not enough.
Weighing the USD/JPY outlook: what to watch before October 30
The contest is finely balanced. Firm CPI, official warnings and a likely December BoJ hike support the yen. A very wide rate gap, roughly 89% December Fed hike odds and the Middle East risk premium support the dollar.
The terminal rate remains unresolved, with BoJ research placing Japan’s nominal neutral rate between 1.1% and 2.5%, which is why forecasts for 2027 range from 1.75% to 2.00%.
Three variables will decide which side wins:
- The Fed’s tone on 28 October.
- Whether US GDP and PCE on 29 October confirm or undercut hike pricing.
- The clarity of the BoJ’s December guidance on 30 October.
The 160 area remains an inferred risk zone rather than an official line, and the technical levels give you the triggers. If the BoJ leans clearly towards December while US data softens, the case for a break below 156 strengthens. If not, the dollar’s yield advantage keeps the pressure pointed higher.
This article is for informational purposes only and should not be considered financial advice. Investors should conduct their own research and consult with financial professionals before making investment decisions. Past performance does not guarantee future results, and forecasts are subject to market conditions and various risk factors.