Rising oil and a fresh round of Gulf attacks sound like the perfect setup for precious metals. Yet the silver price slipped for a second straight session on 21 October, with spot silver (XAG/USD) trading near $57.25 an ounce, down about 1.1%. The forces you might expect to lift it are the ones pushing it lower.
The reason sits with the US Federal Reserve. Policymakers meet on 27-28 October, and markets are pricing a strong chance of a hold next week, followed by a very likely rate hike in December. Higher oil feeds that hike expectation, and silver pays you nothing while you wait.
If you only follow the headlines, you could easily misread this move. “Oil up, war risk up” points one way. The rates market points the other, and right now the rates market is winning.
Here is the chain of cause and effect, from an oil shock in the Gulf to the number on your silver chart, along with the specific signals that would change the picture.
Why did silver fall for a second session?
The price move
Start with the screen. Spot silver traded near $57.25 during the European session yesterday, according to FXStreet analyst Akhtar Faruqui. TradingEconomics had it drifting toward $57.50, while FXStreet’s earlier report on 19 October placed it near $57.60.
Those small gaps reflect different timestamps, not disagreement. The direction is what counts: two sessions down, with every major source tying the decline to oil and the Fed.
The oil and geopolitical triggers
Three separate supply shocks landed within days of each other. Read together, they form one story about energy risk.
| Event | Date | Market relevance |
|---|---|---|
| Houthi-claimed attacks on Saudi Aramco sites, including a drone strike on the Shaybah oilfield | 18 October (reported) | Raised fears over Saudi output, though material damage to Shaybah production was not confirmed |
| Ukrainian drone wave hitting Russian facilities, including a St. Petersburg terminal | 18 October | Kpler estimates the terminal handles about 120,000 bpd of refined products; damage extent unclear |
| Stalled Iran-US talks over the US naval blockade of Iranian ports | Ongoing | No breakthrough kept supply risk elevated until talks revived |
Iranian Foreign Minister Abbas Araghchi said on Wednesday that Washington must lift the blockade and show genuine commitment to diplomacy before Tehran returns to the table. By then, Brent had climbed to $110.85 (up 1.9%) and WTI to $99.95 (up 2.2%) on 21 October, according to The Edge Malaysia.
The Fed added fuel. Chair Kevin Warsh offered no guidance last week on whether more hikes are needed, and CME FedWatch showed about an 84% probability of no change in October.
Warsh’s decision to offer no forward guidance concentrates repricing risk into single speeches and data releases, so inflation prints now matter more than Fed signals for rate expectations.
Then oil reversed. BusinessDay reported Brent near $98.30 and WTI near $89.49 in Asian trading today as US-Iran talks revived. Those figures come from a different session and possibly different contracts, so the gap is a timing issue, not an error.
That swing tells you the silver price is trading headlines day to day. A single session’s fall is weak evidence of a trend.
When big ASX news breaks, our subscribers know first
How do oil prices and Fed hike bets pressure a metal that pays no yield?
The transmission chain
The link between a drone strike and your silver position runs through five steps. Each follows from the one before it.
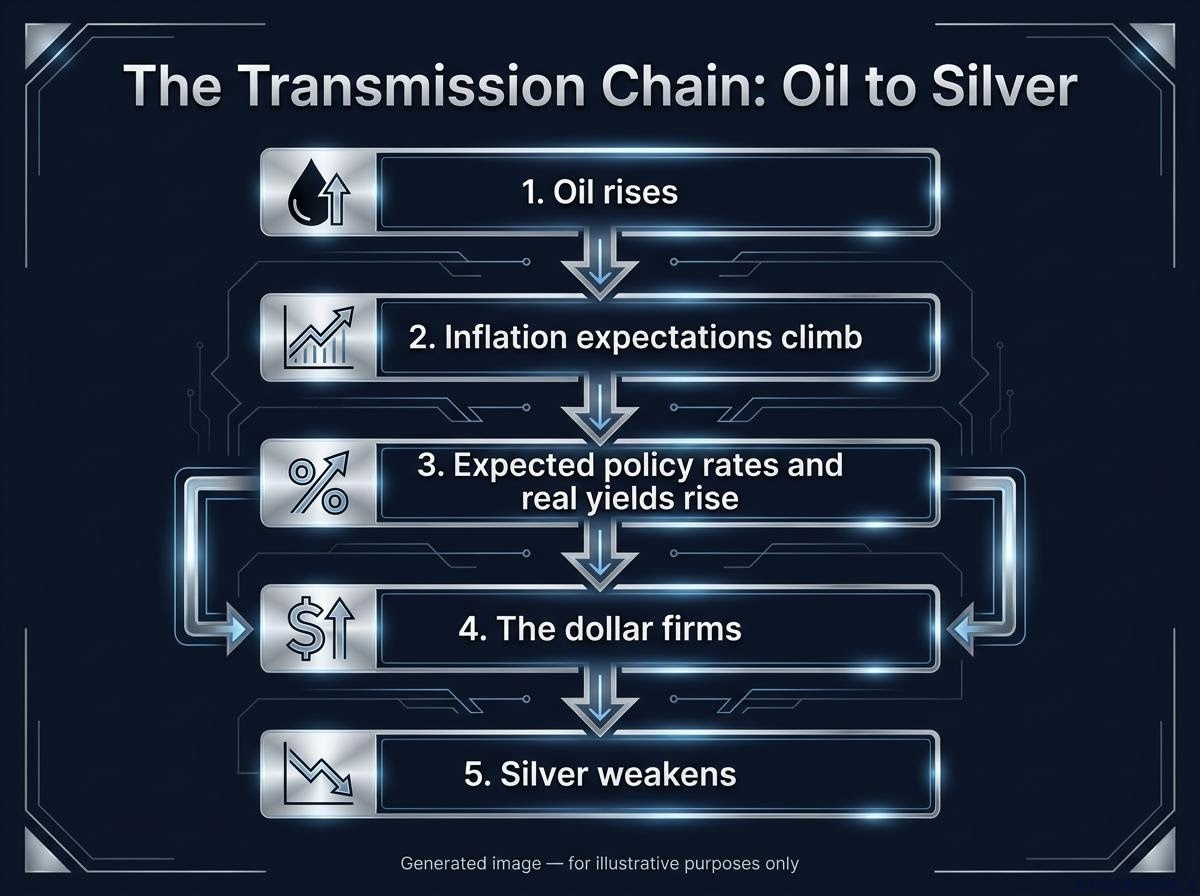
- Oil rises. Supply disruptions push crude higher, lifting costs for transport, power and manufacturing.
- Inflation expectations climb. Markets assume those costs will feed into consumer prices, making central banks less willing to cut and more willing to tighten.
- Expected policy rates and real yields rise. A real yield is the return on a bond after subtracting inflation. When it rises, the opportunity cost of holding silver rises too. Opportunity cost is the income you give up by choosing one asset over another.
- The dollar firms. A more restrictive Fed tends to support the US dollar, which makes dollar-priced silver more expensive for buyers outside the US.
- Silver weakens. With no coupon to compete against higher yields and a stronger dollar, demand softens.
Pricing for the December meeting shows how firmly step three has taken hold, although sources disagree on the exact number. CNBC put the chance of a December hike at about 92%, FXEmpire at about 94%, and FXStreet, citing CME FedWatch, at about 76% for a 25 basis point hike. A basis point is one-hundredth of a percentage point. The differences likely reflect timing and whether outlets measured a 25 bp move or any hike.
Rabobank frames why energy shocks now travel so far through the economy:
Rabobank on energy risk The bank’s analysts argue energy has become strategically vital in a new Cold War centred on supply chains, with conflict, blockades and attacks driving up shipping, insurance and freight costs. The Strait of Hormuz normally carries roughly one-fifth of global oil and LNG flows.
Silver’s dual identity is what makes it so exposed. It can attract safe-haven and inflation-hedge money in the first wave of a shock. Once the narrative shifts to “higher inflation, higher rates”, that support can disappear fast.
What 2022 showed
You have seen this before. In 2022, oil and supply-chain inflation failed to deliver a lasting silver rally because Fed hikes pushed real yields sharply higher, and metals stayed under pressure until markets priced a peak in rates.
The lesson is direct: watch Fed expectations and real yields, not the oil headline, to judge whether an energy shock lifts or sinks the silver price.
What actually drives the silver price beyond today’s headlines?
The core drivers
Silver is often treated as gold’s cheaper cousin. That framing will mislead you, because silver behaves like two assets sharing one ticker.
Silver’s behaviour is shaped by five distinct forces acting at once: the dollar, real yields, gold, Chinese industrial demand and Indian consumer buying, which is why you should never read a single headline in isolation.
| Driver | Direction of effect | Why |
|---|---|---|
| Interest rates | Higher rates tend to weigh on silver | Silver pays no yield, so rising rates raise the cost of holding it |
| US dollar | A strong dollar usually restrains silver | Silver is priced in dollars, so non-US buyers pay more |
| Industrial demand | Stronger growth tends to support silver | About 55% of annual demand comes from solar, electronics, EVs and AI hardware |
| Safe-haven and investment demand | Rising fear can lift silver, though usually less than gold | Investors buy bars, coins and ETFs for diversification and as a possible inflation hedge |
| Gold | Silver generally follows gold | Both respond to similar monetary forces |
The industrial side exists because silver conducts electricity better than copper or gold. Demand also tracks economic trends in the US, China and India, where jewellery buying carries real weight.
Supply is slow to respond. Roughly 74% of silver is mined as a by-product of base metals such as copper and zinc, so higher silver prices alone rarely bring much new output.
Silver’s market is also smaller and less liquid than gold’s. Liquidity is how easily an asset can be bought or sold without moving its price. Combine thin trading with industrial exposure and you should expect silver to move more sharply than gold, in both directions.
Reading the gold/silver ratio
The gold/silver ratio tells you how many ounces of silver it takes to buy one ounce of gold. A high reading may suggest silver is cheap relative to gold; a low reading suggests the reverse.
Kitco put the ratio at about 71.11 on 19 October. HDFC Securities reported about 72.2 at the end of the week, up from 69.2 earlier, as silver underperformed in the sell-off. Different measurement times explain the gap.
That widening captures silver’s double exposure. When rates threaten both valuations and the growth outlook, silver tends to fall faster than gold.
Is the long-term case intact, and what could change the picture?
Bulls versus bears
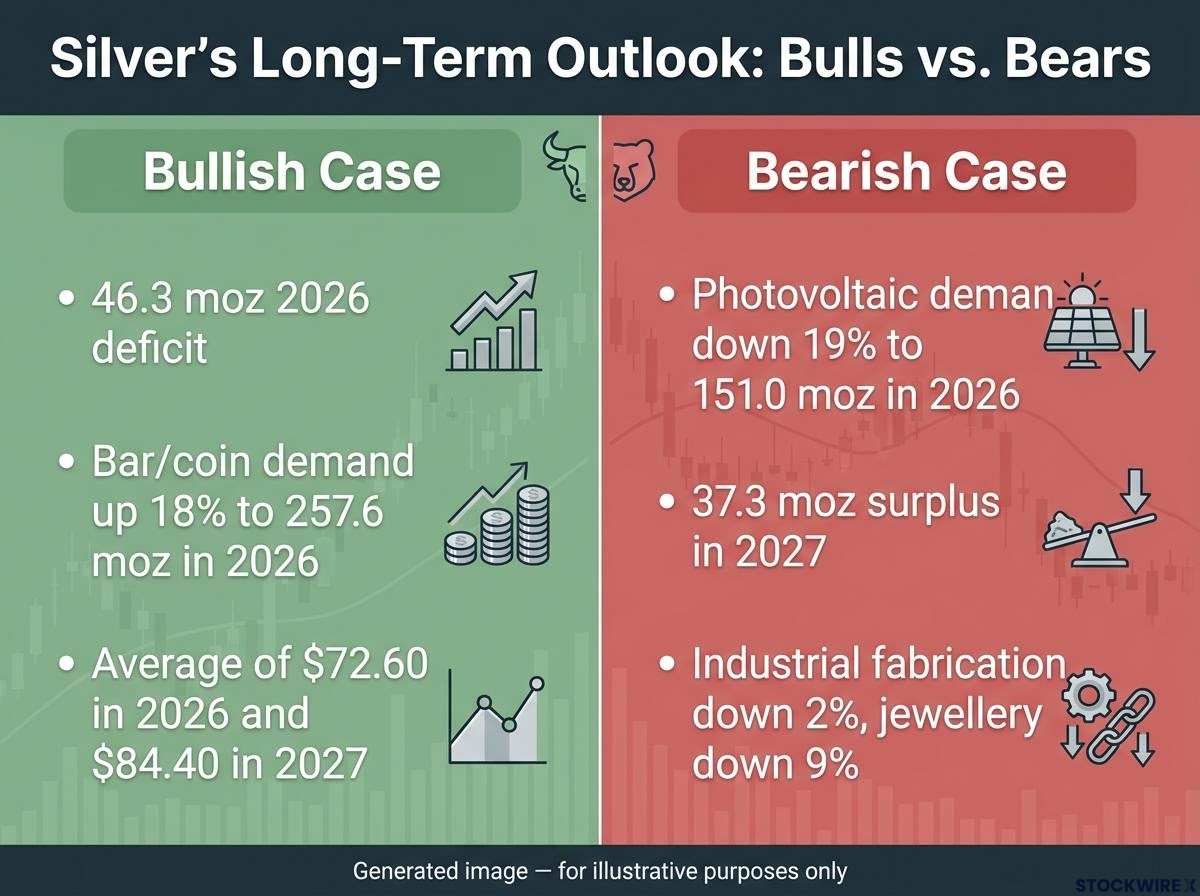
The disagreement over silver is mostly about time horizon. Bears focus on near-term tightening and demand destruction. Bulls focus on persistent physical shortfalls and supply that cannot respond quickly.
| Case | Argument | Key figures |
|---|---|---|
| Bullish | Structural deficit | 46.3 moz 2026 deficit, the sixth in a row (Silver Institute/Metals Focus) |
| Bullish | Physical investment demand | Bar and coin demand forecast up 18% to 257.6 moz in 2026 |
| Bullish | Price outlook | Metals Focus average of $72.60 in 2026 and $84.40 in 2027 |
| Bearish | Solar thrifting | Photovoltaic demand forecast down 19% to 151.0 moz in 2026 |
| Bearish | Possible surplus | Metals Focus sees a 37.3 moz surplus in 2027 |
| Bearish | Demand destruction | Silver Institute preliminary outlook: industrial fabrication down 2%, jewellery down 9% |
Be aware of one conflict. The Silver Institute/Metals Focus coverage cites a 46.3 moz deficit for 2026, while Metals Focus via Kitco cites 35.4 moz. The figures likely come from different publications, dates or definitions.
If you hold or are weighing silver, the useful question is not who is right. It is which horizon matches yours, because near-term yield pressure and a long-term deficit argument can both be true at once.
These forecasts are speculative and subject to change. Past performance does not guarantee future results.
Scenarios that would shift the outlook
The 27-28 October Fed meeting is the nearest catalyst. Three scenarios would change the picture:
- A Fed surprise: Hawkish comments from Warsh, hotter inflation or strong jobs data could lift hike odds and pressure silver. A dovish tone could spark a relief rally.
- A further oil spike: More disruption at Shaybah, Russian export sites or the Strait of Hormuz would strengthen the rate-pressure channel.
- An oil collapse: A US-Iran deal or Hormuz reopening could reverse crude sharply, cool inflation fears and ease rate expectations.
What the slide does and does not tell you about silver
The second-session fall was mainly a real-yield reaction to an oil-driven inflation scare. Higher expected rates raised the cost of holding a metal that pays nothing, and silver’s industrial exposure amplified the hit.
Treasury yields near multi-year highs have made the case for holding a zero-yield metal harder to sustain, and the same pressure appeared a month earlier even while Middle East tensions were running high.
What the move does not tell you is that the long-term deficit case has broken. It simply could not outweigh the immediate pressure from oil, a firmer tightening outlook and a stronger dollar.
Your decision points are now clear. Watch next week’s Fed meeting and Warsh’s tone, follow oil headlines tied to the Iran talks, and track the direction of real yields. Those signals, more than any single drone strike, will decide where silver goes next.
This article is for informational purposes only and should not be considered financial advice. Investors should conduct their own research and consult with financial professionals before making investment decisions.