
GWA outlines three-Horizon strategy and Q1 FY27 trading in line with expectations
In its 20 October 2026 investor presentation, GWA Group outlined a strategy to lead the evolution “from products to products, solutions and services”. The Investor Market Briefing was held at the Innovation and Distribution Centre (IDC) in Prestons, Sydney, and led by Managing Director and CEO Urs Meyerhans.
Management detailed Q1 FY27 trading of Group Revenue +0.3% and Group Volume +1.9% versus the prior corresponding period (pcp). The company described trading as “in line with expectations despite increasingly challenging markets.”
For investors, the update points to steady delivery in a subdued market alongside a defined growth path across three connected Horizons.
GWA presentation
“Customer First is not a program — it is how we operate every day.”
When big ASX news breaks, our subscribers know first
Proven delivery through a subdued market
The company highlighted consistent compound annual growth across all metrics from FY23 (the base year) to FY26. Volume grew at 1.5%, revenue at 1.0%, EBIT at 3.6% and EPS at 4.1% a year.
GWA said its Customer First approach has driven improvement across several measures:
- Continued improvement in Net Promoter Score (NPS) from FY23 to FY26
- Delivery in full of >90%
- Vitality Index of >10%, being the percentage of sales from new products launched in the last two years
- 30,000+ technical plumber interactions through GWA programs
The presentation also stated that GWA’s Right to Win rests on five reinforcing strengths: technical expertise, deep plumber relationships, market leading brands, end-to-end category expertise and innovation capability.
Three Horizons: the growth roadmap
Plumbers specify, install and influence customer outcomes, according to the presentation, which noted they are increasingly time poor. That makes the plumber central to adoption in bathroom products.
The presentation described value as shifting from fixtures to managed outcomes, where customers buy assurance, compliance and lifecycle performance. GWA’s evolution from products towards solutions and services is the thread connecting the three Horizons.
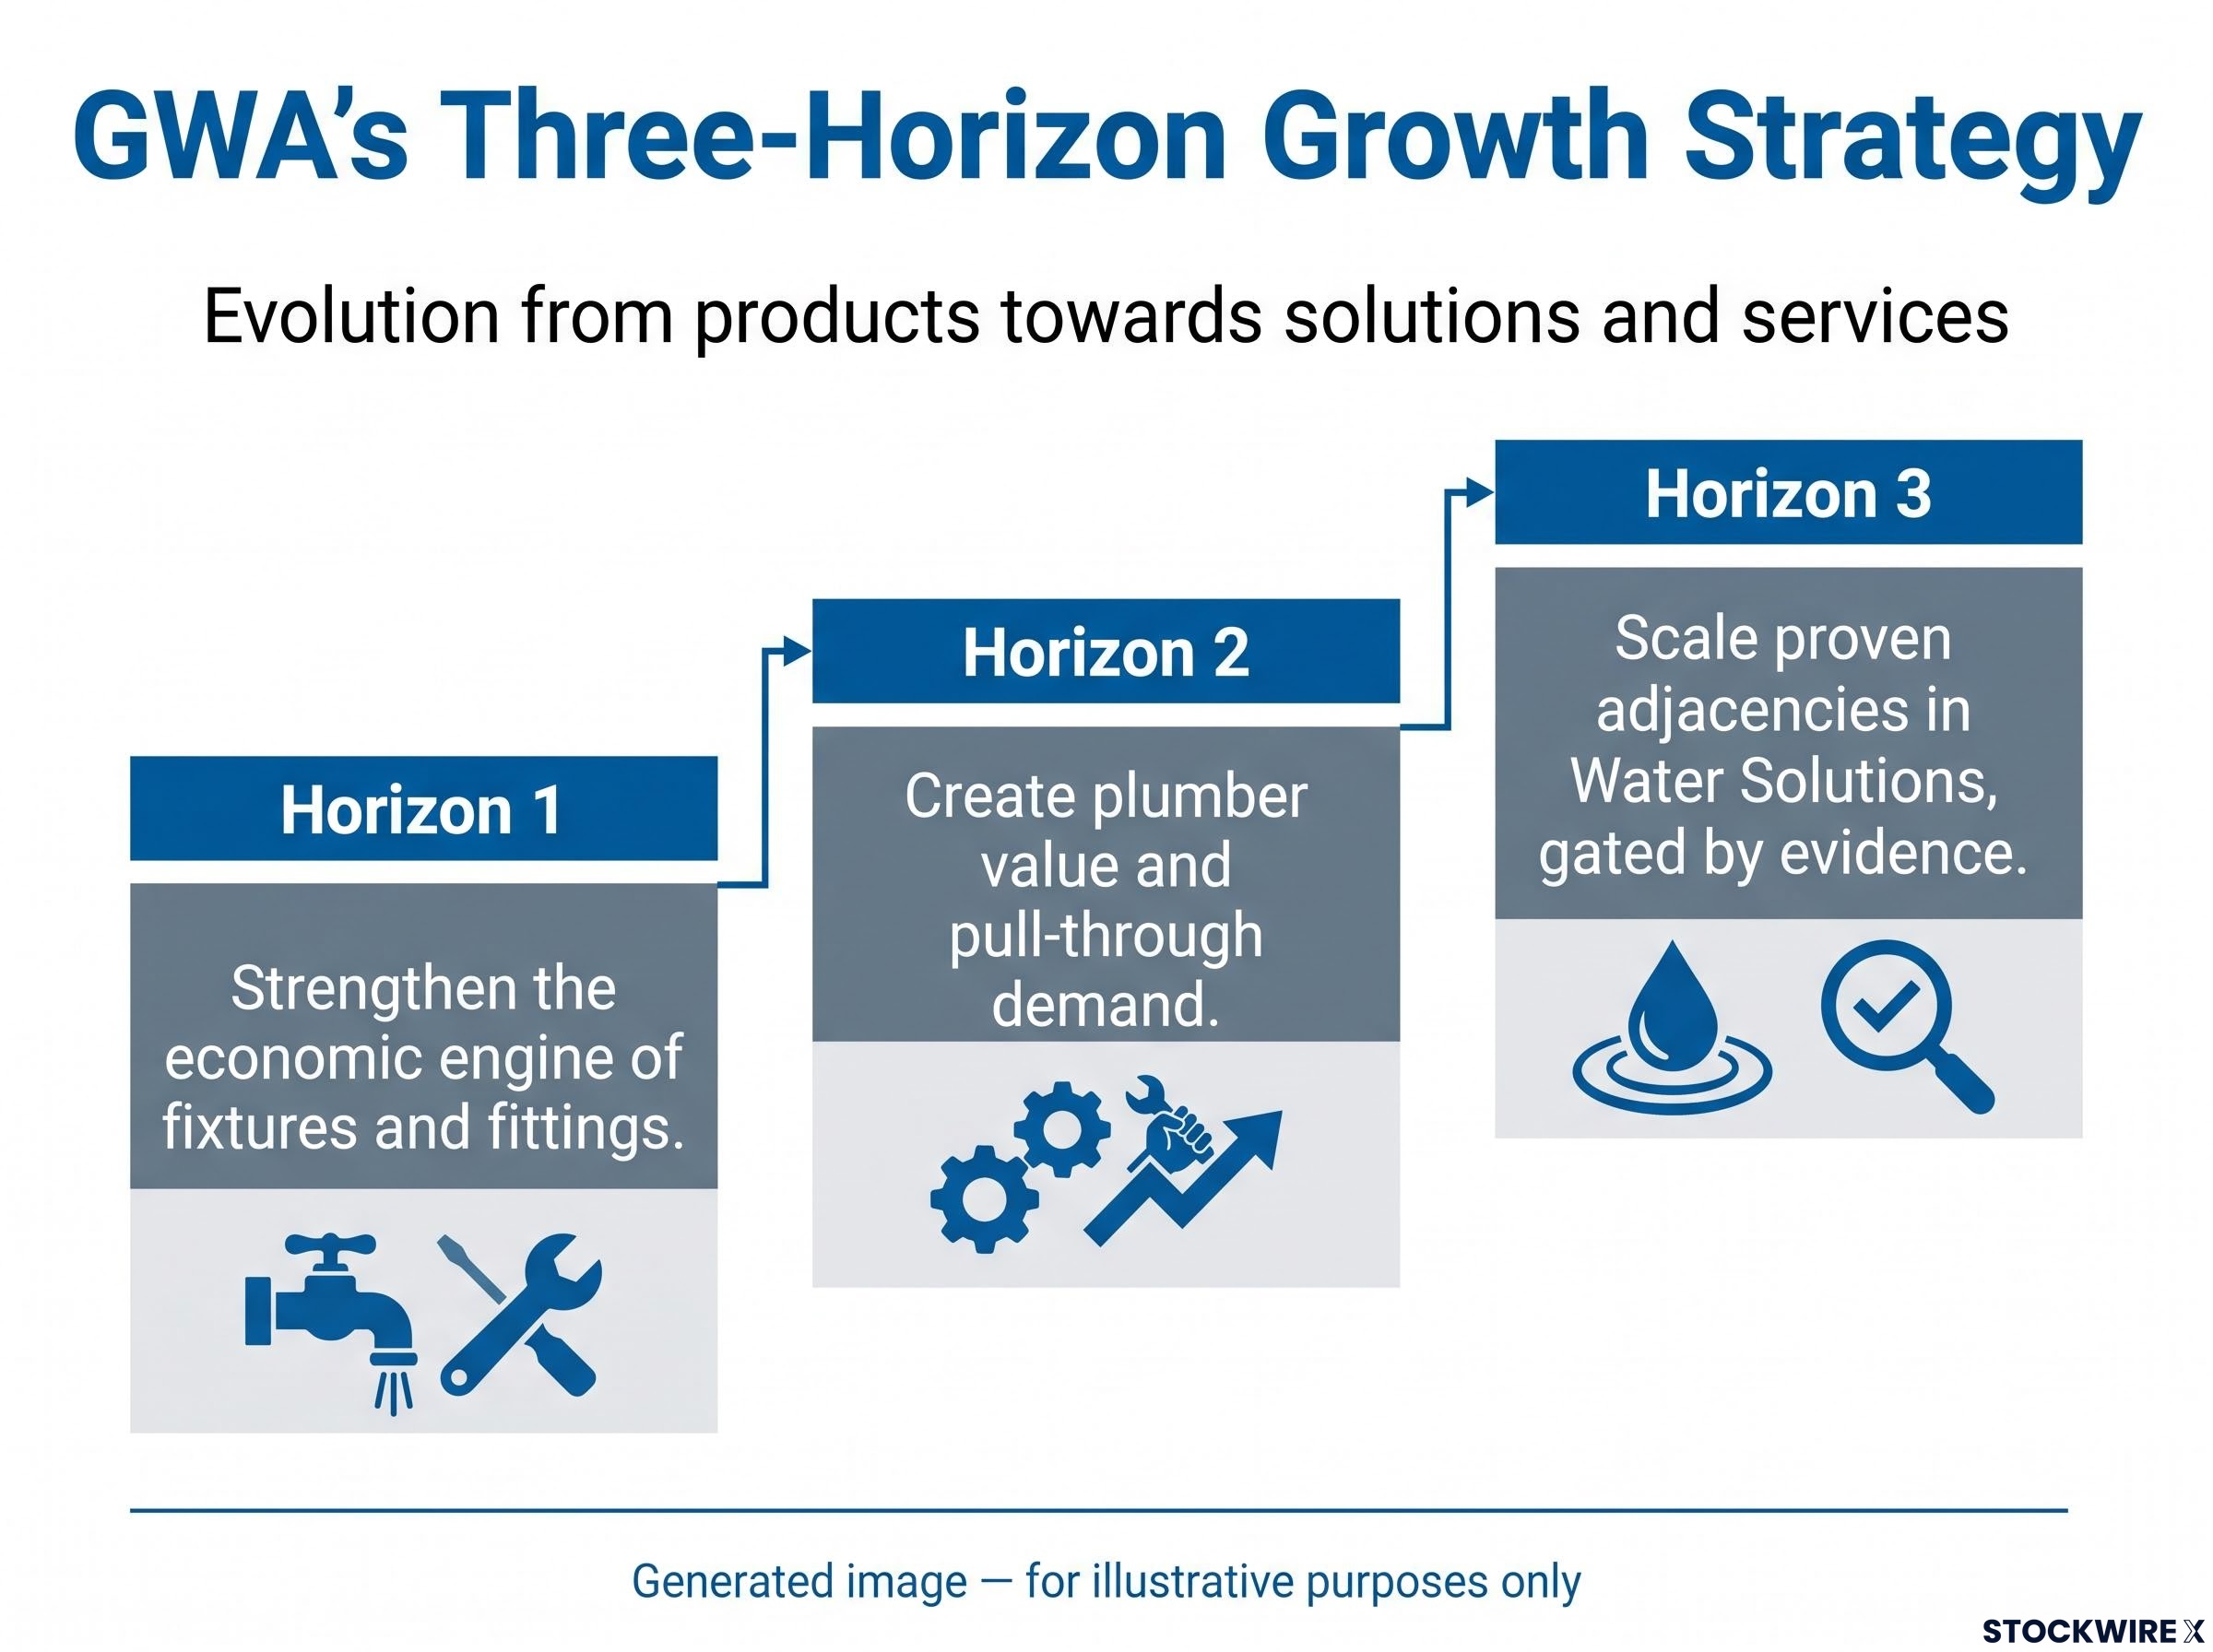
Horizon 1, Fixtures and Fittings: the economic engine
Horizon 1 is described as the economic engine of GWA, built on winning the market, the customer and the point of purchase. Management said the Fixtures and Fittings market remains resilient, supported by a large installed base and recurring repair and replacement demand, but that the basis of competition is changing.
According to the presentation, winning requires differentiated innovation, ease of doing business and strong value chain economics.
Horizon 2, Plumber Obsession
GWA said it is building “Australia’s first proprietary plumber intelligence platform”, with the aim of reducing installation time and risk for plumbers. Commercial proof is to be measured by participation, recommendation and pull-through demand.
The presentation did not disclose financial targets for this Horizon.
Horizon 3, Water Solutions: gated by evidence
GWA described Horizon 3 as “an adjacency, not a diversification”, built on assets it already owns. Citing GWA estimates, the company noted ~100 million of its fixtures and fittings are installed across ANZ, and it has relationships with 25,000+ plumbers.
Caroma Smart Command® is in 300+ commercial buildings, while Leak SmartShield™ is in market and early stage. Investment is managed through “stage-gated capital” and is “funded within current settings”.
The three Horizons at a glance
- Horizon 1: Strengthen the economic engine of fixtures and fittings.
- Horizon 2: Create plumber value and pull-through demand.
- Horizon 3: Scale proven adjacencies in Water Solutions, gated by evidence.
Q1 FY27 trading and regional outlook
The Q1 FY27 trading update showed mixed regional results versus the pcp, with revenue stated in Australian dollars at group level.
| Region | Revenue vs pcp | Volume vs pcp | Local-currency note |
|---|---|---|---|
| Group | +0.3% | +1.9% | Revenue in AUD |
| Australia | +1.8% | +1.8% | n/a |
| New Zealand | -9.1% | -0.9% | +0.1% in NZD |
| United Kingdom | -5.6% | +3.6% | +2.4% in GBP |
The regional market outlook outlined by management was as follows:
- Australia: Commercial (excluding data centres) is expected to show a slight decline due to project cancellations and deferrals, with health, aged care and education offsetting some of it. Detached housing is expected to be modestly higher in H1 and soften in H2, multi-residential completions are expected to increase through FY27, and renovation is expected to decline through FY27 with repair and replacement remaining resilient.
- New Zealand: Recovery is tempered by rising rates.
- United Kingdom: The challenging market continues, with recovery expected to be gradual.
Financial strength and capital discipline
GWA reported leverage inside its 1.0-2.0x target range at FY26. The table below reproduces the metrics as presented, in millions of AUD, calculated for GWA’s syndicated banking group and not adjusted for IFRS 16 Leases.
| Metric | FY22 | FY23 | FY24 | FY25 | FY26 |
|---|---|---|---|---|---|
| Net debt | $138.2 | $117.0 | $97.0 | $85.1 | $127.9 |
| Leverage (net debt / EBITDA) | 1.7x | 1.5x | 1.2x | 1.1x | 1.6x |
| Interest cover (EBITDA / net interest) | 18.3x | 13.3x | 14.5x | 12.6x | 10.7x |
| Gearing (net debt / net debt + equity) | 26.2% | 23.0% | 19.9% | 18.0% | 25.7% |
EBITDA in these metrics is normalised. The FY26 net debt movement reflects “planned working capital timing and share buyback”.
GWA holds $205m of facilities, with $77m undrawn headroom at 30 June 2026:
- $165m multi-currency revolving facility, expiring October 2028
- $40m bilateral facility, expiring October 2027
The capital management framework includes a dividend payout policy of 65-85% of NPAT and a cash conversion target of 80-85% Op CF/EBITDA.
GWA’s FY26 full year results showed normalised NPAT growth of 4.9% to $48.8m and a 6.5% dividend lift to 16.5c per share, while a deliberate stock pull-forward held free cash flow at $25.0m, with cash conversion expected to recover in FY27 as that timing reverses.
On returns, GWA paid $198m in dividends over the last five years and completed a $25m share buyback in FY26, a total of $223m returned to shareholders.
Stay Ahead on Industrials News Before the Market Moves
Get FREE breaking ASX alerts delivered within minutes of release, complete with in-depth analysis and the full announcement. Join 20,000+ subscribers already receiving the news first. Click the “Free Alerts” button at Big News Blast to be across market-moving updates the moment they break.