Net interest on US federal debt is running at roughly $1.0-$1.05 trillion a year, about 19.5% of federal revenue. Peter Schiff, the gold advocate who has warned of a sovereign debt crisis for years, describes a very different picture: $50 trillion of debt at 8%, costing around $4 trillion a year.
Both pictures start from the same debt pile. The distance between them comes down to a handful of assumptions you can check yourself.
Gross federal debt has passed $40 trillion, and the 10-year Treasury yield sits near 5%. If bond markets reprice US government debt, the effects reach your mortgage rate, your bond fund and the purchasing power of your cash.
This piece separates Schiff’s assumptions from the current data, shows how serious the risk looks to the institutions tracking it, and weighs the assets he favours against the ways each can let you down.
How does rising interest on government debt turn into a sovereign debt crisis?
The arithmetic of interest costs
Start with the numbers. According to US Treasury data, gross federal debt stood at $40.388 trillion on 15 October 2026, with about $32.54 trillion held by the public. Debt held by the public is the portion owed to outside investors rather than to other government accounts.
The Congressional Budget Office (CBO) puts net interest for FY2026 at $1.0 trillion, or 3.3% of GDP. Treasury’s own figure is about $1.05 trillion. The two use different methods, since Treasury reports actual cash results and CBO reports projections. Both land in the same $1.0-$1.1 trillion range.
The danger lies in how the loop works:
- The government spends more than it collects, so it borrows.
- A larger debt stock means a small rise in rates lifts interest costs sharply.
- Higher interest costs widen the deficit.
- Wider deficits require more borrowing.
- Investors may demand higher yields to hold the extra debt, which restarts the cycle at a higher level.
Here is how today compares with official projections and Schiff’s scenario:
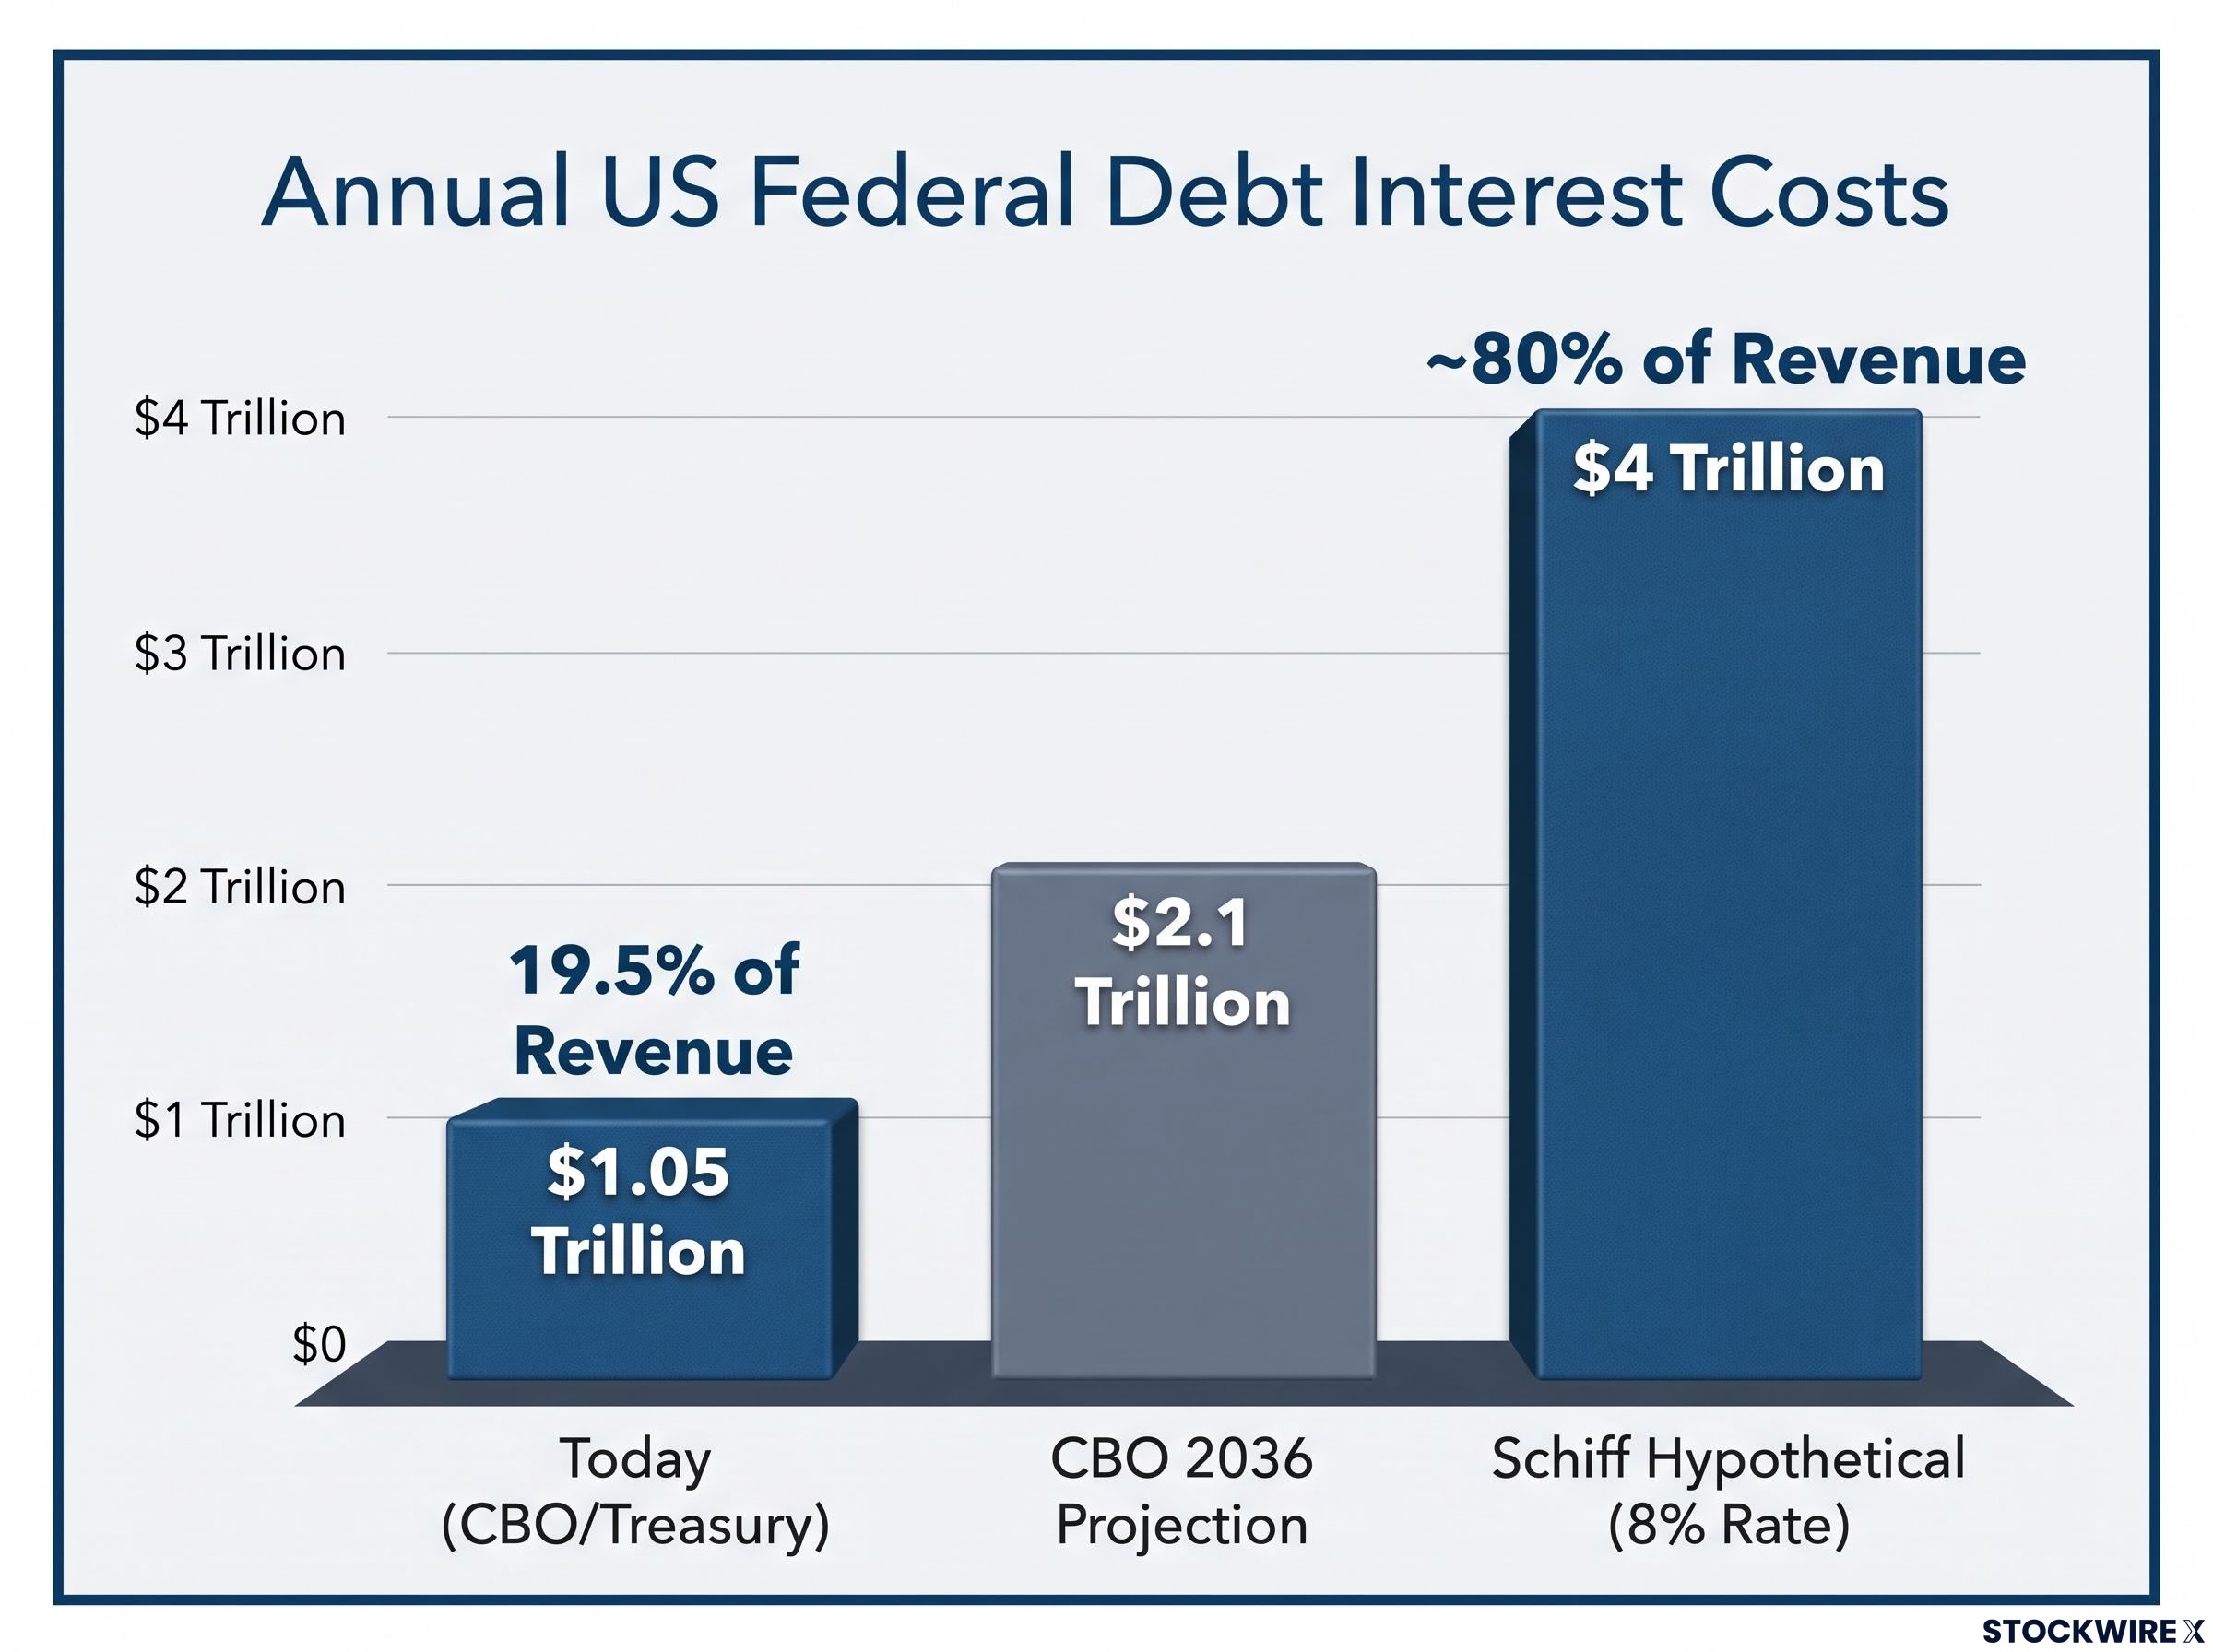
| Measure | Today (CBO/Treasury) | CBO 2036 projection | Schiff hypothetical |
|---|---|---|---|
| Debt | $40.388T gross; $32.54T public | 120% of GDP (public) | $50T |
| Annual interest cost | $1.0T-$1.05T | $2.1T (4.6% of GDP) | $4T at 8% |
| Share of revenue | About 19.5% | Not specified | About 80% |
The IMF projects US general government debt reaching 140% of GDP by 2030, so the official direction of travel points upwards too.
Economists treat the moment when borrowing costs overtake growth as the real tipping point, because after that crossover, stabilising the debt ratio requires a primary surplus rather than just a smaller deficit, which is why the interest rate assumption carries so much weight.
Why the rate assumption matters
CBO expects FY2026 revenue of $5.6 trillion. Schiff’s $4 trillion interest bill would swallow roughly 80% of it, leaving deficits of $6-7 trillion by his estimate.
Most of that jump comes from the rate. Today the 10-year yield is about 5.06% and the 30-year about 5.43%, and the government’s average borrowing cost sits below both because older, cheaper debt is still rolling off. Push that average towards Schiff’s 8% on a larger stock and interest costs roughly quadruple.
That tells you where to look. The headline debt total grabs attention, but yields and deficits decide whether the burden climbs gradually or spirals.
When big ASX news breaks, our subscribers know first
Is the dollar’s reserve status really at risk?
Schiff’s case rests on a simple idea. Foreign central banks have long needed dollars, which let Washington borrow heavily at low rates, and he argues that privilege is fading.
The data gives him something to work with. IMF reserve data shows the dollar held 56.70% of allocated foreign exchange reserves in Q2 2026, down from roughly 71-72% around 1999-2001. Central banks bought 288.9 tonnes of gold in Q2 2026, up 62% year on year, according to the World Gold Council, and 84% of reserve managers in its survey expect higher gold allocations over five years.
The IMF adds a caveat: its reserve figures exclude gold, so part of the dollar’s apparent decline reflects gold’s rising value and official buying rather than a rush into rival currencies.
Why the dollar still dominates
Reserve status rests on more than a debt ratio. It depends on deep, liquid markets, legal protections, free convertibility (the ability to swap a currency freely without government restrictions), use in trade invoicing and network effects, where everyone uses the dollar because everyone else does.
| Currency | Share of reserves (Q2 2026) | Key constraint |
|---|---|---|
| US dollar | 56.70% | Fiscal deterioration and long-run share decline |
| Euro | 20.60% | No fully unified capital market |
| Yen | 4.96% | Small share; policy shifting at the Bank of Japan |
The renminbi faces capital controls and limited convertibility. Total reported reserves come to $13.22 trillion, and no rival comes close to the dollar’s slice.
Many large institutions are sceptical of a sudden break. J.P. Morgan finds limited evidence of a structural shift, Goldman Sachs Asset Management sees gradual diversification as more plausible than displacement, and Morgan Stanley expects marginal erosion rather than a collapse. Tufts economist Michael Klein says the dollar is not imminently losing its status, though regional displacement could grow if confidence in US institutions falls.
The sceptic’s case Standard Chartered’s Steve Englander and Eric Robertsen argue dollar fears are overstated: exporters still hold dollars, US assets remain attractive and no alternative matches the dollar’s liquidity and scale.
The warnings are still real. The IMF calls fiscal deterioration a vulnerability, and Fitch Ratings says rising yields make it harder for the US to stabilise its debt.
Fiscal strain is only one of the dollar reserve currency pressures now building, since war-related outlays and record central bank gold buying are compounding the same debt concerns that bond markets are already pricing in.
What France and Japan show
Schiff points to France and Japan as fellow large debtors. Fitch projects French debt reaching 128% of GDP by 2030, and because France does not control its own monetary policy, a widening spread over German bonds can quickly raise its borrowing costs.
Japan carries far more, with Fitch projecting 185% by 2030. Domestic ownership has let it borrow cheaply for years, though that model is under pressure as the Bank of Japan normalises policy. Very high debt does not guarantee collapse, but it is not free either.
For you, the realistic risk is a slowly rising risk premium on Treasuries, with a sharper break only if policy credibility erodes abruptly. That should shape how much protection you are willing to pay for.
How would inflation and fiscal dominance reach your portfolio?
If yields keep climbing and Washington resists spending cuts or tax rises, pressure shifts to the Federal Reserve. That is where fiscal dominance enters.
Fiscal dominance is when keeping government borrowing cheap takes priority over a central bank’s goal of controlling inflation. Reuters coverage has tracked investor concern that political pressure for low rates could constrain the Fed. Schiff argues governments benefit from inflation because they get to spend newly created money first.
Inflation erodes the real value of debt. That helps the borrower and hurts whoever holds the bonds.
Two ways the adjustment could play out
- Disorderly: Investors refuse to absorb debt at current yields, bond prices fall, yields jump and inflation accelerates. The 2022 UK gilt shock is the reference point: an unfunded tax-cut announcement triggered a yield spike and forced pension-related selling. This is close to Schiff’s view.
- Gradual: The US keeps borrowing in its own currency and issuing the world’s main safe asset, so adjustment comes slowly through moderately higher inflation, financial repression (policies that hold interest rates below inflation) and a long stretch of yields above economic growth.
Schiff considers a 10-15 year inflation cycle realistic, though that figure came from an unnamed expert he agreed with, not from any official forecast. He also argues crises stem from government intervention, and that falling prices help consumers and businesses if margins hold.
Whichever road plays out, the most exposed holdings look the same. Bond prices fall when yields rise, and inflation eats into cash. If your portfolio leans on long-duration Treasuries or sits heavily in cash, you carry the most risk in both scenarios, which is why the hedging debate exists.
What do gold, silver, resource stocks and emerging markets offer, and what could go wrong?
Schiff’s answer is to own tangible assets rather than paper promises. Beyond gold, he favours silver, resource companies across metals, agriculture and energy, some technology and emerging markets. He argues energy demand is growing faster than supply, with conflicts in Ukraine and the Middle East complicating matters.
Where the hedges can fail
Each of these assets is a separate bet with its own weak point.
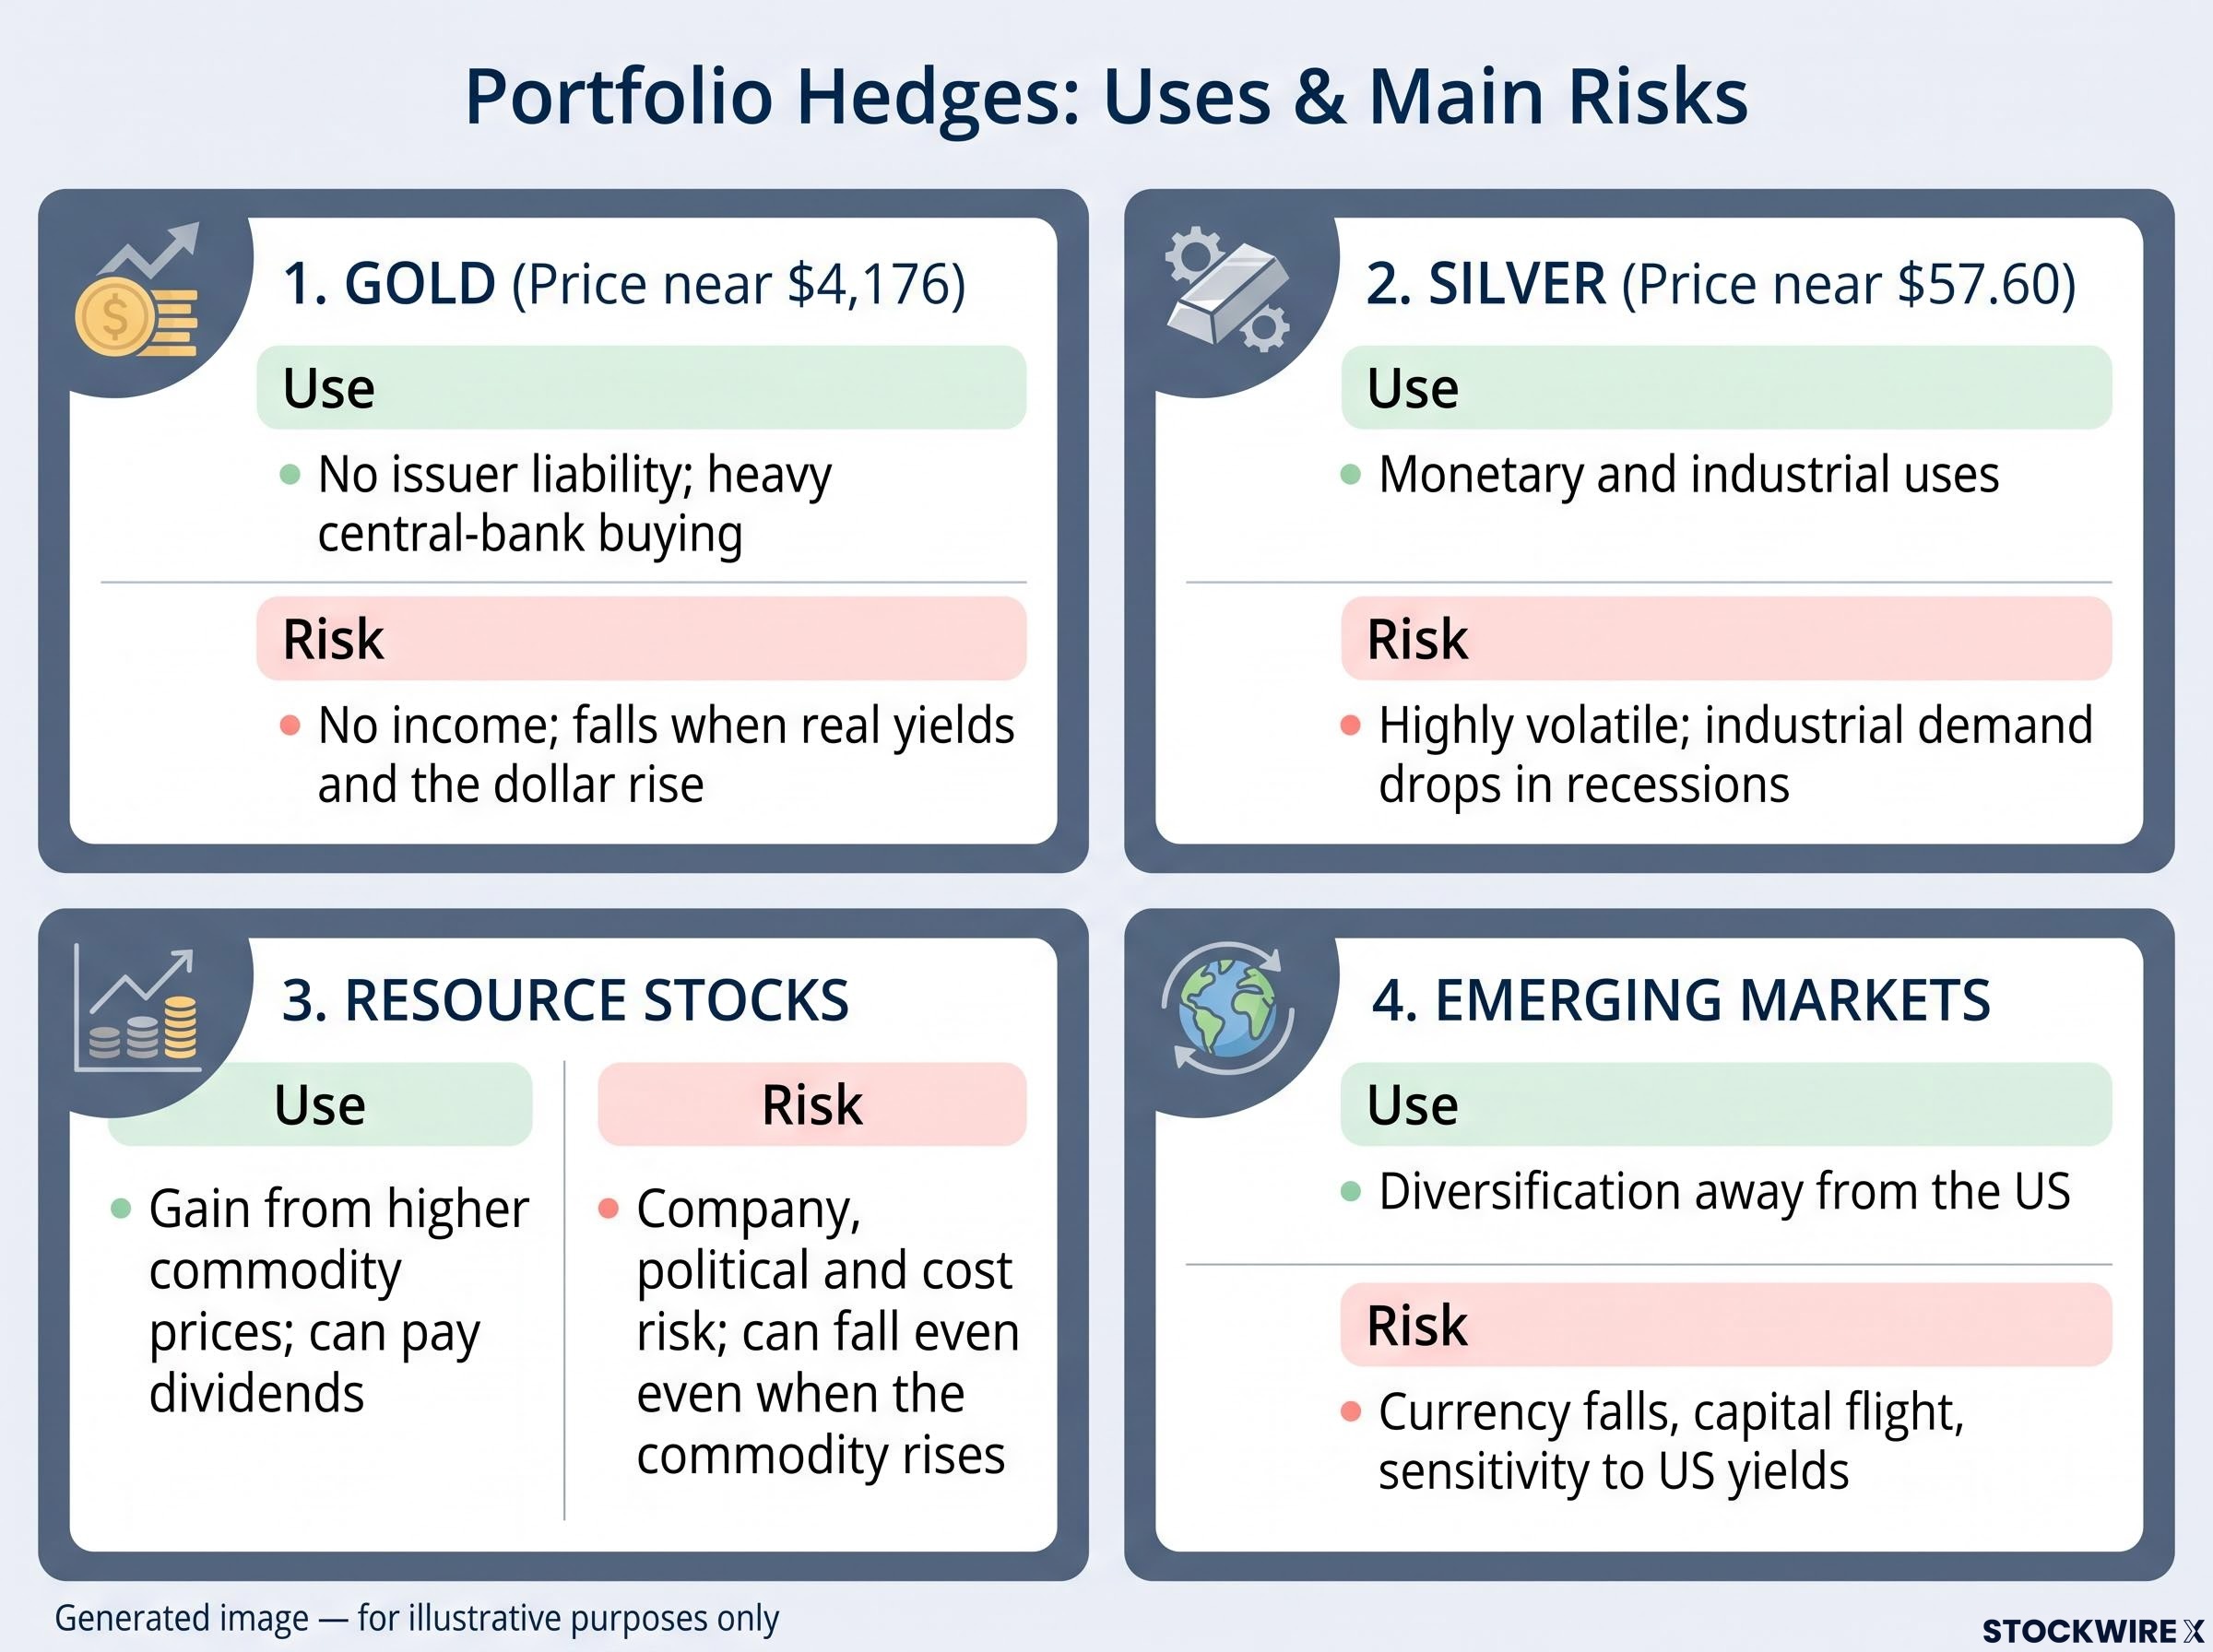
| Asset | Why supporters use it | Main risk |
|---|---|---|
| Gold | No issuer liability; heavy central-bank buying | No income; falls when real yields and the dollar rise |
| Silver | Monetary and industrial uses | Highly volatile; industrial demand drops in recessions |
| Resource stocks | Gain from higher commodity prices; can pay dividends | Company, political and cost risk; can fall even when the commodity rises |
| Emerging markets | Diversification away from the US | Currency falls, capital flight, sensitivity to US yields |
| Tangible assets | Can hold nominal value in inflation | Illiquid; can suffer in deflation or a credit squeeze |
Gold trades near $4,176 an ounce and silver near $57.60 as of today, prices that already reflect heavy official demand. The 1970s offer a guide: gold eventually surged but swung sharply along the way, equities suffered, and energy and commodity producers fared relatively better. Real assets did not all rise together.
Can AI productivity offset inflation?
Some investors hope artificial intelligence will lift productivity enough to ease the debt problem. Schiff thinks it would take a dramatic effect.
Schiff’s illustration If AI cut prices by 20% a year while inflation ran at 22%, net inflation would be just 2%.
The scale of spending is large. Columbia’s Stijn Van Nieuwerburgh estimates US spending on AI chips, data centres and power systems could exceed $10 trillion from 2025 to 2032, more than 3.6% of annual US output.
The problem is timing. The Bank for International Settlements (BIS) cites task-level time savings of 20%-50%, yet warns that heavy AI-related debt issuance leaves bond markets vulnerable. The IMF says expectations of economy-changing AI can push real interest rates up before productivity arrives, and Fed Chair Kevin Warsh has described AI investment as a shock to prices and demand first.
So none of these hedges is guaranteed, and each protects against a different risk. With gold already pricing in strong official buying, how much you hold matters more than how strongly you believe the story.
Gold is not the only defence against these risks, since inflation-protected Treasuries now offer real yields near multi-decade highs, and the two instruments hedge different threats rather than competing directly.
These statements are speculative and subject to change based on market developments. Past performance does not guarantee future results.
Weighing the bond-crisis case without betting everything on it
The numbers support a serious and growing interest burden. CBO projects net interest doubling to $2.1 trillion by FY2036. Schiff’s 8% rate and $50 trillion debt, though, are assumptions, and most institutions expect a rising risk premium on Treasuries rather than an imminent break.
Three variables will tell you which story is winning:
- Treasury yields, especially whether the 10-year holds above 5%
- The interest-to-revenue ratio, now around 19.5%
- Fed independence, and any sign that financing needs are steering rate decisions
Real assets can help diversify against some of these risks, but each carries trade-offs that should be weighed against your own goals, time horizon and existing holdings.
This article is for informational purposes only and should not be considered financial advice. Investors should conduct their own research and consult with financial professionals before making investment decisions.