
Own an S&P 500 index fund and you probably think you own a slice of 500 businesses. In practice, roughly 34.6% of that index now sits in just seven companies, as of mid-October 2026.
Those seven share a nickname, but they do not share a risk profile. A company earning a 75% gross margin and one earning 18% are not the same bet, even if they trade under the same banner.
This is an exercise in risk management, not a recommendation to concentrate your holdings or buy any of these stocks. The aim is to see the Magnificent Seven stocks clearly enough to judge the risk you already carry.
Here you get a reusable five-criteria framework for judging whether each name moves up or down on risk. You also get a valuation cross-check and practical steps for keeping your portfolio diversified on purpose rather than by accident.
Why the Magnificent Seven are not one risk, and how the five-criteria framework works
You may treat these seven stocks as a single trade, and markets often do too. The label encourages that habit.
Michael Hartnett of BofA Global Research coined the term in May 2023, borrowing it from a 1960 Western film. The group is Apple, Microsoft, Nvidia, Amazon, Alphabet, Meta and Tesla. Seven of the world’s ten largest companies belong to it.
The five criteria at a glance
The framework below comes from a ranking exercise by presenters at New Constructs. All seven companies start level. Each then moves up or down a notch on each criterion:
- Margin durability
- Cash and debt strength
- Geographic diversification
- Internal diversification and transparency
- Geopolitical vulnerability
Valuation sits outside the ranking as a separate check, because a well-run business can still be a poor buy at the wrong price. The presenters call their method as objective as possible while admitting some subjectivity. Treat the result as a way of thinking, not a buy list.
How concentrated is the index?
The weights below show how much of a standard S&P 500 fund each company accounts for.
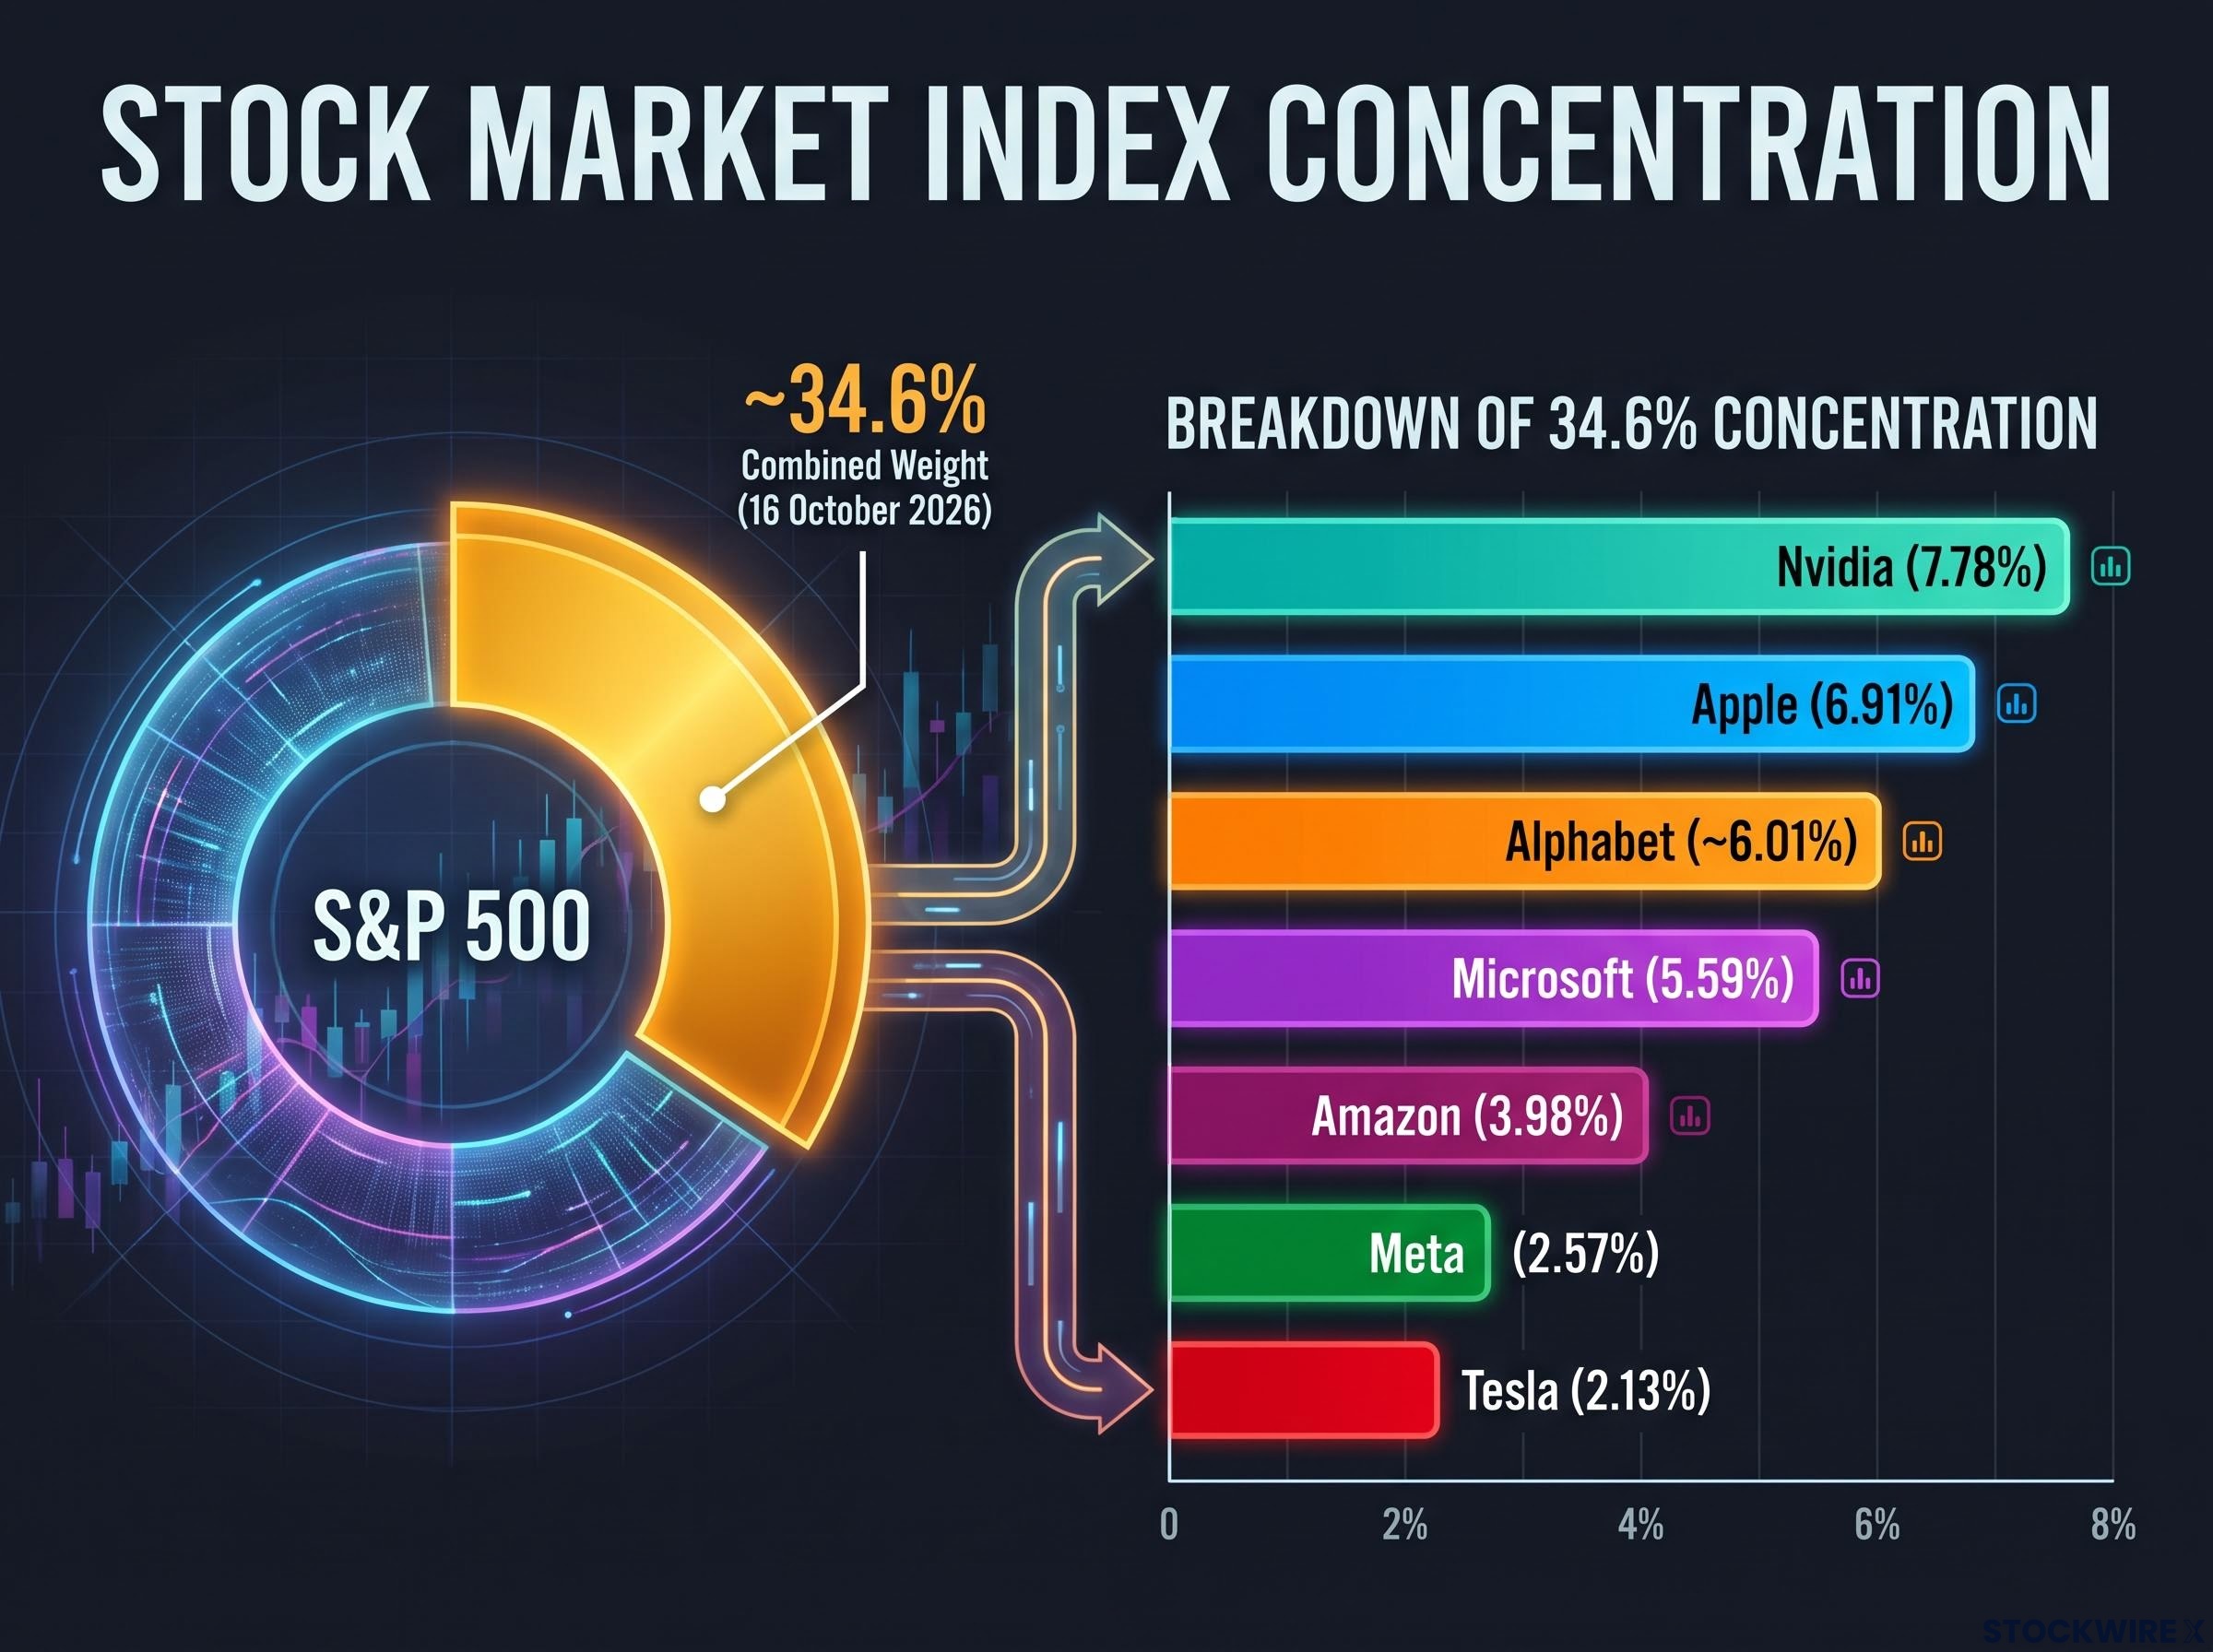
| Company | S&P 500 weight (10 October 2026) |
|---|---|
| Nvidia | 7.78% |
| Apple | 6.91% |
| Alphabet (Class A and C combined) | ~6.01% |
| Microsoft | 5.59% |
| Amazon | 3.98% |
| Meta | 2.57% |
| Tesla | 2.13% |
| Combined | ~34.6% (16 October 2026) |
The combined figure touched about 35% at the early-June 2026 peak. Weights shift daily, so verify them with S&P Dow Jones Indices or another authorised provider.
If you hold a broad fund, index fund concentration means your returns already lean on a handful of names, and holding a total market fund alongside an S&P 500 fund may simply duplicate that tilt.
If you hold a broad S&P 500 fund, roughly one-third of that equity exposure already rides on these names. Understanding their separate risks is part of understanding your own portfolio.
When big ASX news breaks, our subscribers know first
Which margins hold up? Profitability today versus durability tomorrow
Start with the obvious question: who makes the most money on each dollar of sales? Then ask the harder one: who will still be making it in five years?
Current margins
Gross margin is the share of revenue left after the direct cost of making a product. Operating margin is what remains after running costs such as salaries and research as well.
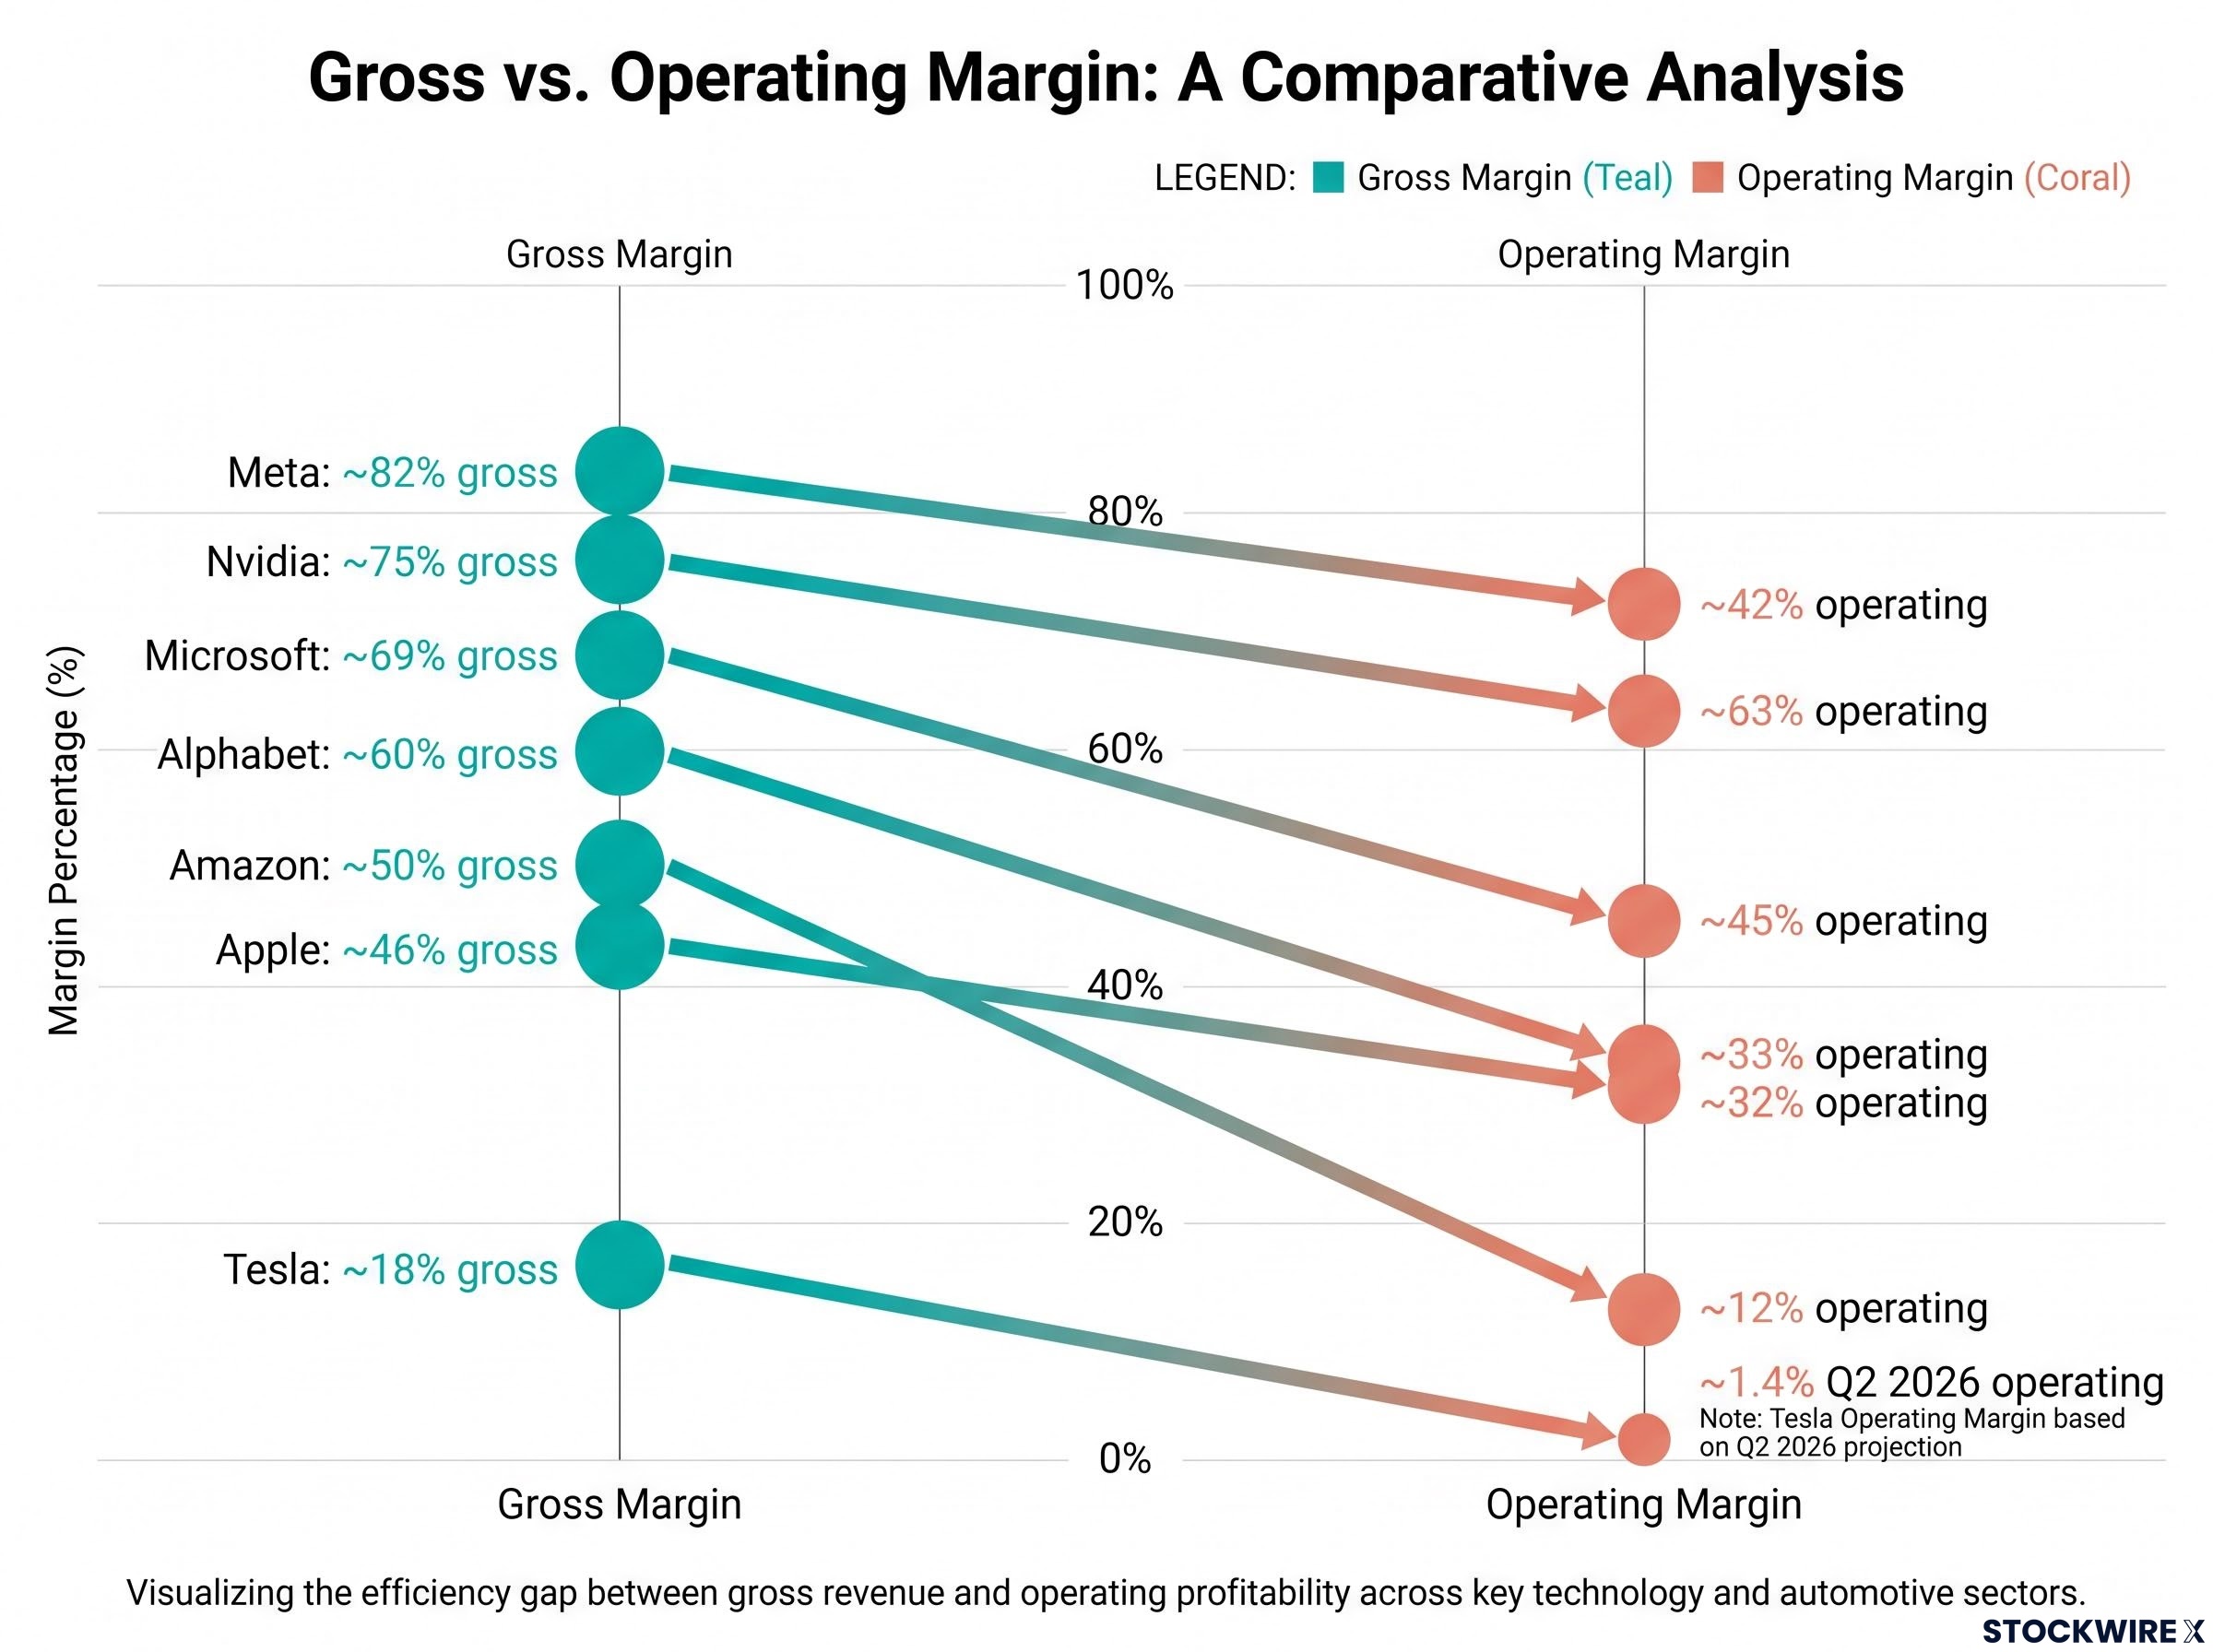
| Company | Gross margin | Operating margin | Direction in ranking |
|---|---|---|---|
| Meta | ~82% | ~42% | Up |
| Nvidia | ~75% | ~63% | Down |
| Microsoft | ~69% | ~45% | Up |
| Alphabet | ~60% | ~33% | Unchanged |
| Amazon | ~50% | ~12% | Up |
| Apple | ~46% | ~32% | Unchanged |
| Tesla | ~18% | ~1.4% (Q2 2026) | Down |
These figures shift depending on GAAP versus non-GAAP treatment (official accounting rules versus company-adjusted numbers) and on the quarter chosen.
Why durability changes the order
Nvidia has the highest operating margin in the group, yet it falls in the ranking. Amazon, with one of the lowest, rises. The presenters ranked on outlook, not the latest snapshot.
- Nvidia: Data centres supplied about 92.5% of revenue (US$89B of US$96.2B in the quarter ended 26 July 2026). That pricing power faces customer concentration, custom chips built by its biggest buyers, export controls and JPMorgan’s warning (2 December 2025) of a possible “metaverse moment”.
- Apple: Services delivered record quarterly revenue of US$30.7B, adding a higher-margin recurring stream. Still, the iPhone supplies about 50% of revenue.
- Amazon: Operating margin of about 12% sits well above historical retail levels, and gross margins keep rising with levers still left in AWS, advertising and fulfilment automation.
- Tesla: Q2 operating margin fell from 4.1% to 1.4%, with operating income down about 57% year over year.
Tesla’s margin gap A 1.4% operating margin carries a valuation built on robotaxis, robotics and energy. The bull case rests on businesses that do not yet show visible economics.
Meta rises on the objective numbers, though it remains ad-dependent, and legal charges and severance hit Q2 operating income alongside ongoing Reality Labs losses.
A high margin today tells you how good the business is, not how safe your purchase price is. For each name, ask what would have to stay true for that margin to last.
Balance sheets and business mix: cash, debt, geography and transparency
Margins separate the group. Balance sheets, reassuringly, do not.
Cash and debt: a non-event for all seven
All seven generate enough cash flow to carry substantial debt, even with heavy AI spending, so none moved up or down on this criterion. Tesla shows why reading liquidity correctly matters:
- Fitch rated Tesla BBB with a stable outlook on 21 September 2026.
- Tesla signed US$30B of credit facilities: a US$20B delayed-draw term loan plus US$10B of revolving facilities (Reuters, 29 September 2026).
- Nothing was drawn at signing, and Tesla said it did not plan to draw on them during 2026.
- It held US$43.5B in cash and marketable securities as of 30 June 2026.
A credit facility is capacity to borrow, not borrowing. Do not mistake a safety net for a debt load.
Geographic reach
Here the presenters focused on emerging markets outside China, which they see as a competitive threat rather than a growth market. Google rises because it monetises intent: a search in a poorer country still signals what someone wants to buy. Meta monetises attention, which is concentrated where advertisers pay less, so it stays unchanged, while Amazon rises on its overseas growth runway.
Transparency and concentration inside the business
This is where “financially strong” and “diversified” part ways. Meta reports everything as a single advertising line with no app-level detail. Nvidia is transparent but depends on data centres for about 92.5% of revenue, while Tesla leans on uncertain stories in robotaxis, humanoids and energy.
Amazon’s intricate mix earns praise. Apple’s iPhone supplied US$54.3B of US$109.4B in fiscal Q3 2026, roughly 49.6-50%.
| Company | Cash/debt move | Geographic move | Internal diversification move |
|---|---|---|---|
| Apple | None | None | None |
| Microsoft | None | None | None |
| Nvidia | None | None | Down |
| Amazon | None | Up | Praised |
| Alphabet | None | Up | None |
| Meta | None | Unchanged | Down |
| Tesla | None | None | Down |
Transparency is a risk input, not a courtesy. If you cannot see which part of a business drives profit, you cannot judge what happens when that part stumbles.
Geopolitical and regulatory exposure: where Taiwan, China and Brussels bite
Geopolitical risk rarely bleeds slowly. It tends to arrive as a single headline, and each company’s exposure has a different shape. Three channels matter most:
- Taiwan: the physical chokepoint for advanced chips
- China and export controls: sales, tariffs and manufacturing
- EU regulation: antitrust, platform rules and privacy
Taiwan and chips
JPMorgan Private Bank flagged Taiwan as a serious vulnerability in December 2025, given advanced chip production’s exposure to blockade risk. Nvidia drops partly because its supply depends on that island. The counterpoint: Taiwan’s strategic importance creates strong incentives to protect supply, and firms are diversifying, though rebuilding that foundry ecosystem elsewhere takes years.
China, tariffs and export controls
Nvidia’s exposure is direct; its latest forecast reportedly assumed no China data-centre revenue in some scenarios (Economic Times, 14 October 2026). Apple drew 15.4% of FY2025 revenue from Greater China. Production data conflict: Bloomberg-linked reporting puts India at about 25% of 2025 iPhone output, while Counterpoint Research puts China at about 75% and India at 18%.
Read India’s share as 18-25% depending on the source. Either way, China remains Apple’s largest production base.
Apple chip supplier talks with Samsung Foundry and Intel show the company is trying to reduce Taiwan dependence, though yields and scale mean any meaningful volume shift is unlikely before 2027.
EU rules and privacy
Apple was fined €500M under the Digital Markets Act (DMA), the EU’s rulebook for large platforms, in 2025. Google faced a reported €890M fine in 2026, and its earlier €4.1B Android penalty was largely upheld, while Meta stays under scrutiny over its ad model, privacy and child protection. Scale and cash make fines manageable, and regulation can even entrench incumbents.
| Company | Main exposure | Ranking move |
|---|---|---|
| Nvidia | Taiwan supply, China export controls | Down |
| Apple | China production and sales | Down |
| Meta | Privacy litigation and EU scrutiny | Down |
| Alphabet | EU antitrust, relatively insulated from China | Up |
Privacy rules cost Meta and Alphabet, which monetise data, but can work in Apple’s favour. Ask yourself which of your holdings one headline would hit hardest.
Valuation cross-check and what it means for your portfolio
Quality and price are different questions. A strong ranking does not make a stock cheap.
Valuation cross-check
Forward P/E compares the share price with analysts’ expected earnings per share. A lower number means you pay less for each dollar of forecast profit, though faster growth can justify more.
| Company | Forward P/E (Zacks, 16 October 2026) | Valuation read |
|---|---|---|
| Apple | 34.89x | Relatively expensive |
| Microsoft | 26.73x | Middle of the pack |
| Nvidia | 25.84x | Relatively fair for its growth |
| Meta | 23.64x | Middle of the pack |
| Amazon | 19.29x | Middle of the pack |
| Alphabet | 16.86x | Relatively fair |
| Tesla | ~392x trailing (AOL, 4 September 2026) | Relatively expensive |
Warren Buffett’s rule of thumb Buying a wonderful company at a fair price beats buying a fair company at a wonderful price.
What history says
Columbia Threadneedle found the ten largest S&P 500 companies made up about 39% of the index in 2025, versus about 27% at the 1999-2000 peak. That top ten traded on a P/E of about 31, against 21 for the rest. The Nifty Fifty of the 1970s showed excellent companies can deliver poor returns when bought too dear, and the 2022 sell-off showed how fast a crowded group reprices when rates rise.
The Magnificent 7 selloff in June 2026 showed how quickly the group reprices together, as capex guidance forced investors to see these platforms as capital-intensive builders.
The counterargument is real: today’s leaders earn far more than dot-com favourites did. Goldman Sachs still warned in May 2026 that concentration raises sensitivity to a single catalyst, while Morningstar cautions that you may be less diversified than you think. Vanguard (April 2026) says the seven are not one trade, but concentration remains a genuine risk.
Owning seven businesses is not owning seven independent risks. Shared sensitivity to rates, growth expectations and AI spending means they can fall together.
Five portfolio steps
- Check your look-through exposure across every fund you hold.
- Use position limits or equal-weight approaches so a few names cannot dominate.
- Add genuinely different exposures: non-US shares, value, smaller companies, bonds or real assets.
- Separate business diversification from stock diversification.
- Rebalance systematically instead of trying to time a collapse.
Past performance does not guarantee future results. Valuation readings are subject to market conditions and may change quickly.
What the ranking changes, and what it does not
The seven differ sharply on margin durability, transparency and geopolitical exposure. They share strong balance sheets and a common sensitivity to the same macro forces. On the presenters’ scoring, Amazon finishes on top, with the team openly acknowledging some subjectivity.
That makes the framework a lens, not a verdict. Its value lies in the questions it trains you to ask of any stock.
Your next move is practical: add up your real exposure to these names across every fund you own. Then decide whether that number reflects a deliberate view or simply the index’s default.
This article is for informational purposes only and should not be considered financial advice. Investors should conduct their own research and consult with financial professionals before making investment decisions.