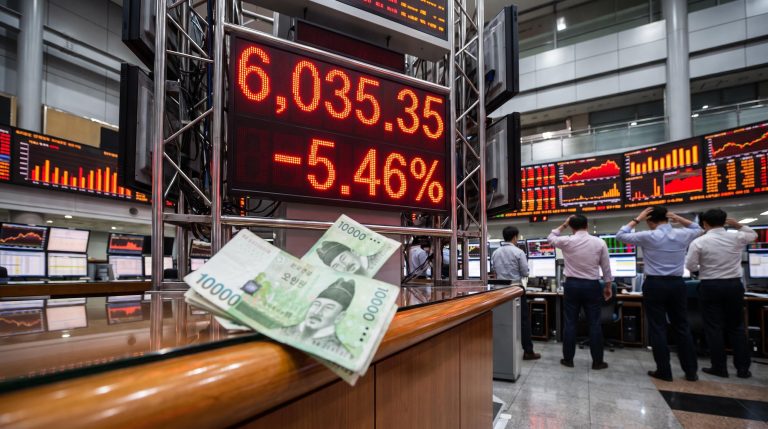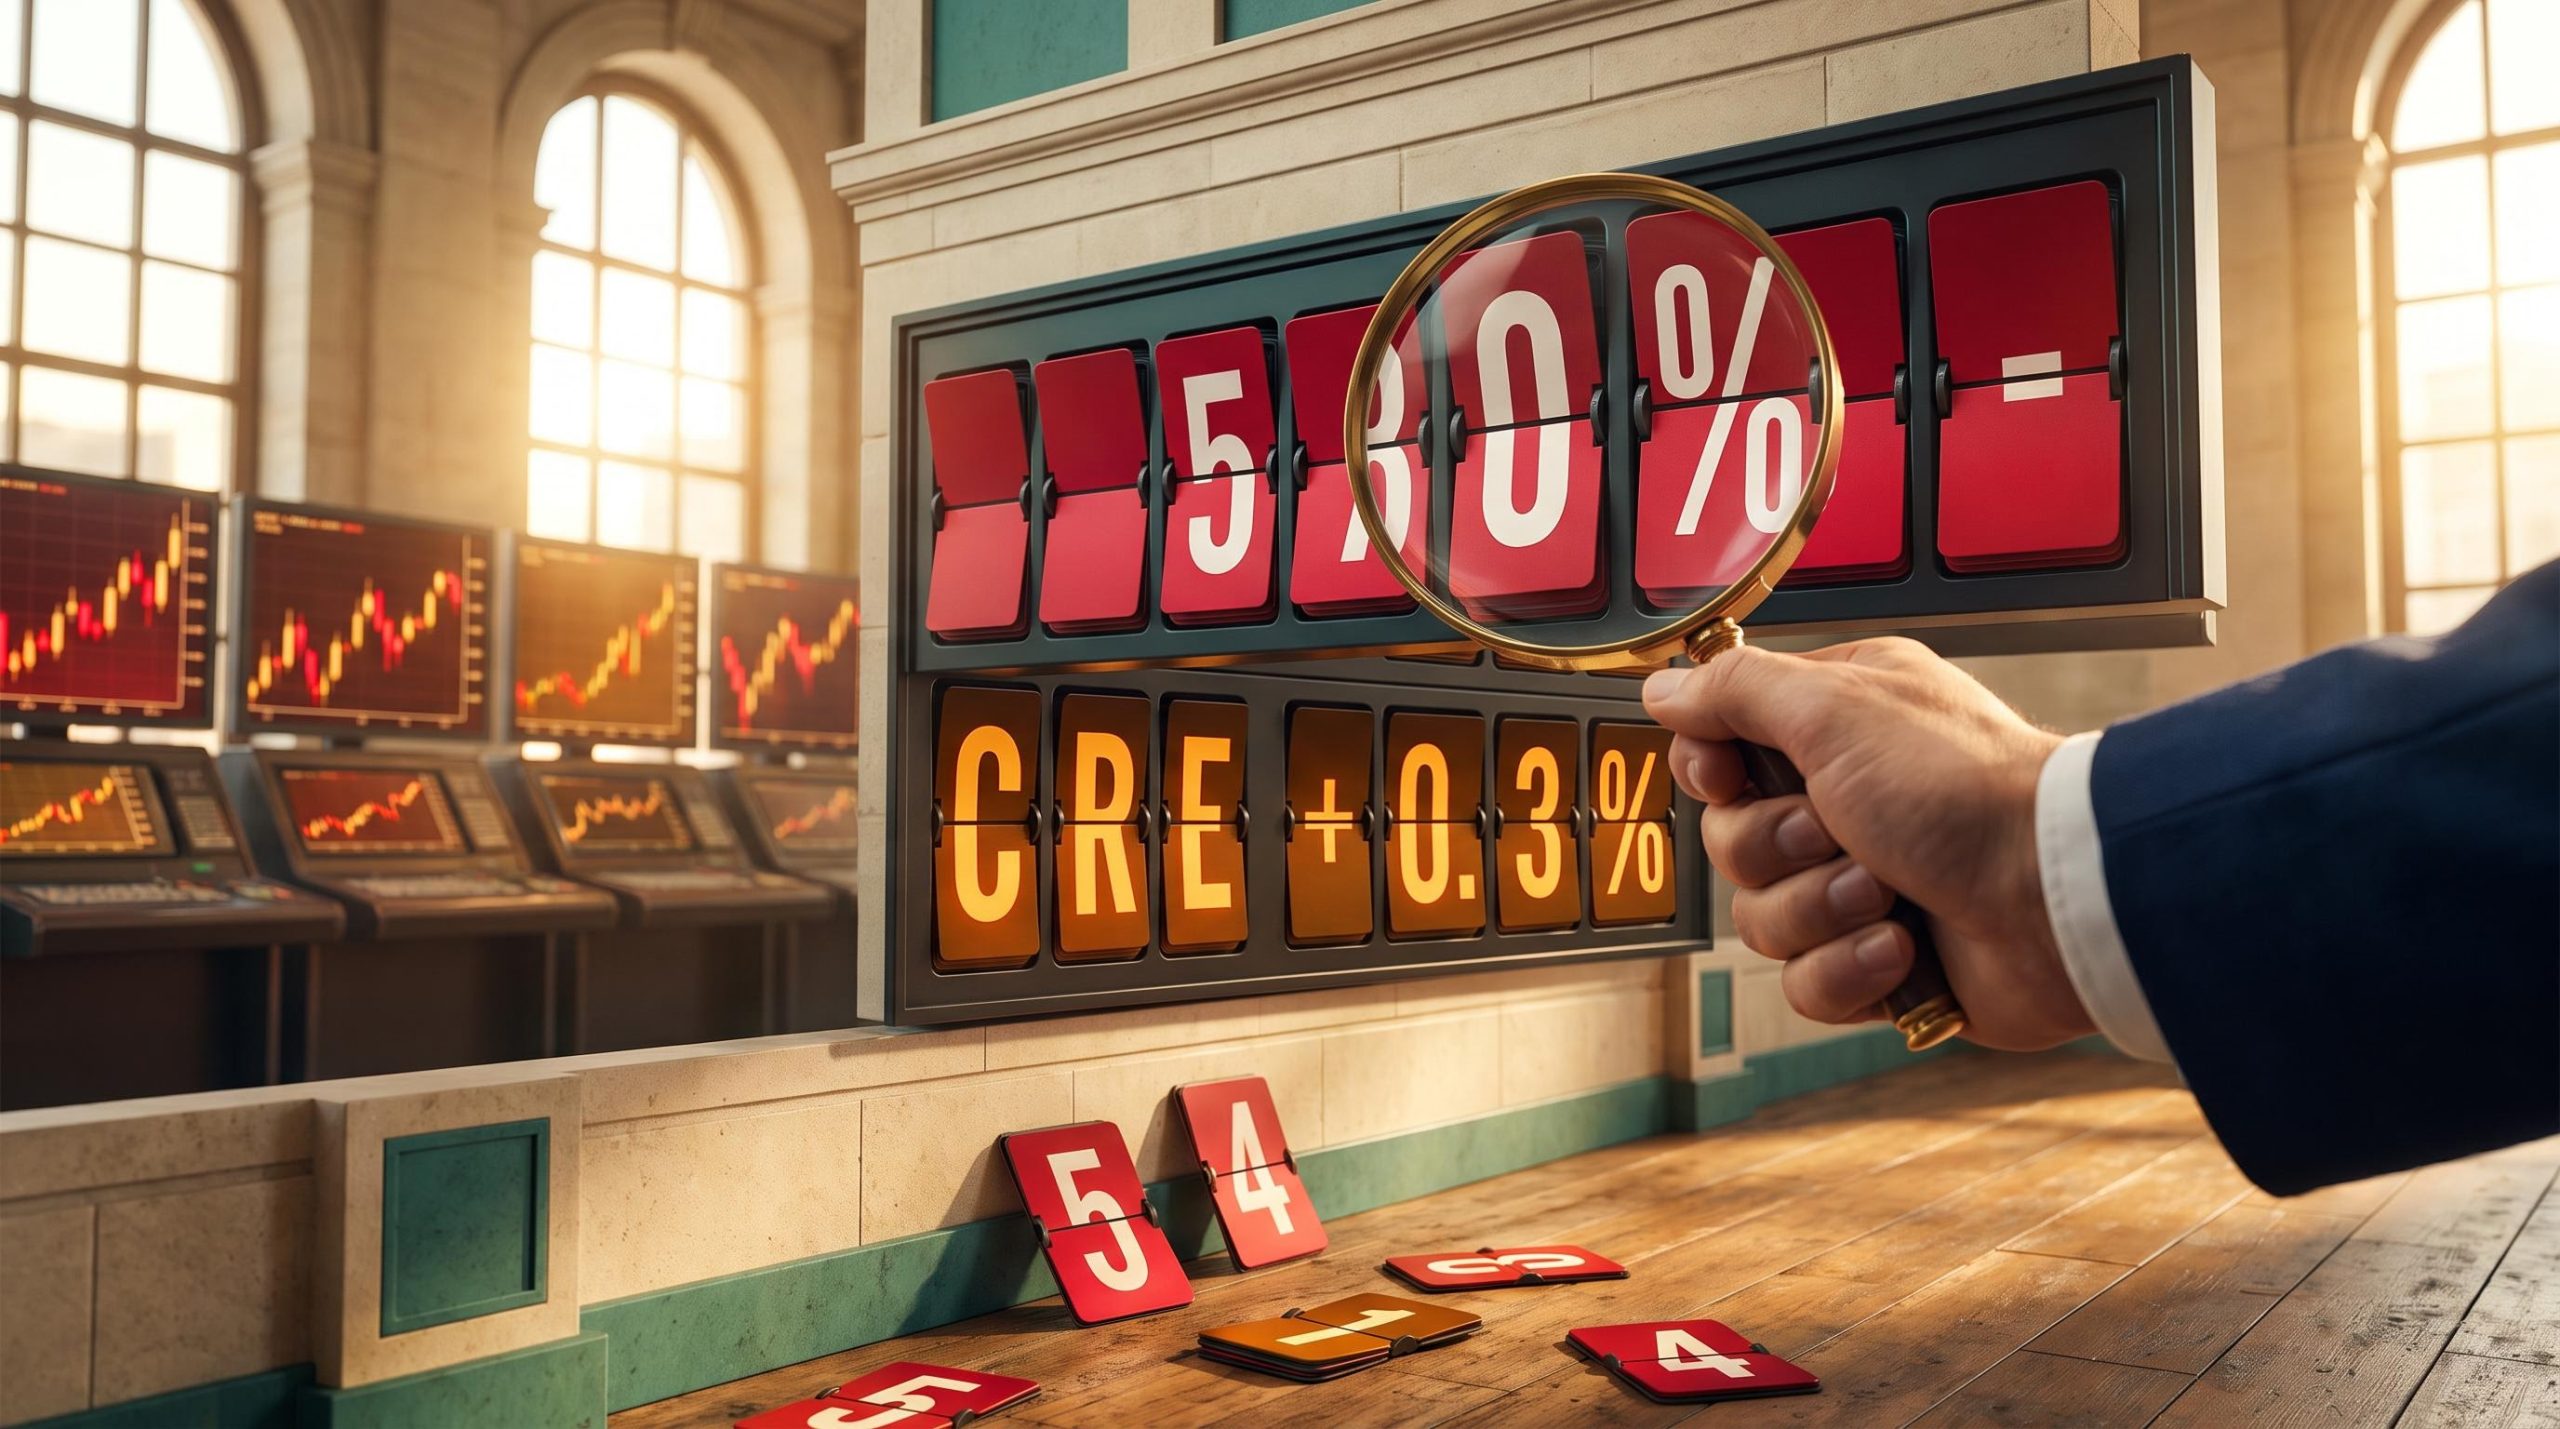
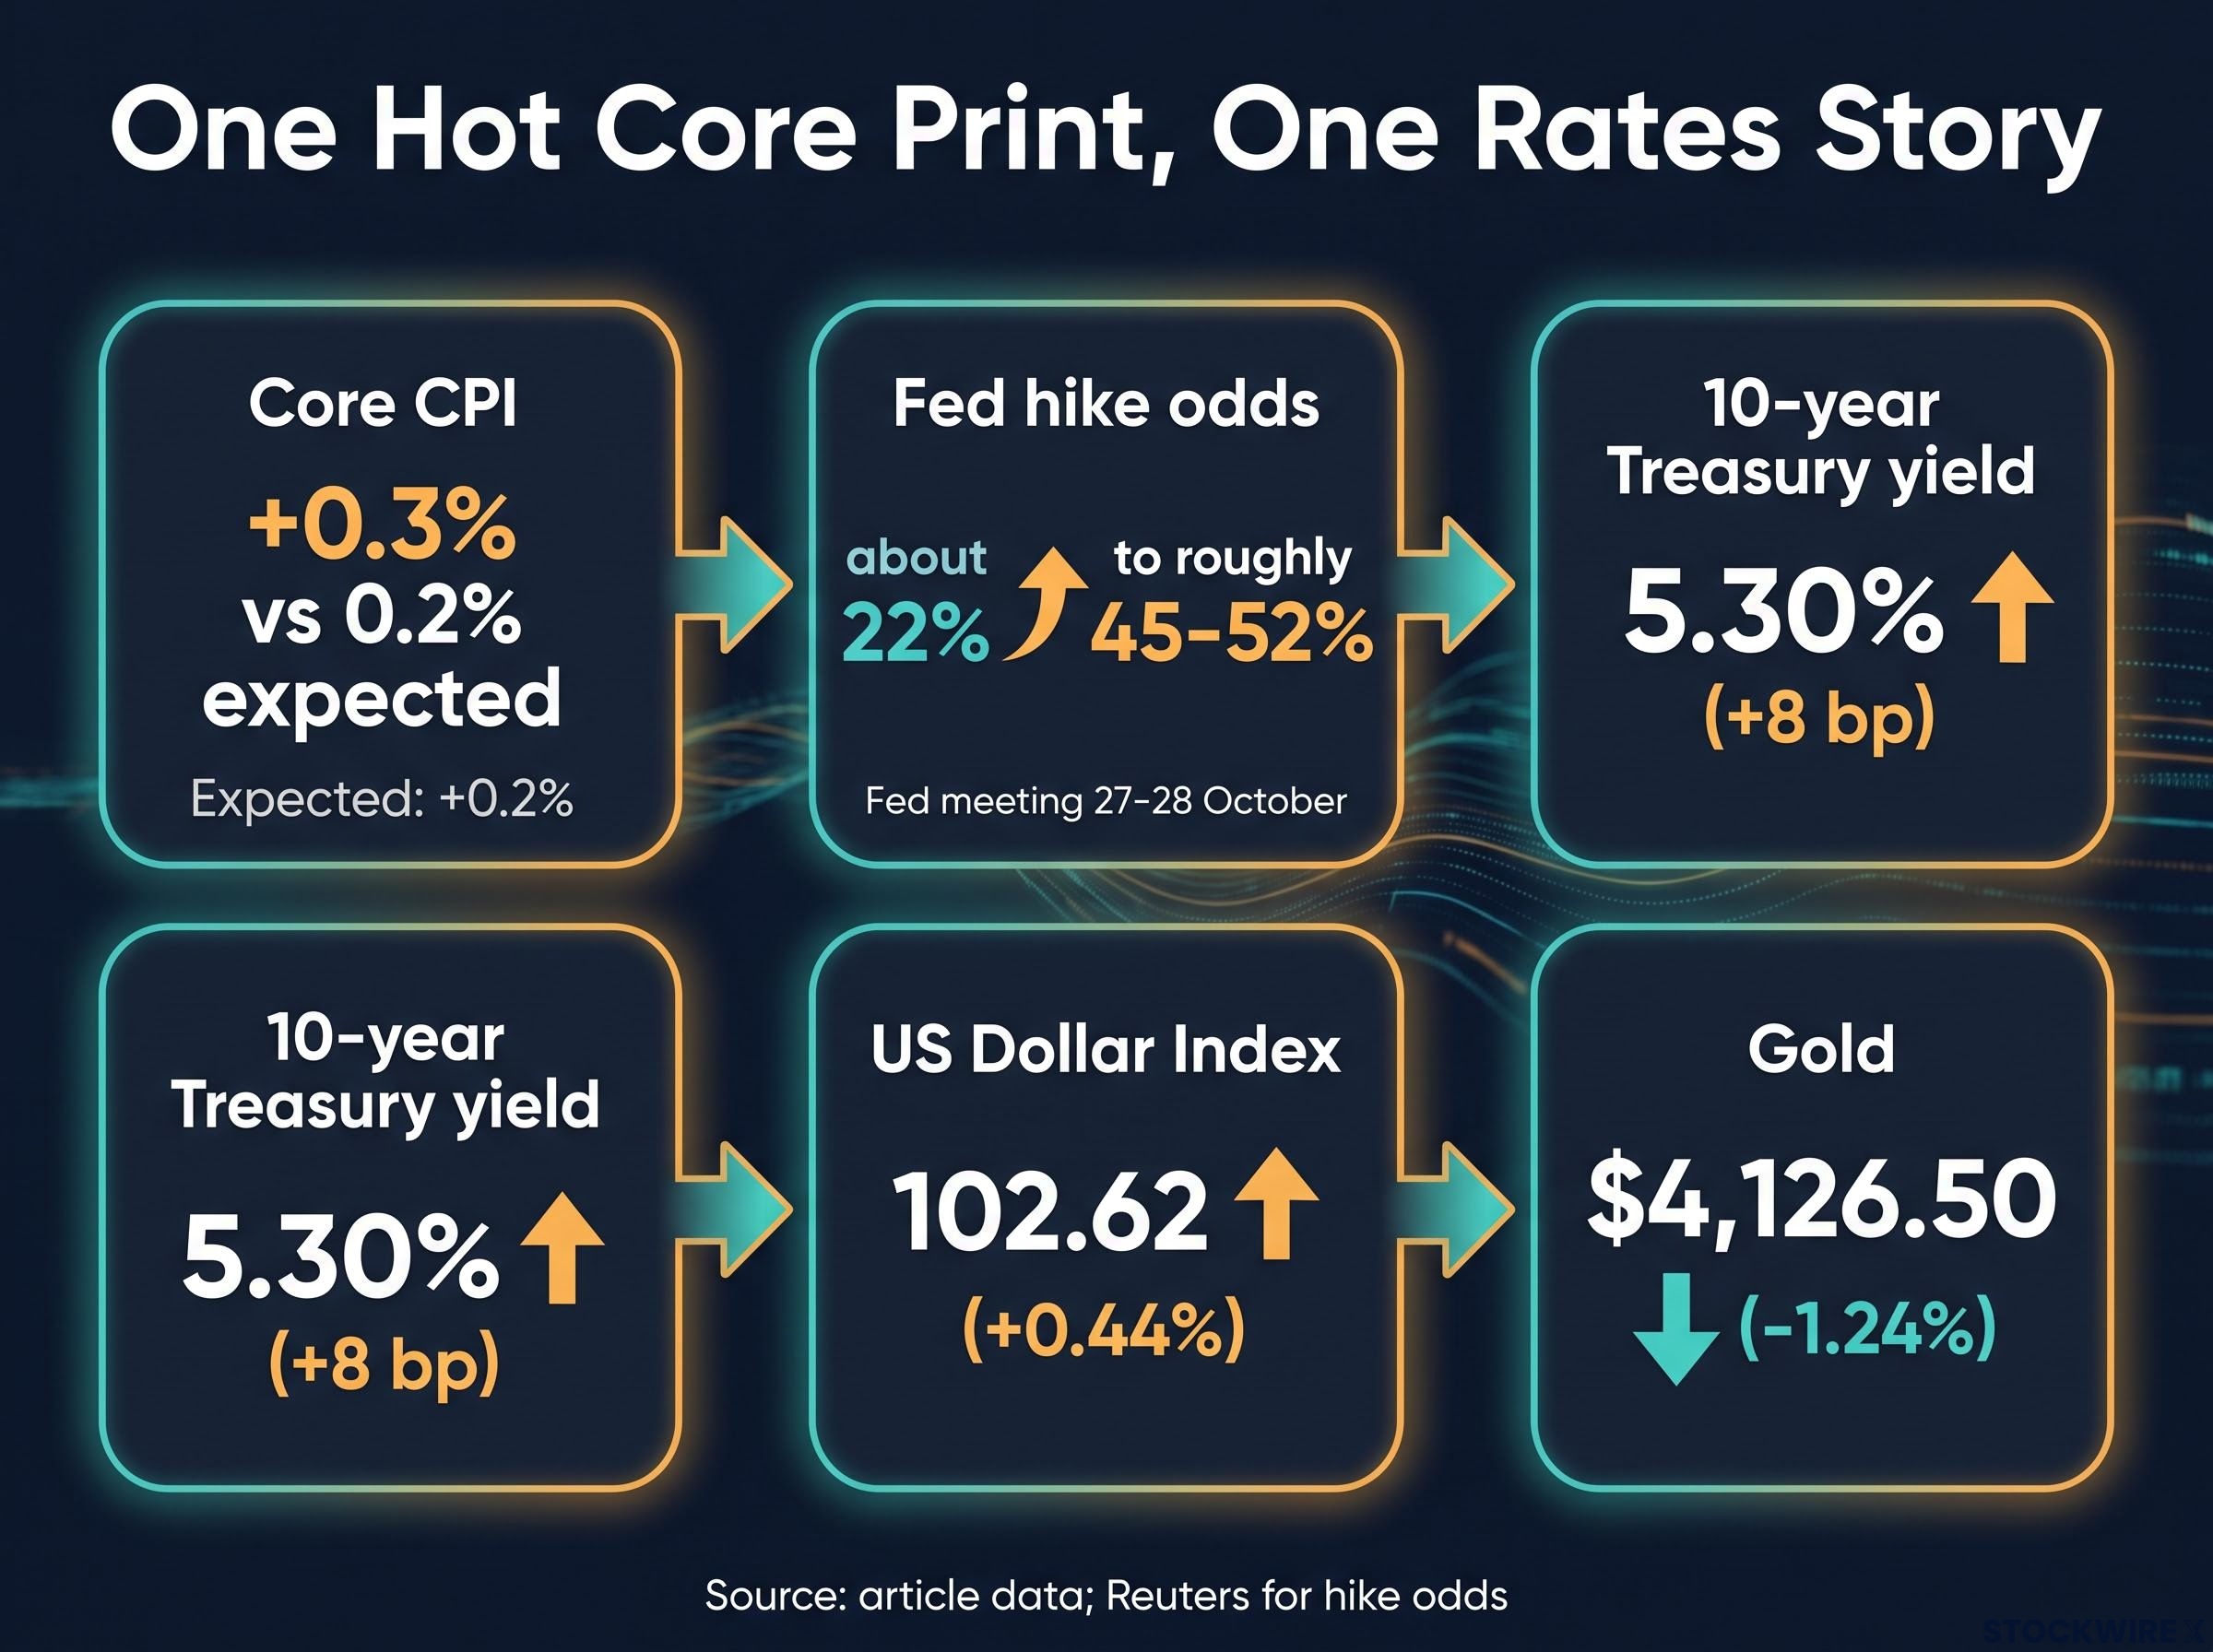
A headline inflation number that matches forecasts is supposed to be a non-event. The September 2026 Consumer Price Index (CPI) did match on its monthly headline, yet core prices rose 0.3% against an expected 0.2%, and the cross-asset reaction looked like a market that had been leaning the wrong way.
Today’s report from the Bureau of Labor Statistics, released on 14 October 2026, put an interest rate hike back on the table for the Federal Reserve’s 27-28 October meeting. According to Reuters, market-implied odds of a hike rose from about 22% to roughly 45-52%.
The damage was uneven, but it was not random. Tech, semiconductors, Treasuries, precious metals and the dollar all moved on the same rates story.
Here is a clear map of what moved, why those moves were linked, and which warning signals deserve serious attention versus a healthy dose of caution.
Why did a hot core print move bonds, the dollar, oil and metals in one direction?
Start with the numbers. Headline CPI rose 0.6% for the month, in line with consensus, but 3.7% for the year against 3.6% expected. Core CPI, which strips out volatile food and energy prices, rose 0.3% monthly and 2.6% annually, beating forecasts on both measures.
The core surprise carries more weight. It raises the risk that an energy shock is seeping into services, wages and input costs, where price pressure tends to linger.
From there, the transmission ran in sequence:
- Hotter core inflation lifted expectations for Fed tightening.
- Expected tightening pushed Treasury yields higher across maturities.
- Higher US yields drew capital into the dollar.
- A firmer dollar and higher real yields weighed on gold and silver, which pay no interest.
Hike odds reprice Reuters reported market-implied odds of an October hike rose from about 22% before the report to roughly 45-52% afterwards. Economists’ base case remained about one more hike by year-end.
| Asset | Reported level | Move | Why it moved |
|---|---|---|---|
| 10-year Treasury yield | 5.30% | +8 bp | Higher expected policy rates |
| US Dollar Index | 102.62 | +0.44% | Wider US yield advantage |
| WTI crude | $95.66 | +1.55% | Reinforces the inflation shock |
| Gold | $4,126.50 | -1.24% | Higher real yields and a firmer dollar |
The 30-year yield traded around 5.61% intraday. Silver broke a support trend line it had respected and now sits near its yearly low.
Not everyone sees October as settled. Martin Beck, chief economist at PPHC, argued that weak employment data and fragile consumer sentiment still leave the Fed room to hold.
What this tells you is that bonds, the dollar and metals are not separate stories when core inflation surprises. A position in any one of them is effectively a rates view, and gold’s weakness here reflects rates and the dollar, not fading inflation fear.
Why long-duration assets feel it first
High-multiple tech and semiconductor stocks earn much of their expected value years from now. When the discount rate (the return used to convert future cash flows into today’s dollars) rises, those distant earnings are worth less today.
Utilities show the paradox. They are defensive, yet they compete with bonds for income-seeking capital, and the Utilities Select Sector SPDR (XLU) fell roughly 1.3%.
When big ASX news breaks, our subscribers know first
What are the charts saying about tech and semiconductors?
On the surface, the equity reaction looked mild. Underneath, the session told a sharper story.
Index levels: two snapshots, two stories
A Charles Schwab market update showed the S&P 500 at about -0.02% and the Nasdaq Composite at about -0.15%. A later Tasty Live session recap showed S&P 500 futures (ES) about 55 points lower near 7,800, the Nasdaq down about 300 points (roughly 1%), the Russell about 1.3% lower and the Dow roughly flat.
Timing is the likeliest explanation. The Schwab figures appear to be an earlier in-session reading, while the Tasty Live numbers reflect the session lows.
A note of caution Sources disagree on the size of the decline. Treat the Schwab figures as an early snapshot and the Tasty Live figures as the session lows, not the final close.
The technical signals
Tim, a short-biased trader on Tasty Live, reads tech and semiconductors as rolling over. His view is short-term and should be read as one trader’s positioning, not consensus.
He is watching three signals:
- An island reversal on QQQ and XLK around the prior Wednesday or Thursday, followed by persistent declines.
- Semiconductor charts, including SMH, maturing from messy price action into clearer breakdown patterns.
- ES breaking below the prior week’s low after chopping sideways for about a week, with no clear catalyst now that data releases have passed.
An island reversal occurs when prices gap up, trade briefly at the higher level, then gap back down, leaving a cluster of trading days isolated above the surrounding price action. Traders read it as a sign that buyers have been trapped.
Tim’s book holds SMH, individual semiconductor shorts and quantum names such as IonQ. He cited election-period concerns as added downside risk, and noted Intel was down but not an attractive trade for him.
His sizing is the more instructive detail. He cut exposure to 150% committed (full cash plus 50% margin) from 200%, staying heavily short while wary of a surprise.
The read you should take from this is that technical signals describe how a trader is positioned for a short-term move. They are inputs for managing risk, not forecasts.
Is the equal-weight gap and the KORU pattern a genuine warning?
The concern extends beyond semiconductors. Breadth, meaning how many stocks are participating in a move, has been deteriorating for weeks.
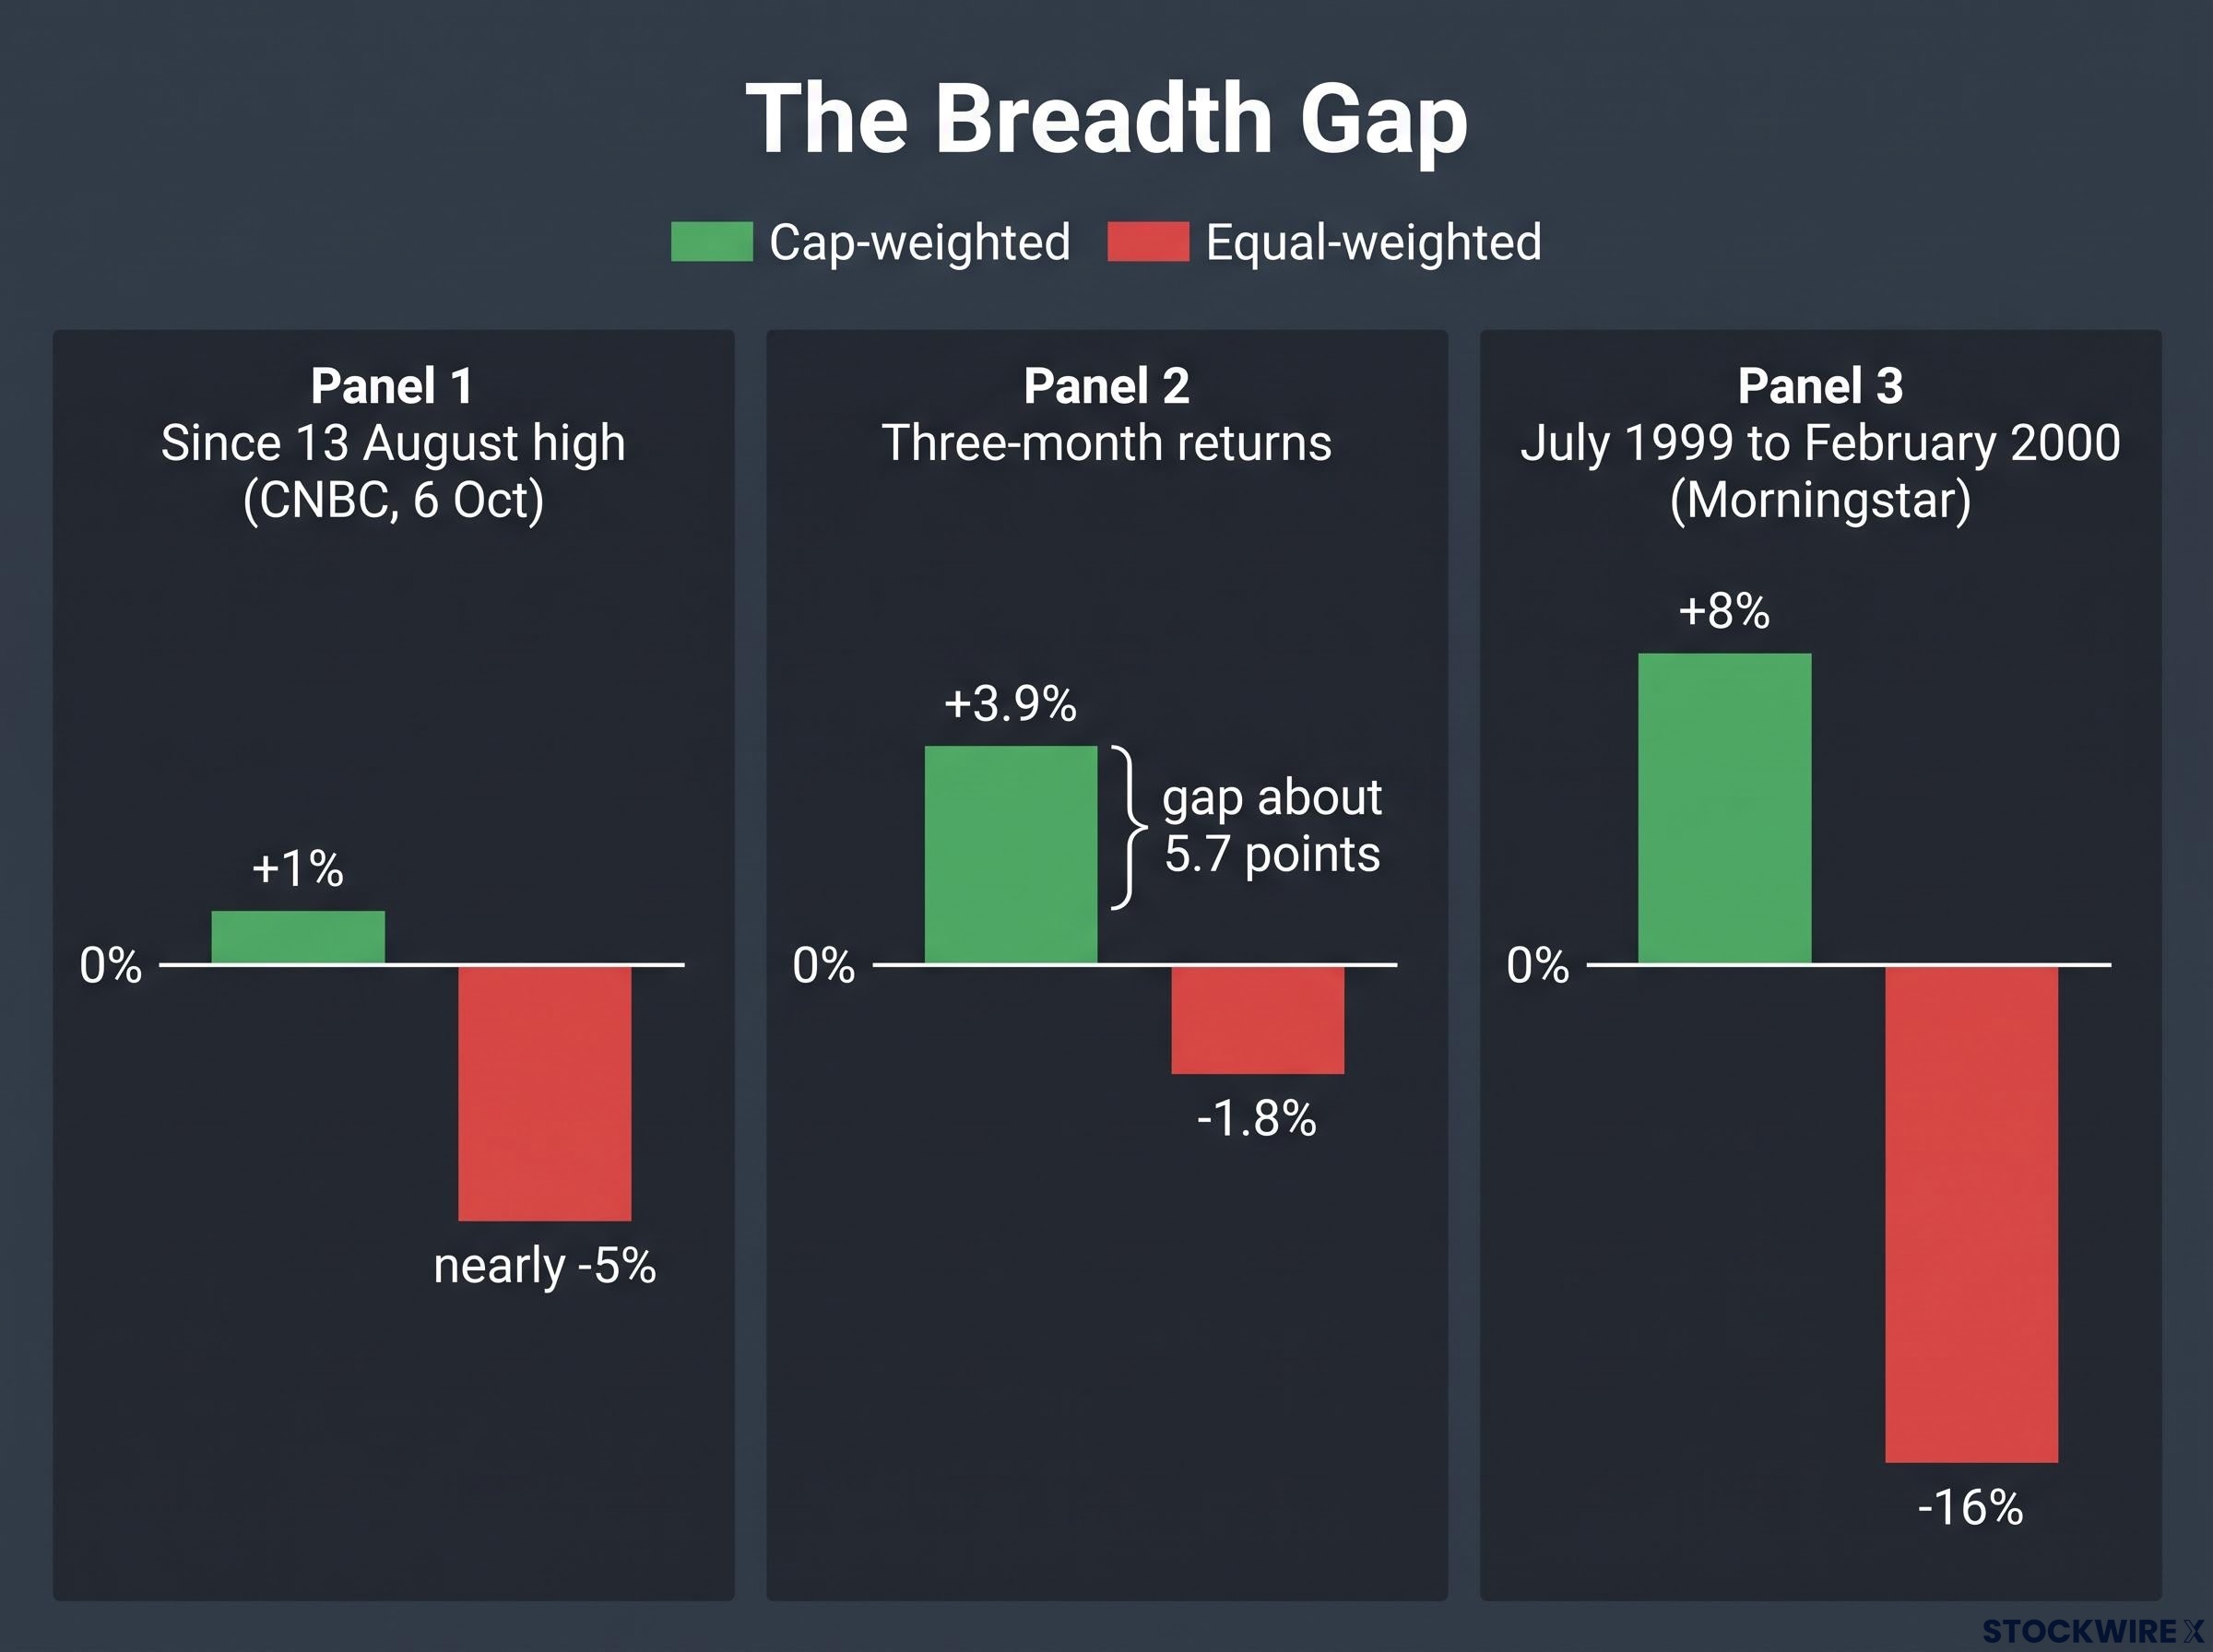
CNBC reported on 6 October that since the 13 August high, the cap-weighted S&P 500 was about 1% higher while the equal-weighted version, which gives every company the same weight, was nearly 5% lower. A later report put three-month returns at about +3.9% against -1.8%, a gap of about 5.7 points.
Tim described the gap as unprecedented. Published reporting called it one of the widest on record and, citing Dow Jones Market Data, the largest since 2002, which is extreme but not proven to be an all-time record.
The 1999-2000 precedent According to Morningstar, from July 1999 to February 2000 the equal-weighted S&P 500 fell 16% while the cap-weighted index rose 8%. The headline index later fell 17% in late December 2000.
Korea added to the unease. Tim reads KORU, a 3x leveraged Korea ETF that fell almost 8%, as forming an unusually clean head-and-shoulders top, a pattern of three peaks with a higher middle one that traders associate with trend reversals.
| Stock | 13 Oct move | Move since Monday open | Notes |
|---|---|---|---|
| SK Hynix | -10.09% | About -15% | Five straight losing sessions |
| Samsung Electronics | -7.39% | About -13% | Five straight losing sessions |
| Micron | About -5% | n/a | n/a |
| KOSPI | n/a | n/a | About -5-6% across the sell-off |
Here is the caveat. Korean memory stocks had been under pressure for about three weeks, and the drivers were not US CPI:
- Reports of progress by China’s CXMT on a new DRAM architecture.
- Doubts that AI memory demand and capex expectations had run too far.
- Heavy foreign selling targeting Samsung and SK Hynix.
- Fading share buyback support.
CPI was an extra layer on technology weakness that already existed. Narrow leadership means index-level calm may be masking losses in most stocks, so a diversified index fund may be less protective than it appears.
What could make the bearish reading wrong, and what should you watch next?
Conviction is easy to build from one session. The evidence supports a more humble conclusion.
Cyclical or structural?
The cyclical reading treats this as an ordinary rates shock driven by energy and temporary supply effects. If oil falls or core moderates, yields could reverse and growth stocks could recover.
The structural reading sees persistent inflation from supply-chain regionalisation, labour constraints, fiscal deficits and geopolitical fragmentation, pointing to a permanently higher rate regime. One CPI print cannot tell them apart.
According to Reuters, Fed officials want evidence that price pressure is broadening beyond energy. Kiplinger suggested the September hike may be the start of further tightening rather than the end.
Where the patterns can fail
History shows the same chain can run in reverse.
| Episode | Inflation result | Rates and dollar response | Equity response |
|---|---|---|---|
| 10 Nov 2022 | Headline +0.4% vs +0.6% expected | 10-year down about 31 bp to 3.829%; dollar fell sharply | Dow +3.44%, S&P 500 +5.10%, Nasdaq +6.72% |
| 14 Oct 2026 | Core +0.3% vs +0.2% expected | 10-year to about 5.30%; dollar up about 0.4% | Modest early declines; Nasdaq about -1% at session lows |
Signals that would undercut the bearish view include:
- QQQ and XLK reclaiming the island-reversal gap.
- KORU failing to make a decisive neckline break, ideally on rising volume.
- A short squeeze triggered by softer inflation, lower oil or dovish Fed commentary.
- Breadth staying weak for months without a headline break, as it can.
Election-period volatility, driven by fiscal, tariff, energy and regulatory expectations, also makes it risky to pin every move on CPI. The same data can support a bearish case or a recovery, so the next oil move, the next core print and the Fed decision matter more than any chart.
Past performance does not guarantee future results. Forward-looking views here are speculative and subject to change based on market developments.
What the print settles, and what it leaves open
The report confirmed the rates-and-dollar chain: a hot core number lifted yields and the dollar, pressured metals and repriced long-duration equities. What it did not cause was the depth of the tech and Korean weakness, which predated the release.
Breadth and chart signals point to fragility, not a timetable. The bearish trader views covered here belong to Tim on Tasty Live and reflect short-term positioning.
Three things will decide which reading holds:
- The 27-28 October Fed meeting and how hike odds move into it.
- The oil price and whether energy keeps feeding core inflation.
- Whether QQQ and XLK reclaim the island-reversal gap.
Your next decision depends more on those three answers than on today’s tape.
This article is for informational purposes only and should not be considered financial advice. Investors should conduct their own research and consult with financial professionals before making investment decisions.