The Federal Reserve official who said one more rate hike may still be appropriate also said he sees no reason for more in 2027. The dollar slipped anyway. The dollar index (DXY), which tracks the US currency against a basket of major peers, was trading at about 102.15 in Asian hours on 14 October 2026.
That reaction hints at what markets are really pricing. The September US consumer price index (CPI) release is now the next test of whether traders treat a December hike as the last one.
With roughly 83% odds already priced for a December move, the headline decision is largely settled. Any surprise sits in the details, particularly core inflation. All September CPI figures cited here are pre-release consensus forecasts, not results.
This piece sets out what is already in the price, which CPI outcomes could move the dollar, and the chart levels that frame the range.
Why did the dollar slip when Williams backed one more hike?
On the surface, the message from New York Fed President John Williams sounded hawkish. In a Bloomberg interview on 13 October, he restated that a further 2026 hike may be appropriate.
John Williams, President, Federal Reserve Bank of New York “I haven’t changed my view that it may be appropriate to have one more rate hike.”
The second half of his message carried more weight. Williams said he had no current reason to expect further tightening in 2027 and expects inflation to fall “quite a bit” next year, close to the 2% target. He described tariff effects as fading, flagged energy and AI-related investment as upside risks, and said the labour market was not adding materially to inflation.
That pairing set a firm endpoint for the near term and a softer path beyond it. It also echoed his 29 September remark that there was “no need for urgency”.
Futures had already absorbed most of it. The Fed lifted its target range to 3.75%-4.00% with a 25 basis point (bp) hike in September, after August headline CPI came in at 3.4% year on year and core at 2.4%. A basis point is one hundredth of a percentage point. Scotiabank estimates about 5 bps of tightening priced for October and 25 bps by December.
| Item | Latest reading | Prior or comparison | Source |
|---|---|---|---|
| October hold probability | ~77-82% | 51% a month earlier | CME FedWatch |
| December 25 bp hike probability | ~83-85% | Hold ~15-17% | CME FedWatch |
| Fed funds target range | 3.75%-4.00% | After 25 bp September hike | FOMC statement |
| FXS Fed Sentiment Index | 133.86 | Down 3.09; neutral is 100 | FXStreet |
CME FedWatch probabilities are market-implied from federal funds futures, not Fed forecasts. Snapshots conflict because futures move quickly.
FXStreet’s Speechtracker scored Williams at 3.4/10 against a 5.8 historical average: a softer tone with a still-hawkish stance. When a Fed speaker only confirms what futures already price, the dollar needs new information to climb. That shifts the weight onto the CPI print.
With no forward guidance from the Fed, inflation prints rather than official signals now drive rate expectations, which is why a single core CPI reading can reshape the whole policy path.
When big ASX news breaks, our subscribers know first
How do rate hikes, QE and QT actually move the dollar?
Why would a single central bank decision move a whole currency basket? The answer starts with what the DXY measures. It is a trade-weighted index of the dollar against the euro, yen, pound, Canadian dollar, Swiss franc and Swedish krona, using fixed weights.
Because the dollar features in over 88% of global foreign exchange turnover, about $6.6 trillion a day based on 2022 data, Fed policy carries well beyond US borders. That reach dates back to the dollar replacing sterling as the main reserve currency after the Second World War, with gold backing abandoned in 1971.
The Fed’s dual mandate is price stability and full employment. When inflation runs above 2%, it tends to raise rates, which lifts US yields and draws in global capital.
| Fed tool | What it does | Typical USD effect | Example |
|---|---|---|---|
| Rate hike | Raises borrowing costs and yields | Tends to support | September 2026 25 bp move |
| Rate cut | Lowers borrowing costs | Tends to weigh | Used when inflation is low or unemployment high |
| Quantitative easing (QE) | Creates dollars to buy bonds | Usually weakens | Deployed during the 2008 crisis |
| Quantitative tightening (QT) | Halts bond buying and reinvestment | Usually supports | Shrinks the Fed’s balance sheet |
The detail that matters for you is that currencies trade on the expected path of rates, not the level alone. A December hike that is already priced may do little for the dollar on its own.
The pull of rate differentials explains why a hike that is already priced can leave the dollar flat, since capital flows respond to the gap in yields against peers rather than to the level of US rates alone.
Headline versus core CPI: which one the dollar follows
Headline CPI includes food and energy, so it swings with petrol prices. Core CPI excludes them to show underlying inflation.
Core is the likelier trigger for repricing the policy path, because it tells the Fed whether price pressure is spreading. Keep the 2.5% core consensus in mind for the scenarios below.
Where are the key DXY levels heading into the CPI release?
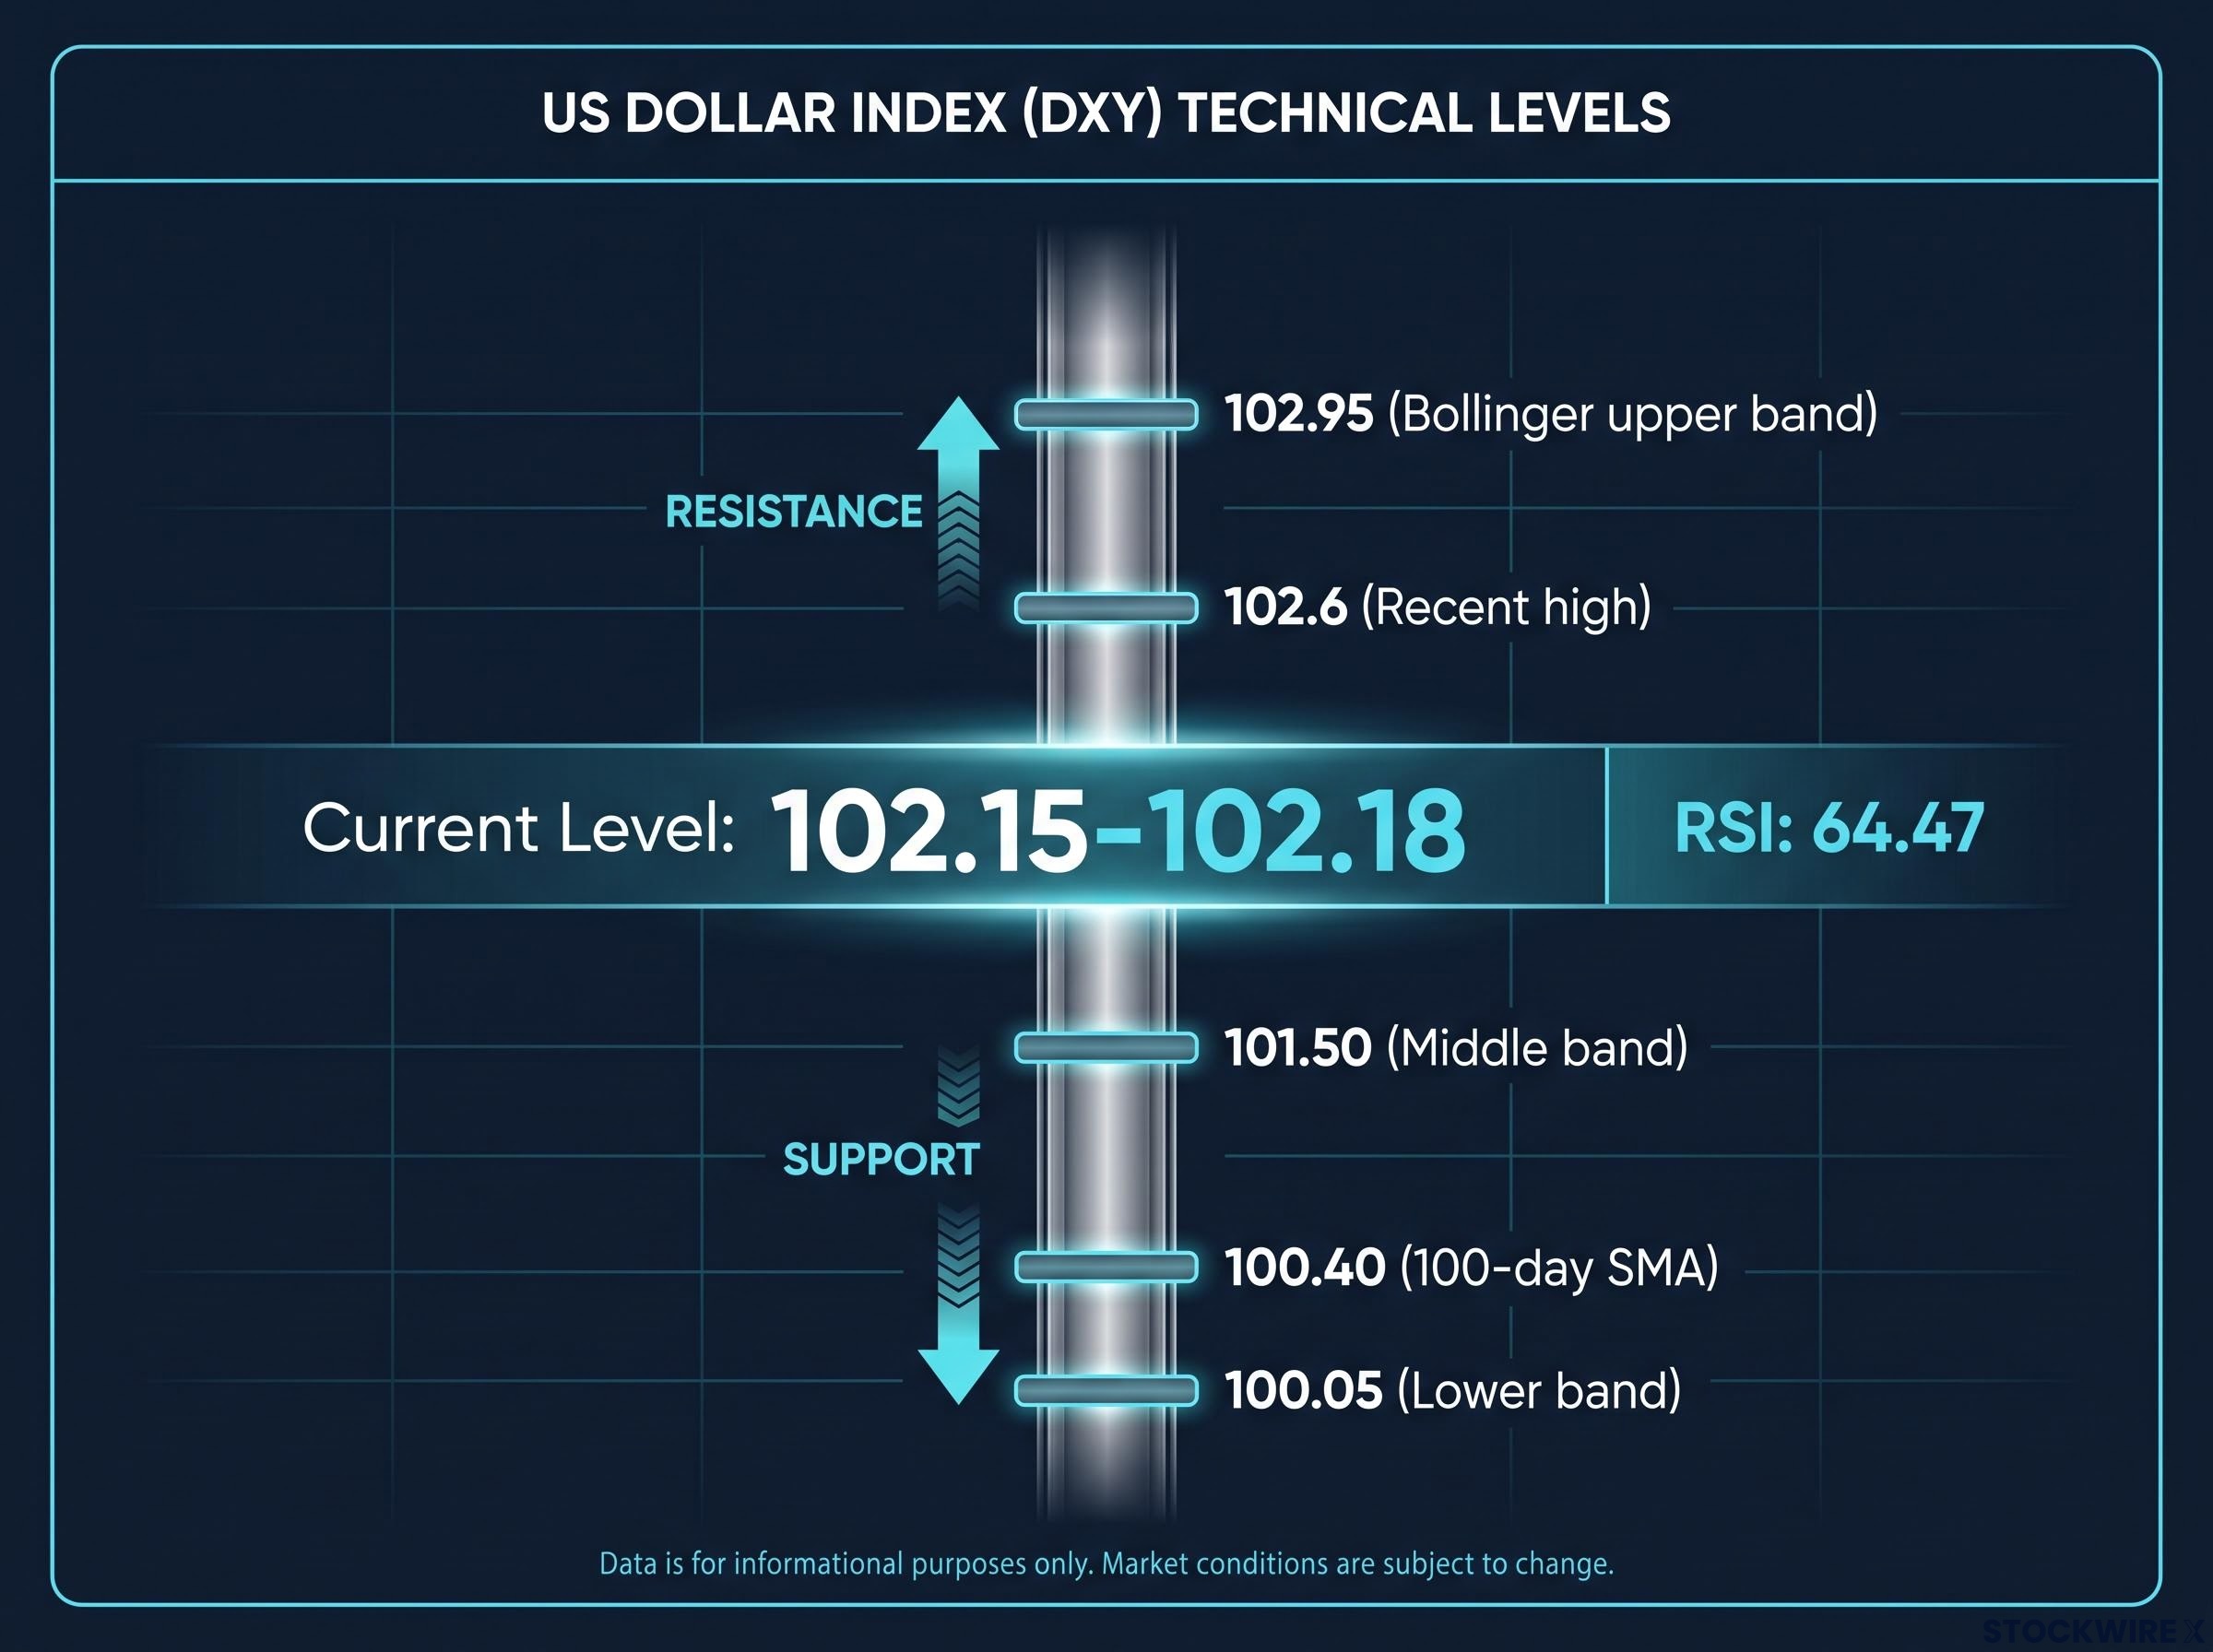
On FXStreet’s daily chart, the index sits around 102.15-102.18, above both its Bollinger middle band and 100-day simple moving average after bouncing off lower band support. Bollinger bands plot a moving average with upper and lower bands based on volatility. The relative strength index (RSI), a momentum gauge, reads 64.47: firm, but short of overbought.
These levels come from FXStreet daily-chart analysis and are not forecasts:
- 102.95 (Bollinger upper band): the main ceiling, where gains could stall into consolidation.
- 102.6 (recent high): the first test for any CPI-driven rally.
- 101.50 (middle band): the first support if the dollar fades.
- 100.40 (100-day SMA): a deeper floor that keeps the medium-term structure intact.
- 100.05 (lower band): the bottom of the working range.
That map shows a defined corridor with the dollar in its upper half. Fundamental views lean against a breakout.
Kit Juckes, Societe Generale (13 October) The latest repricing leg is becoming stretched, and further dollar gains probably need a significant upside surprise in core CPI or a higher terminal-rate expectation.
Scotiabank adds that the DXY sits above its fair-value estimate and that narrowing rate differentials are negative for the dollar, with a light data calendar before CPI. Momentum is firm, but the upside looks gradually stretched. You should treat a break above 102.95 as needing a genuine inflation surprise, not just confirmation of December.
Investors wanting to read the Bollinger and RSI levels with more rigour will find our deep-dive into DXY technical analysis ties the EMA and RSI framework back to Fed policy.
What could the September CPI do to the dollar, and what could go wrong?
Newsquawk’s pre-release consensus, cited by SpinDepth, points to headline CPI of 0.6% month on month and 3.6% year on year, with core at 0.2% and 2.5%. The jump in headline reflects energy: August gasoline CPI rose 3.9% in the month and energy 2.1%.
| Scenario | Core CPI vs 2.5% | Likely rate repricing | DXY implication |
|---|---|---|---|
| Upside surprise | Above | December odds rise; 2027 path may be questioned | Could push through 102.6 toward 102.95 |
| In-line | At | December confirmed as likely final hike | Range-bound, upside capped |
| Downside surprise | Below | December pricing trimmed | Pressure toward 101.50 support |
These implications are conditional illustrations, not predictions. The actual September CPI figure was unavailable at the time of writing.
The asymmetry matters most. A print that only confirms December changes little, while one that alters 2027 expectations reshapes the whole path. Core at or below 2.5% supports December as the final hike and caps the dollar; an upside core miss is what would test the range mapped above.
Market consensus favours one final hike, probably in December, then a prolonged hold. Competing readings persist: that December is delayed rather than cancelled, that energy, AI investment and fiscal demand force a broader cycle, or that fading tariffs and a quiet labour market make further hikes unnecessary. Williams himself flagged energy, the Middle East conflict and AI-driven electricity demand as risks.
Risks beyond the print
- Rate differentials: if the Fed stops while the ECB or Bank of England stay restrictive, the US yield edge narrows.
- Treasury and fiscal pressure: heavy issuance and deficits can lift yields without making the dollar more attractive.
- Energy reversal: falling oil weakens the hike case, while a fresh Middle East shock strengthens it.
- Late-cycle hike risk: a hike read as a response to a weakening economy can reverse its initial support.
The reserve-currency debate is a medium-term factor rather than an immediate one. Together, these risks warn against reading the dollar through one data point.
What the CPI can confirm, and what it cannot settle
A probable December hike gives the dollar support, but Williams capped the longer-term path and futures have priced most of the near-term story. That leaves limited room on the upside unless inflation surprises.
The key variable is whether core CPI validates the 2.5% forecast. Above, watch 102.6 and 102.95; below, 101.50 and 100.40.
After the release, check three things: whether core diverged from headline, how December odds on CME FedWatch shifted, and whether any repricing extended into 2027. If only December moves, the range likely holds. If 2027 moves, the map changes.
For investors, the portfolio implications of a final hike extend beyond currency, since higher discount rates and duration risk reach equities and bonds well before the dollar settles into any new range.
Past performance does not guarantee future results. Financial projections are subject to market conditions and various risk factors. These statements are speculative and subject to change based on market developments.
This article is for informational purposes only and should not be considered financial advice. Investors should conduct their own research and consult with financial professionals before making investment decisions.