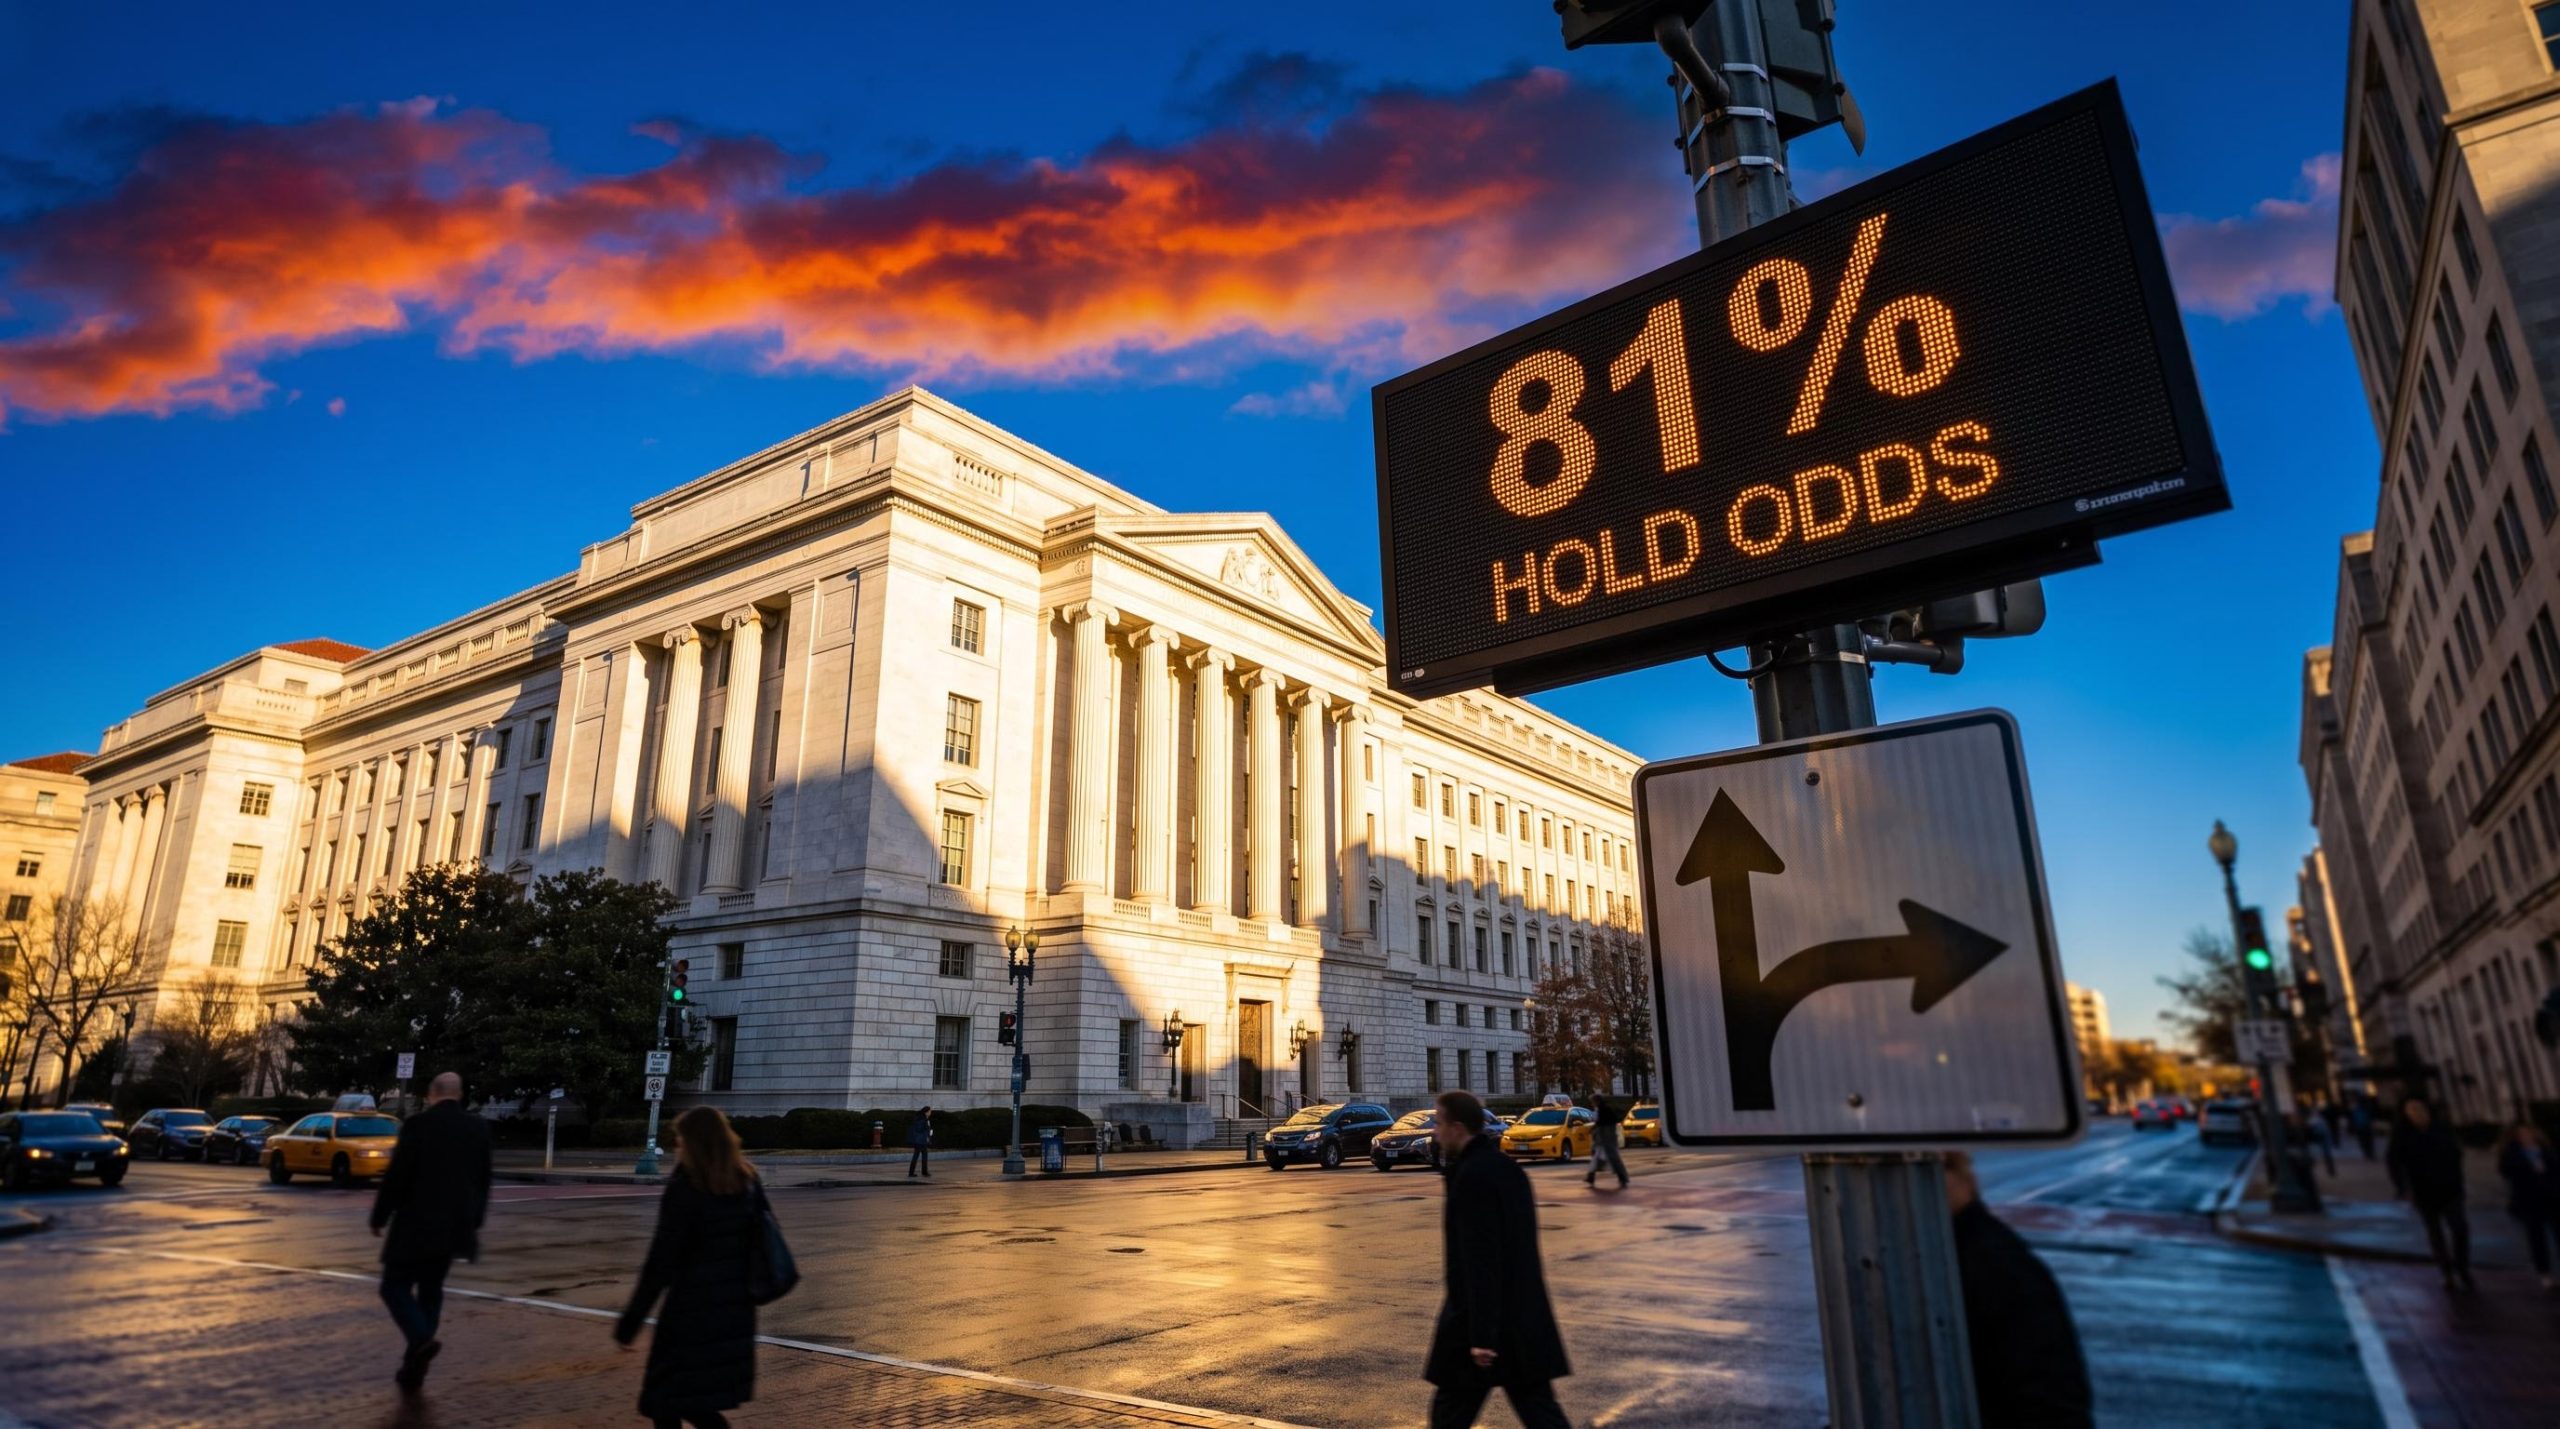
Markets price roughly an 81% chance that the Bank of England (BoE) raises interest rates in November, yet sterling is sliding anyway. GBP/USD traded near 1.3210 on Wednesday 7 October 2026, after peaking close to 1.3276 earlier in the session, and this analysis shows why the usual rule failed. Higher rate odds are supposed to support a currency. This week they have not.
The pressure is coming from both sides of the Atlantic. US Treasury yields have climbed to multi-year highs since US-Iran hostilities resumed, lifting demand for the dollar. At the same time, UK-specific stress is building: 30-year gilt yields sit at or near 6%, and the Autumn Budget arrives on 28 October.
The result is a pair trading at its lowest level since late June, according to broker TMGM.
Here is how those forces connect, from oil prices and bond markets through to the specific chart levels traders are watching, so you can read the next move in sterling rather than react to it.
Why is a hawkish Bank of England not lifting sterling?
On paper, today should have been a better day for the pound. BoE policymaker Catherine Mann and Governor Andrew Bailey both made hawkish remarks suggesting a rate change may be coming. Yet the pound still fell, and their comments only limited the size of the decline.
The explanation starts with where the hike pressure comes from.
Hike odds are already in the price
Elevated energy costs have pushed the BoE toward tightening after a year of holding rates steady. Reuters reported on 16 September that markets priced about an 80% chance of a quarter-point November hike, with investors expecting around four increases over the next year. Money-market pricing cited by FXStreet now sits at 81%.
That expectation is largely absorbed. When a hike is close to fully priced, hawkish talk confirms what the market already believes rather than adding new support.
Markets trade on surprises rather than rate levels, and MPC dissent, forward guidance and global factors such as Fed policy often matter more to sterling than the headline decision itself.
The deeper problem is what is driving those expectations. Energy-led inflation raises the case for BoE tightening, but it also pushes up gilt yields and government borrowing costs. That erodes confidence in the UK’s fiscal position, which works against the currency even as rate odds climb.
What a 6% gilt yield signals
A gilt is a bond issued by the UK government to borrow money. The 30-year gilt yield moved to around 6% during the recent sell-off, its highest level since 1998, which means the government now pays far more to borrow over the long term.
Not every investor reads this as a warning sign.
The counterpoint: Franklin Templeton Despite near-certain November hike pricing, Franklin Templeton described gilts as “particularly attractive” in comments reported by Reuters, arguing that a cooling labour market and a softer outlook will leave BoE policy looser than markets expect.
What this means for you is that hike odds alone are an unreliable sterling signal. When yields rise because of fiscal worry rather than confidence in growth, the currency can fall right alongside them, and that is the gap between the UK’s rate story and its credibility story.
When big ASX news breaks, our subscribers know first
How are US yields and the Iran energy shock powering the dollar?
If UK fiscal stress explains why sterling cannot rally, the other half of the picture explains why the dollar keeps climbing. The chain runs from the Middle East to bond markets in a few steps.
- Hostilities resume: Renewed US-Iran conflict revives fears of a prolonged energy shock.
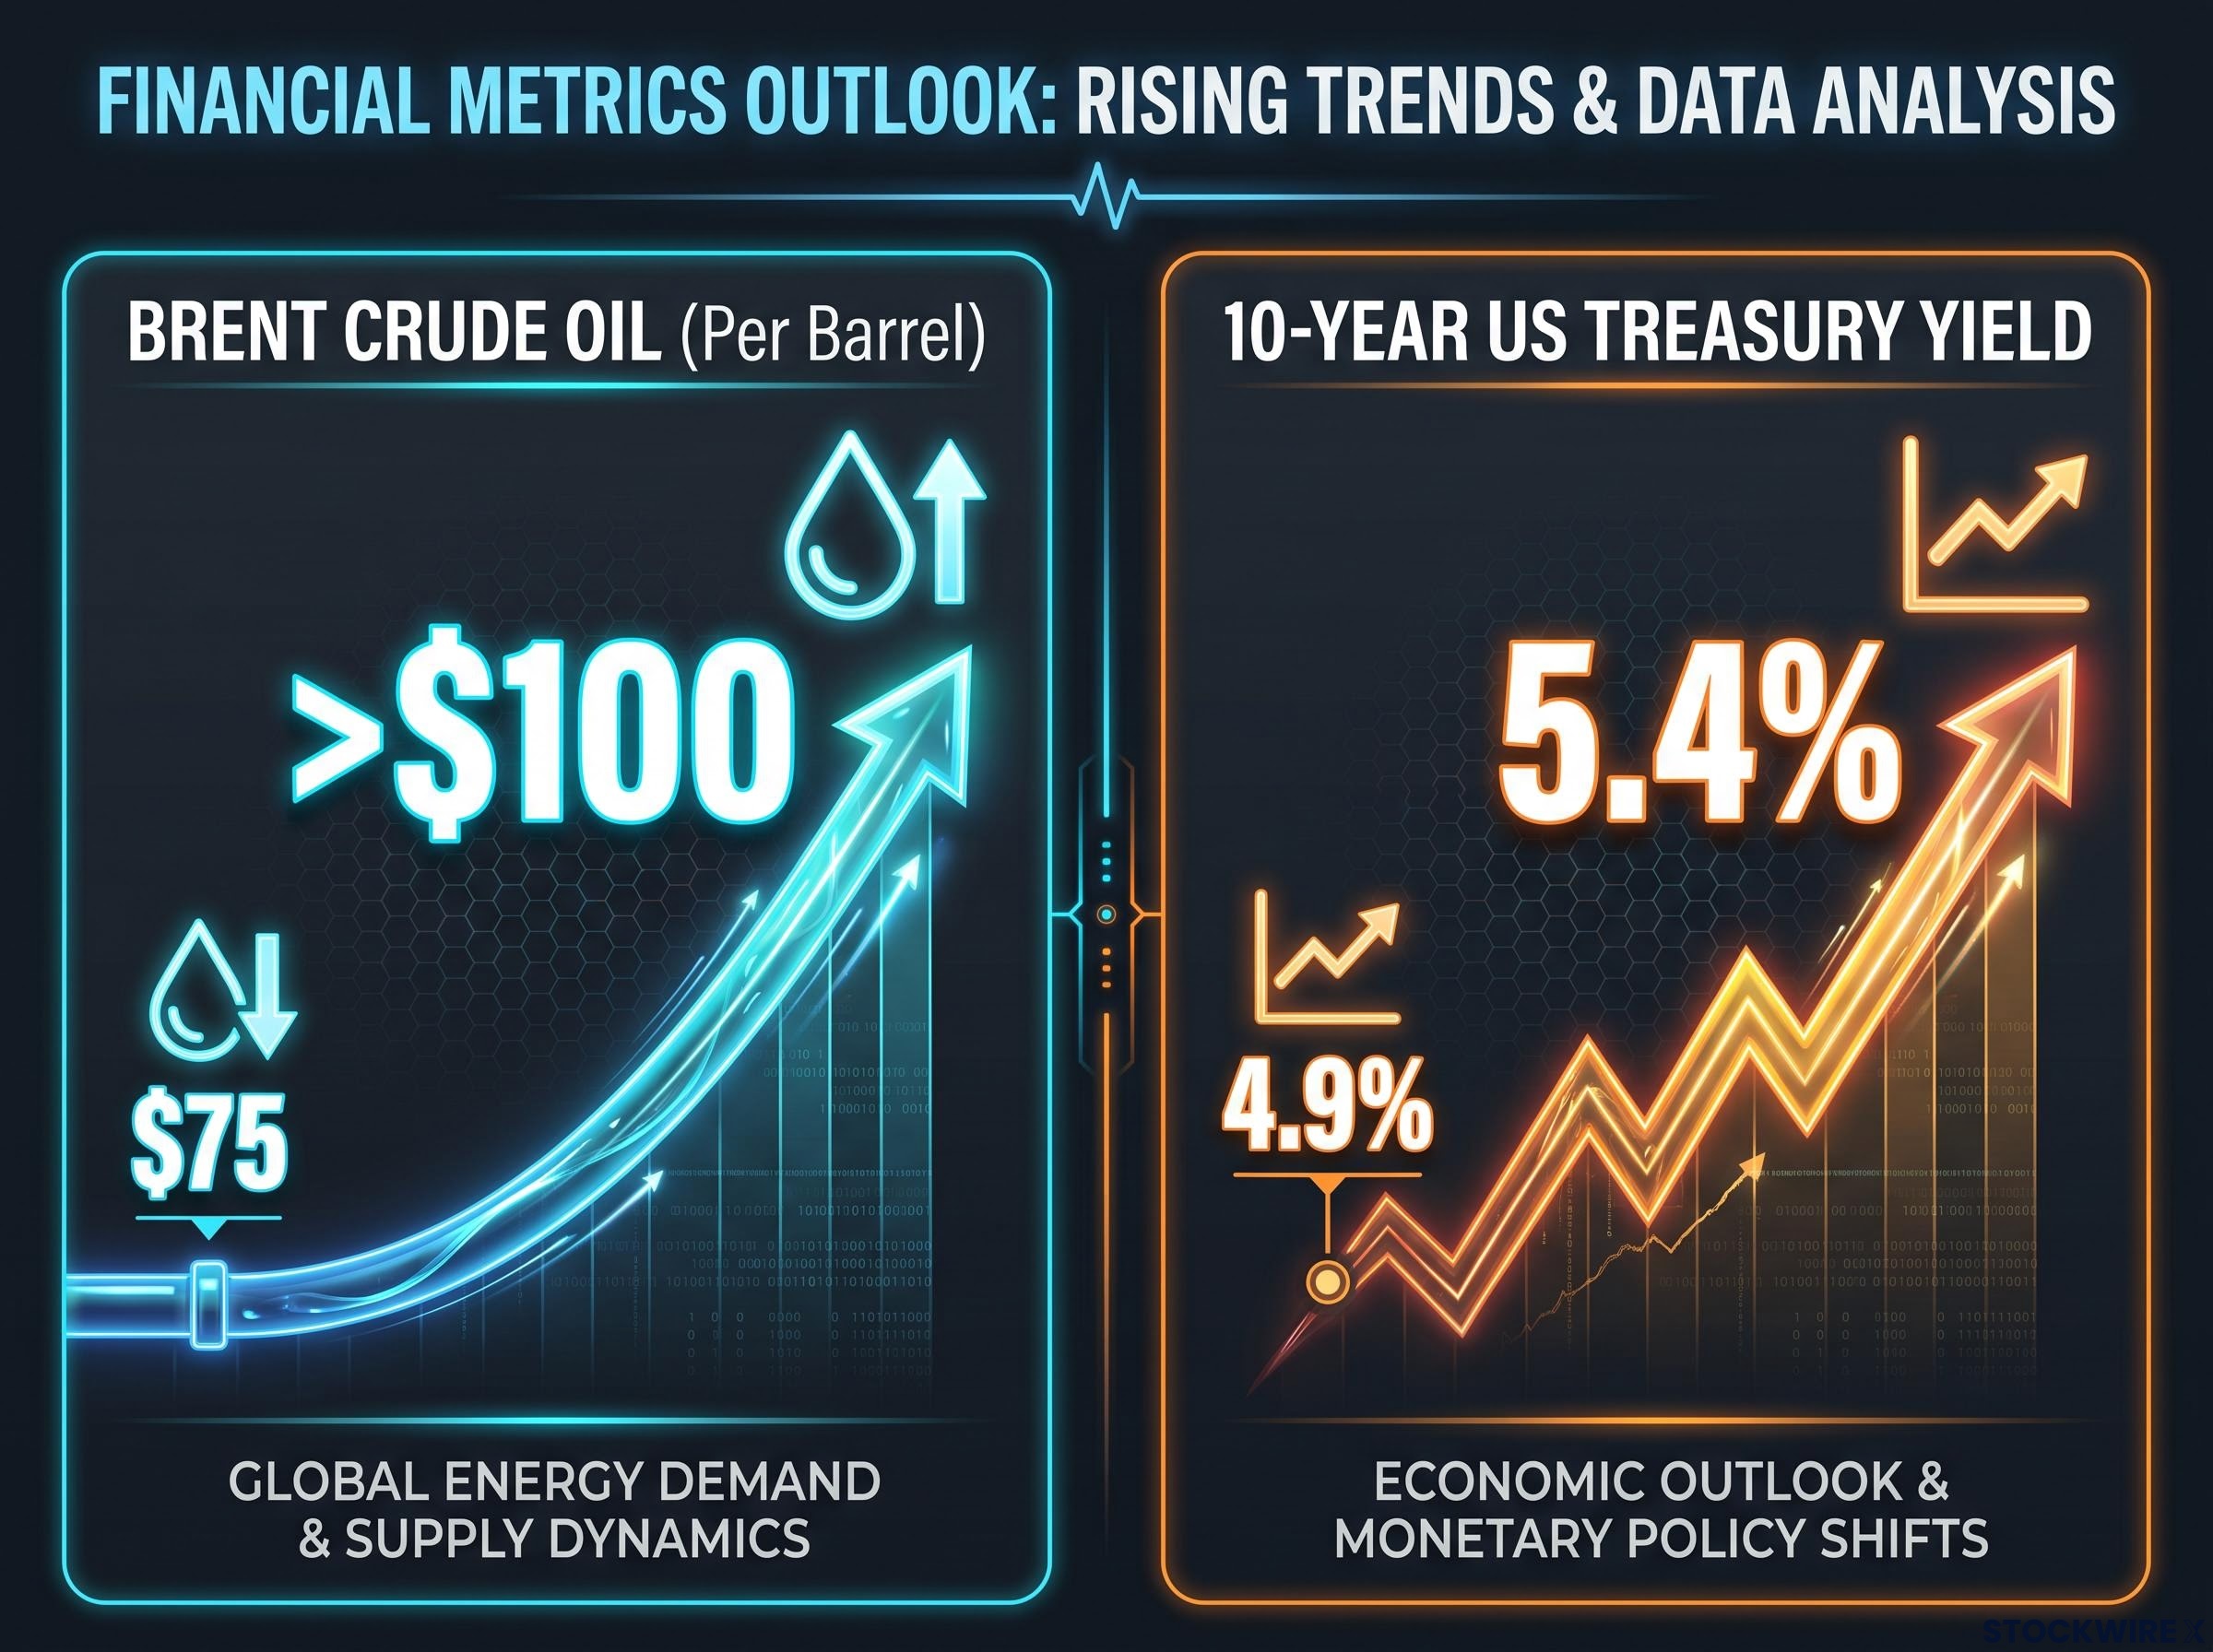
- Oil climbs: Brent crude has moved back above $100 a barrel, after dipping toward $75 earlier in the year.
- Bond yields rise globally: Investors expect higher energy costs to keep inflation elevated and push central banks to act.
- Treasuries hit multi-year highs: The 10-year US Treasury yield sits near 5.4%, up from about 4.9% just over two months earlier, according to the BBC‘s Faisal Islam.
That last step creates a carry advantage, which is the extra return investors earn by holding assets in a currency with higher interest rates. With US yields this high, capital flows toward dollar assets.
Europe is adding a further layer. Widening spreads between French and German government debt have raised fears of contagion within the EU, drawing comparisons with the Greek debt crisis of roughly 15 years ago. A French fiscal shock has already supported the dollar, according to TMGM.
The day’s cross-rates show where the pressure really sits.
| Pair | Move on 7 October | Interpretation |
|---|---|---|
| GBP vs USD | -0.48% | Dollar strength driven by rising Treasury yields |
| GBP vs JPY | -0.58% | Broad demand for perceived safe havens |
| GBP vs EUR | +0.10% | Sterling held up against a euro facing its own spread stress |
The energy shock also threatens UK finances directly. Office for Budget Responsibility (OBR) modelling suggests oil above $150 could cut fiscal headroom by 11.5 billion pounds against March projections, and by up to 35 billion pounds in extreme scenarios.
This tells you the move is more about dollar strength than sterling weakness alone, since the pound actually gained against the euro. With no major UK data released today, reading GBP/USD means watching US yields and oil first.
The dollar index rally is largely a euro trade, since the euro makes up over half of the index, which helps explain why sterling held up against the euro while falling against the dollar.
What are the Fed and the Autumn Budget doing to the outlook?
The drivers above set the direction. The next few weeks will decide how far it runs, because both central banks and the UK Treasury have decisions clustered close together.
Fed expectations
Markets expect the Federal Reserve (Fed) to move before the BoE, so near-term dollar strength partly reflects timing. A later BoE hike does little for sterling if the Fed acts first.
The exact Fed path is less settled than that framing suggests. Investing.com reported on 23 September that markets assigned about 53% odds to an October hike. More recent reporting from FXStreet points to a hold at the current meeting, with about 20 basis points of tightening priced for December and fed funds expected to stay in the 3.75%-4% range; the later view is the better guide to current expectations.
Inflation pressure is building in the background. The New York Fed Survey of Consumer Expectations showed one-year inflation expectations rising to 3.9% in September from 3.6% in August. Markets are also waiting on the Fed’s September meeting minutes.
The Budget risk
Chancellor John Healey delivers the Autumn Budget on Wednesday 28 October 2026. With gilt yields near 28-year highs and oil eating into fiscal headroom, the choices he makes could unsettle both gilts and sterling.
The catalyst calendar looks like this:
- Thursday 8 October: US Initial Jobless Claims
- Friday 9 October: University of Michigan consumer confidence
- Pending: Fed September meeting minutes
- Wednesday 28 October: UK Autumn Budget
- November: BoE decision, with a hike heavily priced
- December: Fed meeting, where tightening is partly priced
What this means for you is that the next three weeks are dense with catalysts, so a single data point is unlikely to settle the direction. Any positioning view should allow for repricing as each event lands.
What do the charts say about 1.3200, 1.3100 and 1.3300?
The macro story has a clear footprint on the chart. Today’s slide below 1.3200 took the pair to its lowest level since late June, with TradingEconomics quoting 1.3207, down 0.52% on the day. Sources differ slightly on the exact print, and the latest figure takes precedence.
Reading the levels
The bias is bearish. FXStreet’s daily-chart analysis shows price trading below the 100-day moving average and beneath a cluster of simple moving averages (SMAs), which smooth price over a set period to show the trend. A descending trend line is capping rallies.
The Relative Strength Index (RSI), a momentum gauge running from 0 to 100, sits at 36.15 on its 14-day setting. That is below neutral but not yet oversold, which suggests sellers still have room to push.
| Level | Type | Significance |
|---|---|---|
| 1.3448 | Resistance | SMA cluster; clearing it would challenge the bearish bias |
| 1.3426 | Resistance | Second hurdle for any recovery |
| 1.3302 | Resistance | First line a rebound must clear |
| 1.3159 | Support | Rising trend line |
| 1.3140 | Support | Next floor below the trend line |
| 1.3100 | Downside target | Cited if the Fed hikes while the BoE holds |
Short-term view: TradingNews Sterling remains “trapped below 1.3300” because the Fed is expected to move first, according to TradingNews commentary from 28 September.
Investing.com has flagged that a Fed hike followed by a BoE hold could push the pair toward 1.3100. This means you should treat 1.3300 as the line a recovery must clear, and the 1.3140-1.3159 zone as where the downside case gets tested.
What would change the picture
The bearish setup rests on energy and yields, and both can turn quickly. Earlier this summer, expectations of US-Iran de-escalation produced sharp falls in oil and bond yields, according to the BBC.
A repeat would likely ease inflation expectations and could reverse part of the dollar’s rally. A BoE that ends up looser than priced, as Franklin Templeton expects, or a dovish shift in Fed pricing would also reshape the levels above.
For readers wanting to apply these levels themselves, our dedicated guide to GBP/USD technical analysis explains why an RSI near oversold is not a standalone buy signal.
Weighing the dollar’s strength against sterling’s fragile support
The pieces fit together. US yields and the Iran energy shock are setting the direction, UK fiscal stress is limiting sterling’s ability to benefit from hike expectations, and the chart marks where that pressure either extends or breaks.
The variables worth tracking are the US 10-year yield, Brent crude, the 28 October Budget, and the sequencing of Fed and BoE decisions. On the chart, 1.3100 and 1.3300 frame the near-term range.
None of this is fixed. Fed pricing has already shifted once in a fortnight, and oil has shown it can fall as fast as it rose. Watch the drivers rather than any single forecast.
Past performance does not guarantee future results. Financial projections are subject to market conditions and various risk factors. These statements are speculative and subject to change based on market developments.
This article is for informational purposes only and should not be considered financial advice. Investors should conduct their own research and consult with financial professionals before making investment decisions.