Approved Article With Interlinks
On 2 October 2026, a single report from Nikkei Asia stripped roughly 10-16% of market value from two of the biggest names in hard drive storage in one trading session. Toshiba’s plan to double its AI data-centre HDD production capacity by fiscal 2027 did not simply move prices on the day. It struck at the core investment thesis that had carried Seagate (STX) and Western Digital (WDC) through their recent bull runs.
That thesis rested on a disciplined, three-player oligopoly keeping supply tight enough to protect pricing power and expand margins. Toshiba’s ¥60 billion commitment, paired with a declared ambition to lift its share of the global HDD market from just over 10% to 30%, is a direct challenge to that assumption. Whether the repricing marks a structural reset or an overreaction is the question every trader in either name now has to answer before touching the chart.
This piece maps the specific support and resistance levels now in play for both WDC and Seagate, explains what each one means against this particular catalyst, and sets out where the technical structure stays tradeable and where it breaks down. Here is what the chart is telling you, where the bull case still holds, and where it does not.
What Toshiba announced, and why the HDD oligopoly felt it immediately
The headline number was ¥60 billion, roughly $380-400 million, directed at expanding Toshiba’s manufacturing facilities in the Philippines. The stated goal: double output of hard drives built for AI data centres by fiscal 2027, the financial year ending March 2027.
What gave the announcement weight was its timing. This is Toshiba’s first major HDD capacity investment in roughly five years, which signals a regime change. A company that had held back during an era of supply restraint is now spending to chase volume.
The new production lines target per-drive capacity gains of up to around 40%, and Toshiba has laid out a technology roadmap that reaches well beyond this decade.
Those are not entry-level drives. They sit at the high-capacity enterprise tier where Seagate and Western Digital earn their strongest margins, which is precisely why the market treated this as a thesis break rather than background noise.
When big ASX news breaks, our subscribers know first
Why a three-player market amplifies a single capacity signal
The clearest marker of intent was the market-share target.
In a market split between only three players, there is no diffuse field of smaller competitors to absorb incremental supply. One participant adding capacity carries immediate pricing and margin implications for the other two, because every drive Toshiba sells into that 30% ambition has to come from somewhere, and in practice that means Seagate and Western Digital volume in their most profitable segments.
That matters for the charts that follow. Technical levels formed under expectations of coordinated supply discipline become structurally less reliable once one participant defects from that discipline, which is the lens you need before reading any support zone on these two names.
Enterprise drive pricing power built through 2025 and into 2026 on the back of sold-out production capacity and 60% price surges for high-capacity models, which is the margin structure Toshiba’s 30% market-share ambition is now targeting directly.
The sell-off in numbers: WDC and STX price action and the key levels now on the map
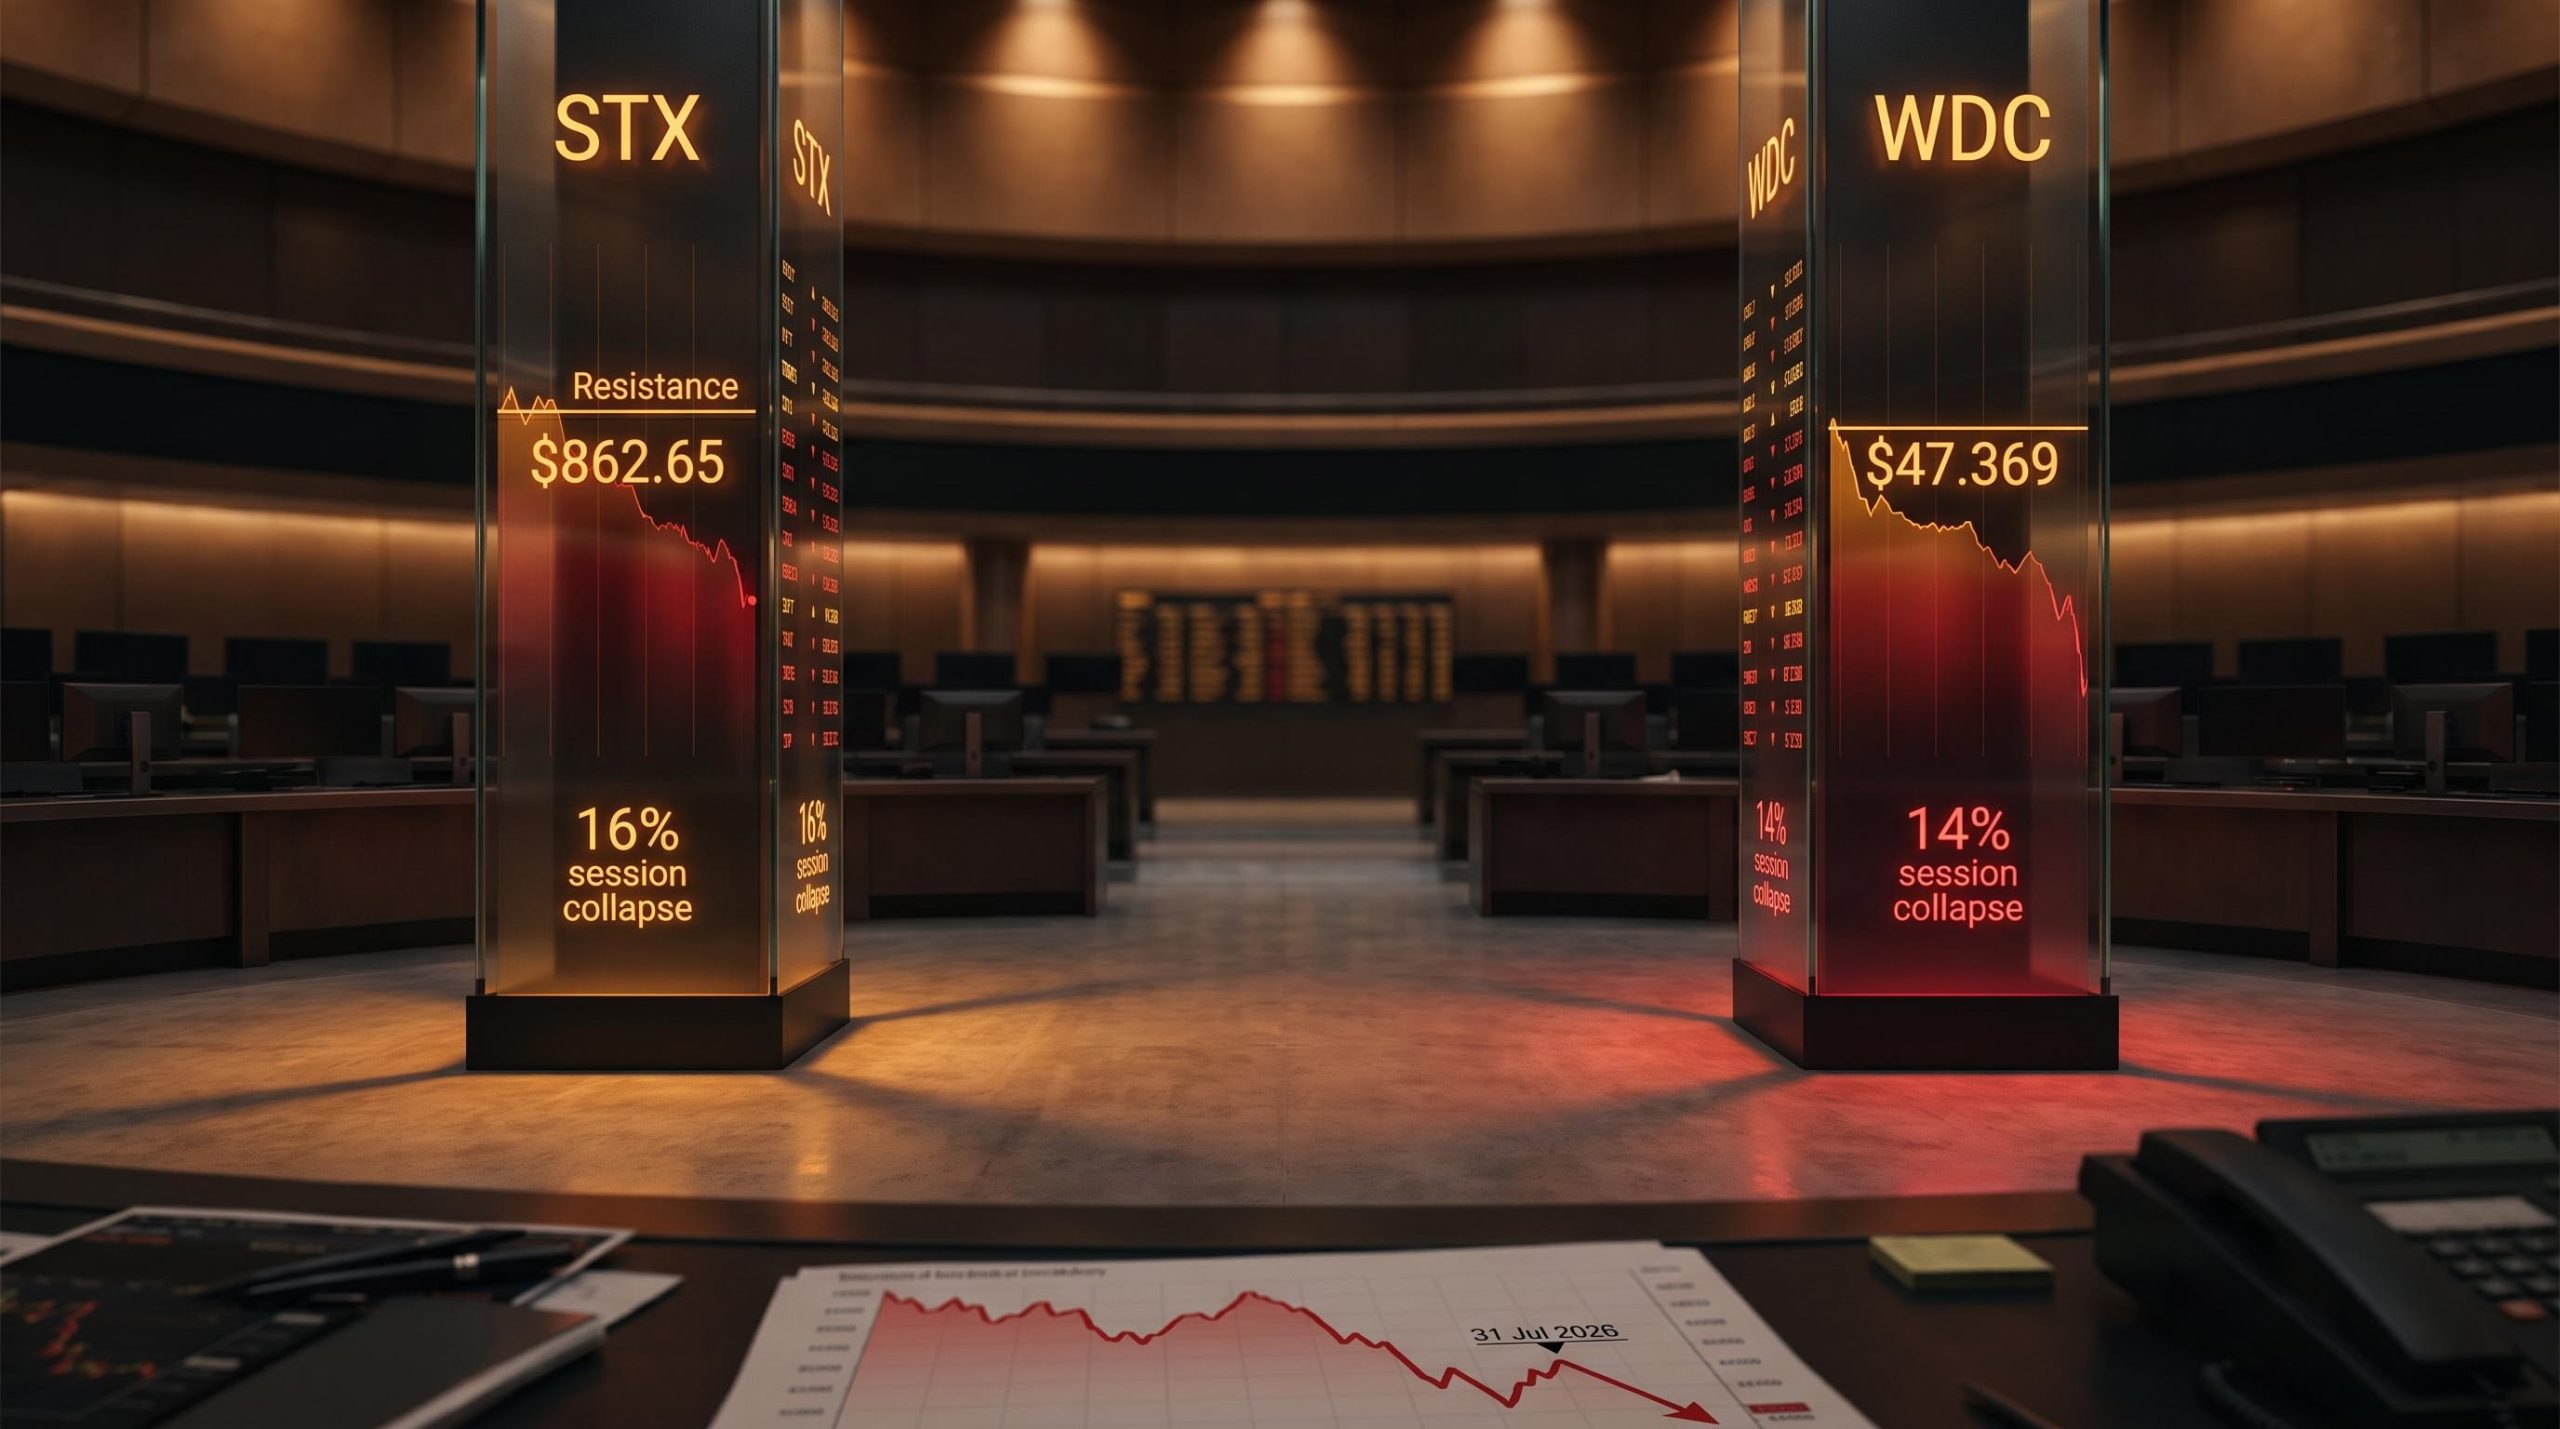
The damage was concentrated and fast. Western Digital closed the prior session near $46.30, then fell as low as $39.66 intraday, a decline of roughly 14%, before recovering to sit around 10% down into the close.
Seagate took it harder. STX dropped approximately 16% from the prior session, piercing the $800 psychological level intraday before finding a bounce.
Those moves left specific technical levels on the map for both names, according to analysis from Jake Sweeney, a protrader at Verify Investing who runs the Apex Live Day Trading Room. (Secondary sources report conflicting intraday figures; the levels here follow that primary technical reference.)
For WDC, a chart gap at $39.099 acted as a demand zone, drawing buyers in before price reached it and pushing the stock back up. On the upside, a gap fill near $47.369 now sits as resistance, with a short setup zone flagged at $47.3-$47.5 and a descending trendline in place since 31 July 2026 capping any rally.
For Seagate, an ascending trendline dating to 29 January 2026 provided bounce confirmation, with a gap fill near $801 acting as support. Above current price, $862.65 is the key resistance to reclaim, with a descending trendline test in the $912-$915 zone further up. Below, a lower support shelf sits at $766.97.
| Stock | Key Support Level | Gap Fill Target | Key Resistance | Setup Zone |
|---|---|---|---|---|
| WDC | $39.099 (demand zone) | $47.369 | Descending trendline (since 31 Jul 2026) | Short $47.3-$47.5 |
| STX | $766.97 (lower shelf) | $801 | $862.65, then $912-$915 | Long triggered at $800 |
The gap fill levels do the double duty here. For both stocks, the gap fill functions as a two-way pivot: resistance on any recovery attempt, and a structural failure point if price cannot reclaim it.
What this gives you is a framework. Knowing exactly where buyers entered on the sell-off day, and where resistance sits above, lets you judge whether a recovery is a genuine trend shift or a counter-trend bounce to sell into.
What makes technical levels less reliable after a news-driven gap
Here is the uncomfortable part. The levels above are real, but their reliability is not fixed. It depends entirely on which story about Toshiba turns out to be true.
Double-digit gap-downs driven by a concentrated fundamental catalyst behave like breakaway gaps, not common or exhaustion gaps. A breakaway gap carries a different recovery profile: it marks a move to new information rather than an oscillation within an established range, so the usual expectation of a quick gap fill may simply be wrong.
Breakaway gaps above 8% with strong catalysts fill as little as 8.2% of the time according to gap-filling technical analysis frameworks, which is precisely why the $39.099 demand zone and $801 gap fill for WDC and Seagate carry more uncertainty than their clean chart appearance suggests.
That is where the counter-thesis earns attention.
If Merchant is right, effective supply growth is slower than the headline doubling implies, the sell-off is a headline overreaction, and the technical levels function as genuine entry points. If the bears are right and this is a structural repricing, prior support zones, built under the old supply-discipline assumption, become less dependable because the market conditions that formed them no longer apply.
Two scenarios and what each means for the chart
The split comes down to two plausible outcomes, neither of which can be assigned a probability from current data.
Scenario A is a sustained down-cycle: Toshiba’s expansion overshoots demand, triggers broader capacity competition, and compresses average selling prices for high-capacity enterprise drives over multiple quarters. In this world, the WDC $47.369 gap fill and Seagate’s $862.65 resistance are levels to fade, and the lower support shelves at $39.099 and $766.97 come into play.
Scenario B is a sharp but temporary repricing: AI data-centre demand absorbs the new capacity, upstream component bottlenecks slow effective delivery, and the move resolves as a dislocation rather than a reset. Here, the same gap fill levels become recovery targets worth buying toward rather than selling into.
Four caveats follow directly from this scenario dependency.
The practical takeaway is that position sizing and stop placement matter here as much as entry level selection. Using the right level in the wrong direction is the most damaging outcome in post-gap trading.
How to read the recovery: what needs to happen for the bull case to stay viable
You do not need to resolve the fundamental debate to trade this. You need a watch list of observable conditions that will tell you which scenario is winning as price develops.
For Western Digital, the recovery path is defined by a sequence of levels.
- Reclaim the broken ascending trendline as a first sign of stabilisation
- Then challenge the descending trendline in place since 31 July 2026
- Watch the $47.369 gap fill as the pivotal resistance test
- Treat the $47.3-$47.5 zone as a potential short setup if the rally stalls there
For Seagate, the milestones run in parallel.
- Reclaim $862.65 to signal genuine recovery momentum
- Hold above the $801 gap fill support to keep the bounce intact
- A break below opens the path to the $766.97 lower shelf
- The $912-$915 descending trendline test would mark a fuller recovery
The context that keeps Scenario B alive is demand. AI data-centre demand remains robust and secular, which is the single factor most capable of absorbing Toshiba’s added capacity rather than tipping the market into a glut, and the upstream component constraints Citi flagged could act as a natural brake on how fast effective supply actually arrives.
The data centre demand trajectory, with Citi’s 370 GW forecast for 2031 representing a tripling of its prior projection, is the single variable most capable of determining whether Toshiba’s added capacity triggers a glut or simply fills a larger market, which is what makes Scenario B plausible rather than wishful.
The short setup case for traders who see a structural repricing
For traders who read the Toshiba announcement as durable thesis damage, both stocks offer defined fade zones. WDC at $47.3-$47.5 and Seagate at $862.65 each mark the gap fill area where sellers who missed the initial move may re-engage.
The important qualifier: fading these levels is a fundamental call, not just a technical one. A short at either zone implicitly bets that the Toshiba expansion represents lasting damage to the pricing-power thesis rather than a temporary shock, so the setup is only as good as your conviction on the scenario behind it.
Letting the levels do the work in a thesis-in-transition environment
The fundamental question cannot be settled from the data available right now. Structural repricing or overreaction will only become clear as the supply picture develops over the coming weeks.
What you do have are observable milestones. The chart levels for both names are not just price targets; they are diagnostic tools, and how price behaves at each one will tell you which scenario is gaining confirmation before any analyst formally updates a view.
The levels that matter most: WDC’s $47.369 gap fill and $39.099 demand zone, and Seagate’s $862.65 resistance and $766.97 lower support shelf. Behaviour at those four points, read against Scenario A (durable margin compression) and Scenario B (demand absorption with upstream constraints slowing supply), does the interpretive work for you.
Three forward catalysts are worth monitoring.
AI infrastructure cost pressures are redistributing gains within tech more broadly, with chip and storage cost increases passing through to consumer hardware at the same time they are expanding margins for HDD and memory suppliers, a dynamic that adds a second layer of macro context to any directional call on WDC or Seagate.
- Any update from Toshiba on production timeline specifics
- Any response from Seagate or Western Digital management on competitive positioning
- Signals from upstream suppliers of media and heads that bear on Citi’s bottleneck thesis
Frame the next few weeks as a diagnostic exercise rather than a directional bet, and you can stay active in both names without needing certainty about which scenario wins.