A Fed official who counts himself among the more dovish voices on the committee is warning that rate cuts may not arrive for years. When even the optimist in the room is telling you to brace for a long wait, the dissonance is worth paying attention to.
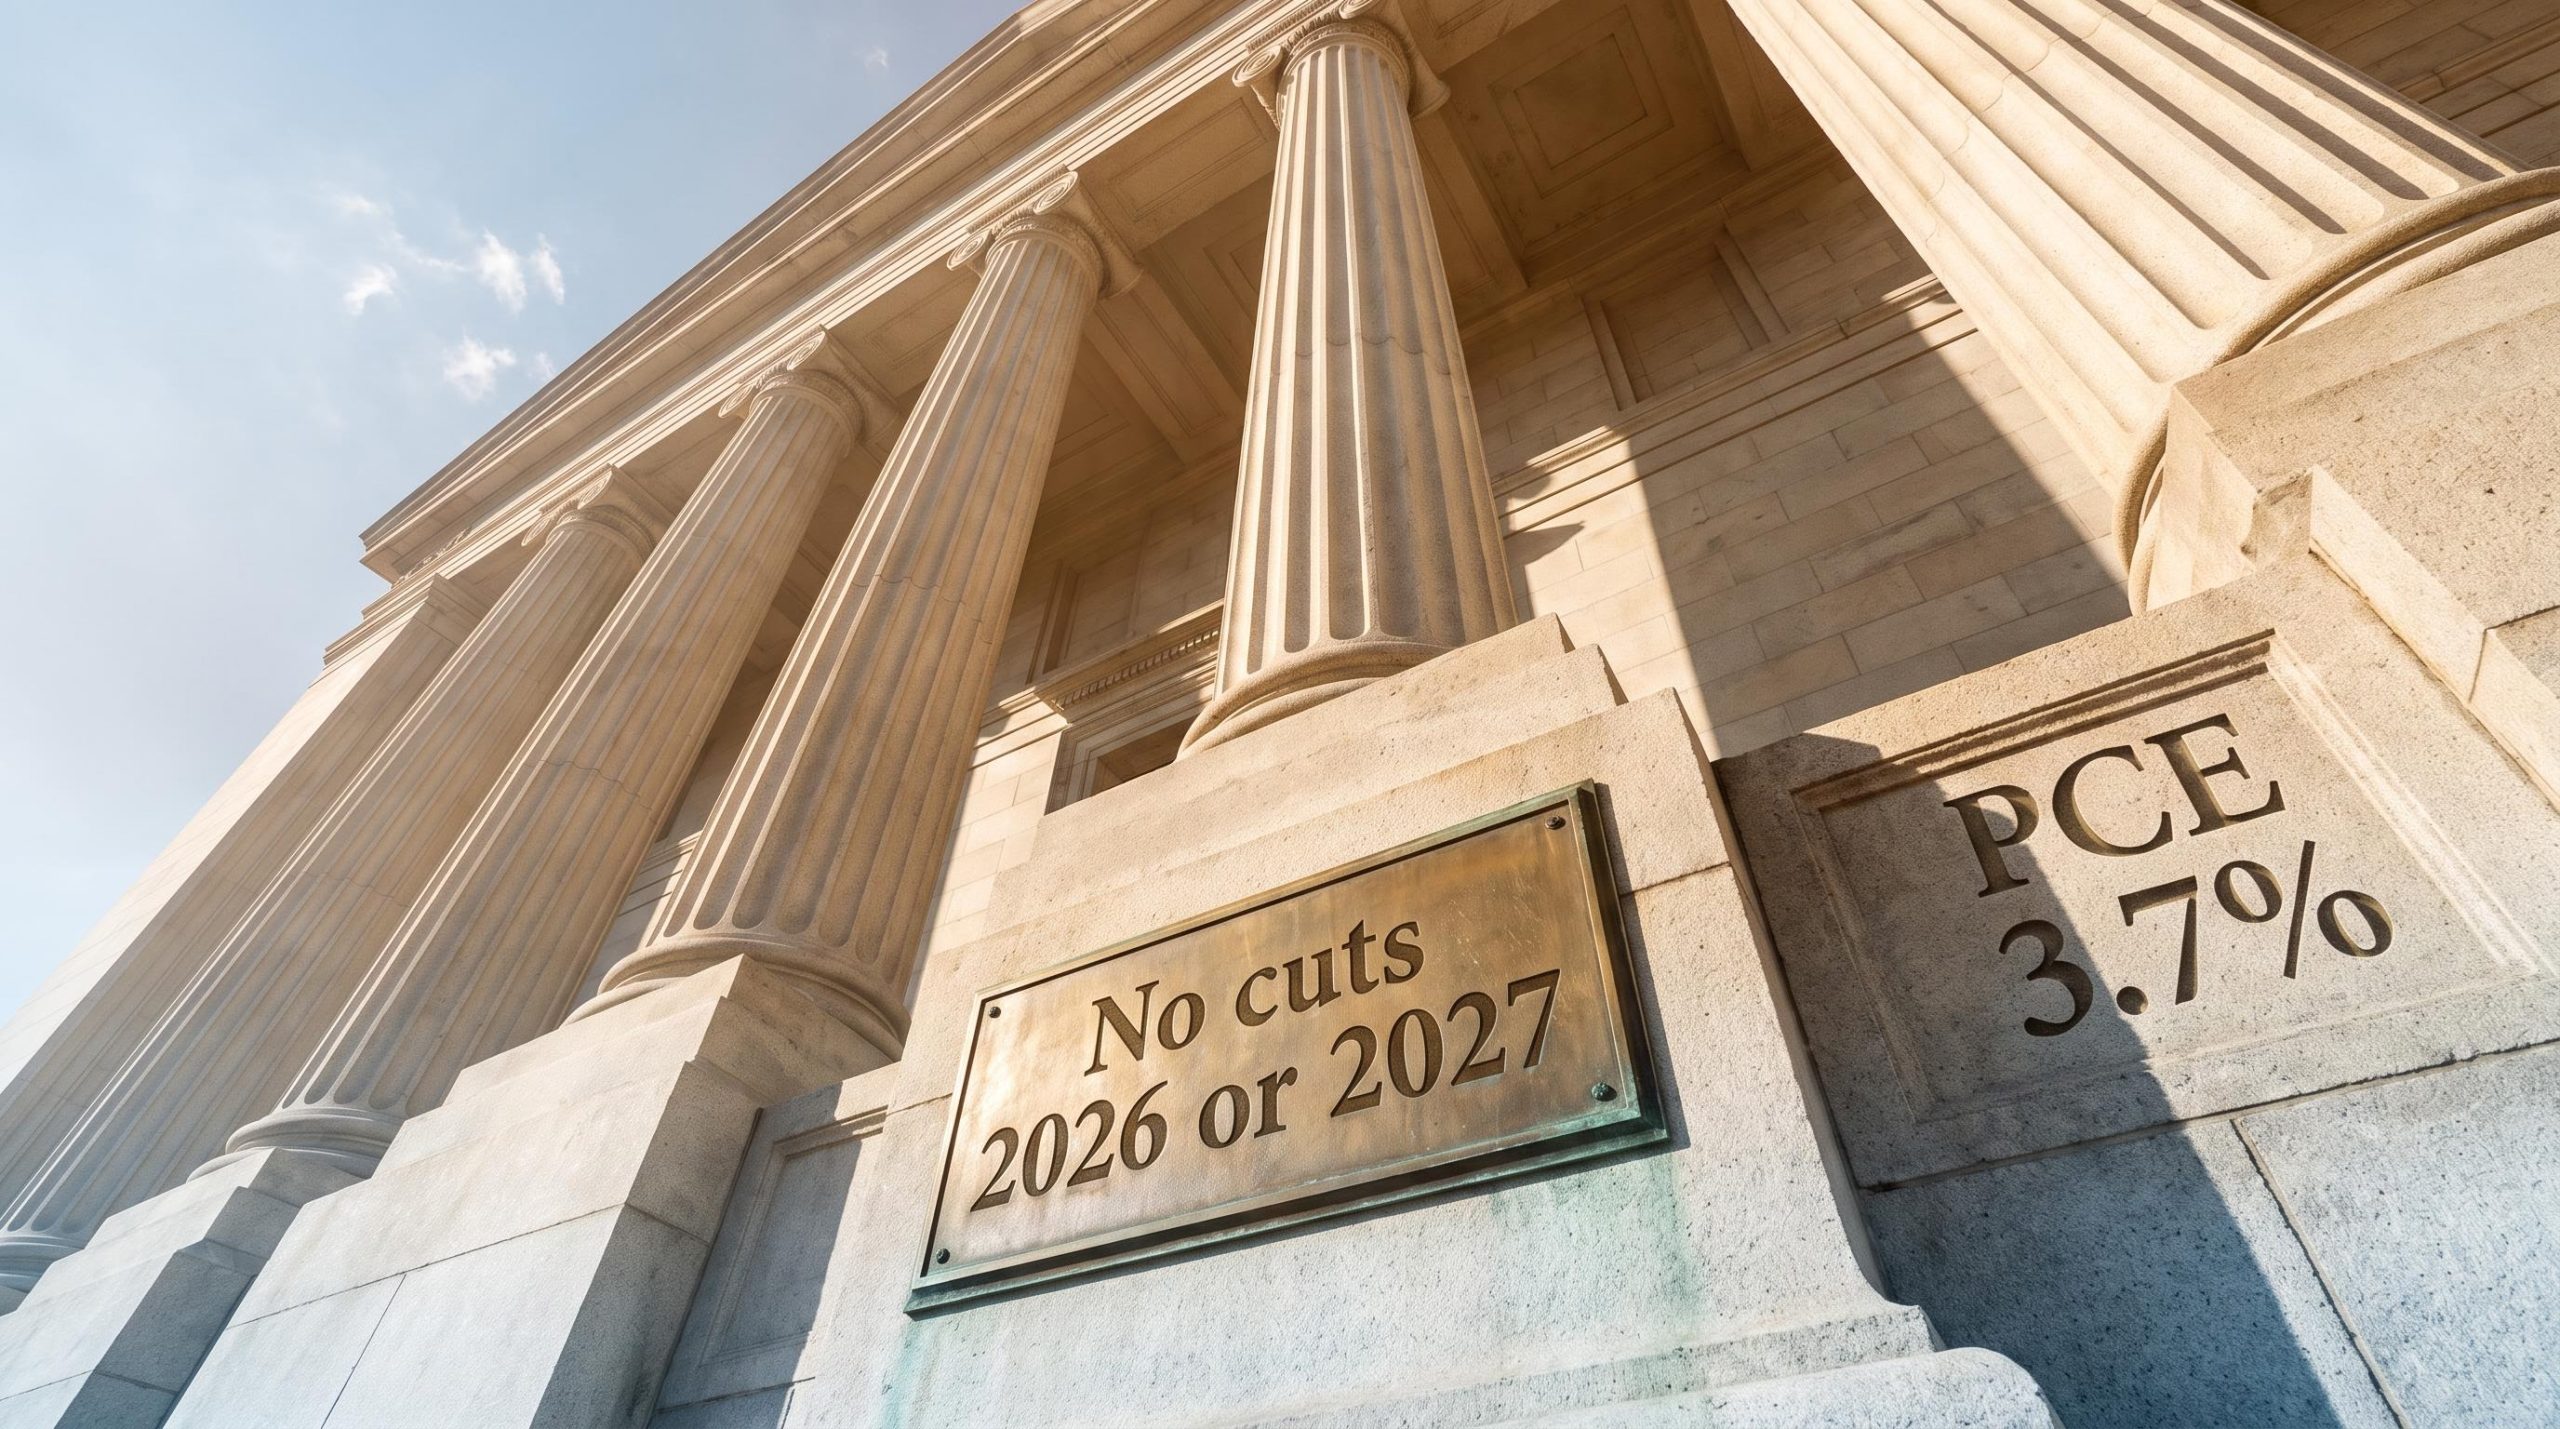
That warning came from Chicago Fed President Austan Goolsbee on 29 September 2025. Exactly one year later, the question is whether his concerns proved prescient. The September 2026 Summary of Economic Projections has since confirmed the broad thrust of what he flagged: no cuts in 2026 or 2027, inflation still running above target, and a committee consensus that has turned even more hawkish than Goolsbee’s own positioning.
The Fed rate cut delay is no longer a matter of temporary hesitation. It has become a structural reality tied to specific economic forces, each of which has to visibly reverse before the picture changes. What follows maps those forces, why the timeline runs longer than most expected, and what that means for anyone making decisions in a higher-for-longer environment.
Goolsbee’s warning, one year on: how accurate was the forecast?
When Goolsbee spoke a year ago, his central concern was duration. Inflation had already sat above the Fed’s 2% objective for roughly 4.5 years, and the progress that had looked promising through 2023 and 2024 appeared to have stalled.
Inflation had remained above the Federal Reserve’s 2% target for approximately 4.5 years as of Goolsbee’s remarks, and the earlier trend toward that target appeared to have halted.
The data since has largely vindicated that reading. The September 2026 SEP revised its inflation projections meaningfully higher and pushed the first easing far into the future:
- 2026 headline PCE inflation: revised up to 3.7%
- 2026 core PCE inflation: 3.4%
- Median year-end 2026 federal funds rate: approximately 4.1% (a 4.00-4.25% range), up from 3.8% in the June 2026 projections
The first projected rate cuts do not appear until 2028-2029, and even then they are described as modest and gradual.
Here is where the story turns. Goolsbee described himself as among the more optimistic members plotted on the Fed’s dot plot, the chart showing where each official expects rates to go. Yet the committee as a whole landed on a path more hawkish than his own. The optimist warned of stalling inflation, and then watched his colleagues take an even harder line.
That tells you something important about how the Fed is treating persistent inflation. The risk Goolsbee identified was not a minority worry at the edge of the committee. It was closer to a floor than a ceiling for how seriously the institution now views above-target inflation.
The Fed leadership transition in May 2026 added an institutional layer to the policy uncertainty Goolsbee was already identifying, with Warsh inheriting a committee already split on whether the inflation stall was structural and then accelerating the pace of balance sheet runoff before the September SEP confirmed the hawkish pivot.
There is a forward-looking reason this matters to you specifically. Goolsbee holds FOMC voting rights in 2027, placing him directly in the room for the first meetings where easing becomes theoretically possible. Knowing where he stood a year ago, and how events have since validated that position, gives you a calibrated sense of what the committee will require before it moves.
When big ASX news breaks, our subscribers know first
What is actually driving the stall? Deficits, demand, and a labour market that will not soften
The delay is not the product of a single stubborn variable. It is a reinforcing system, and the primary structural driver Goolsbee named is the federal deficit.
At $1.9 trillion, or 5.8% of GDP for FY 2026, the deficit is running well above its 50-year historical average of 3.8% of GDP, according to the Congressional Budget Office in its February 2026 outlook. That is a gap of more than 50% above the long-run norm, and it lands in an economy already operating near full employment.
The transmission mechanism is straightforward. When government spending runs well ahead of revenue, it adds to aggregate demand across the economy. That extra demand makes it harder for the Fed to bring inflation back to target without holding rates higher for longer.
There is a second twist that makes the deficit self-reinforcing. Higher rates increase the government’s interest bill, which widens the deficit further, which sustains the demand pressure the Fed is trying to contain.
The self-reinforcing loop between deficits and interest costs is the defining feature of fiscal dominance, a condition in which the government’s debt servicing burden structurally constrains how aggressively the Fed can tighten without worsening the fiscal position it is simultaneously trying to improve.
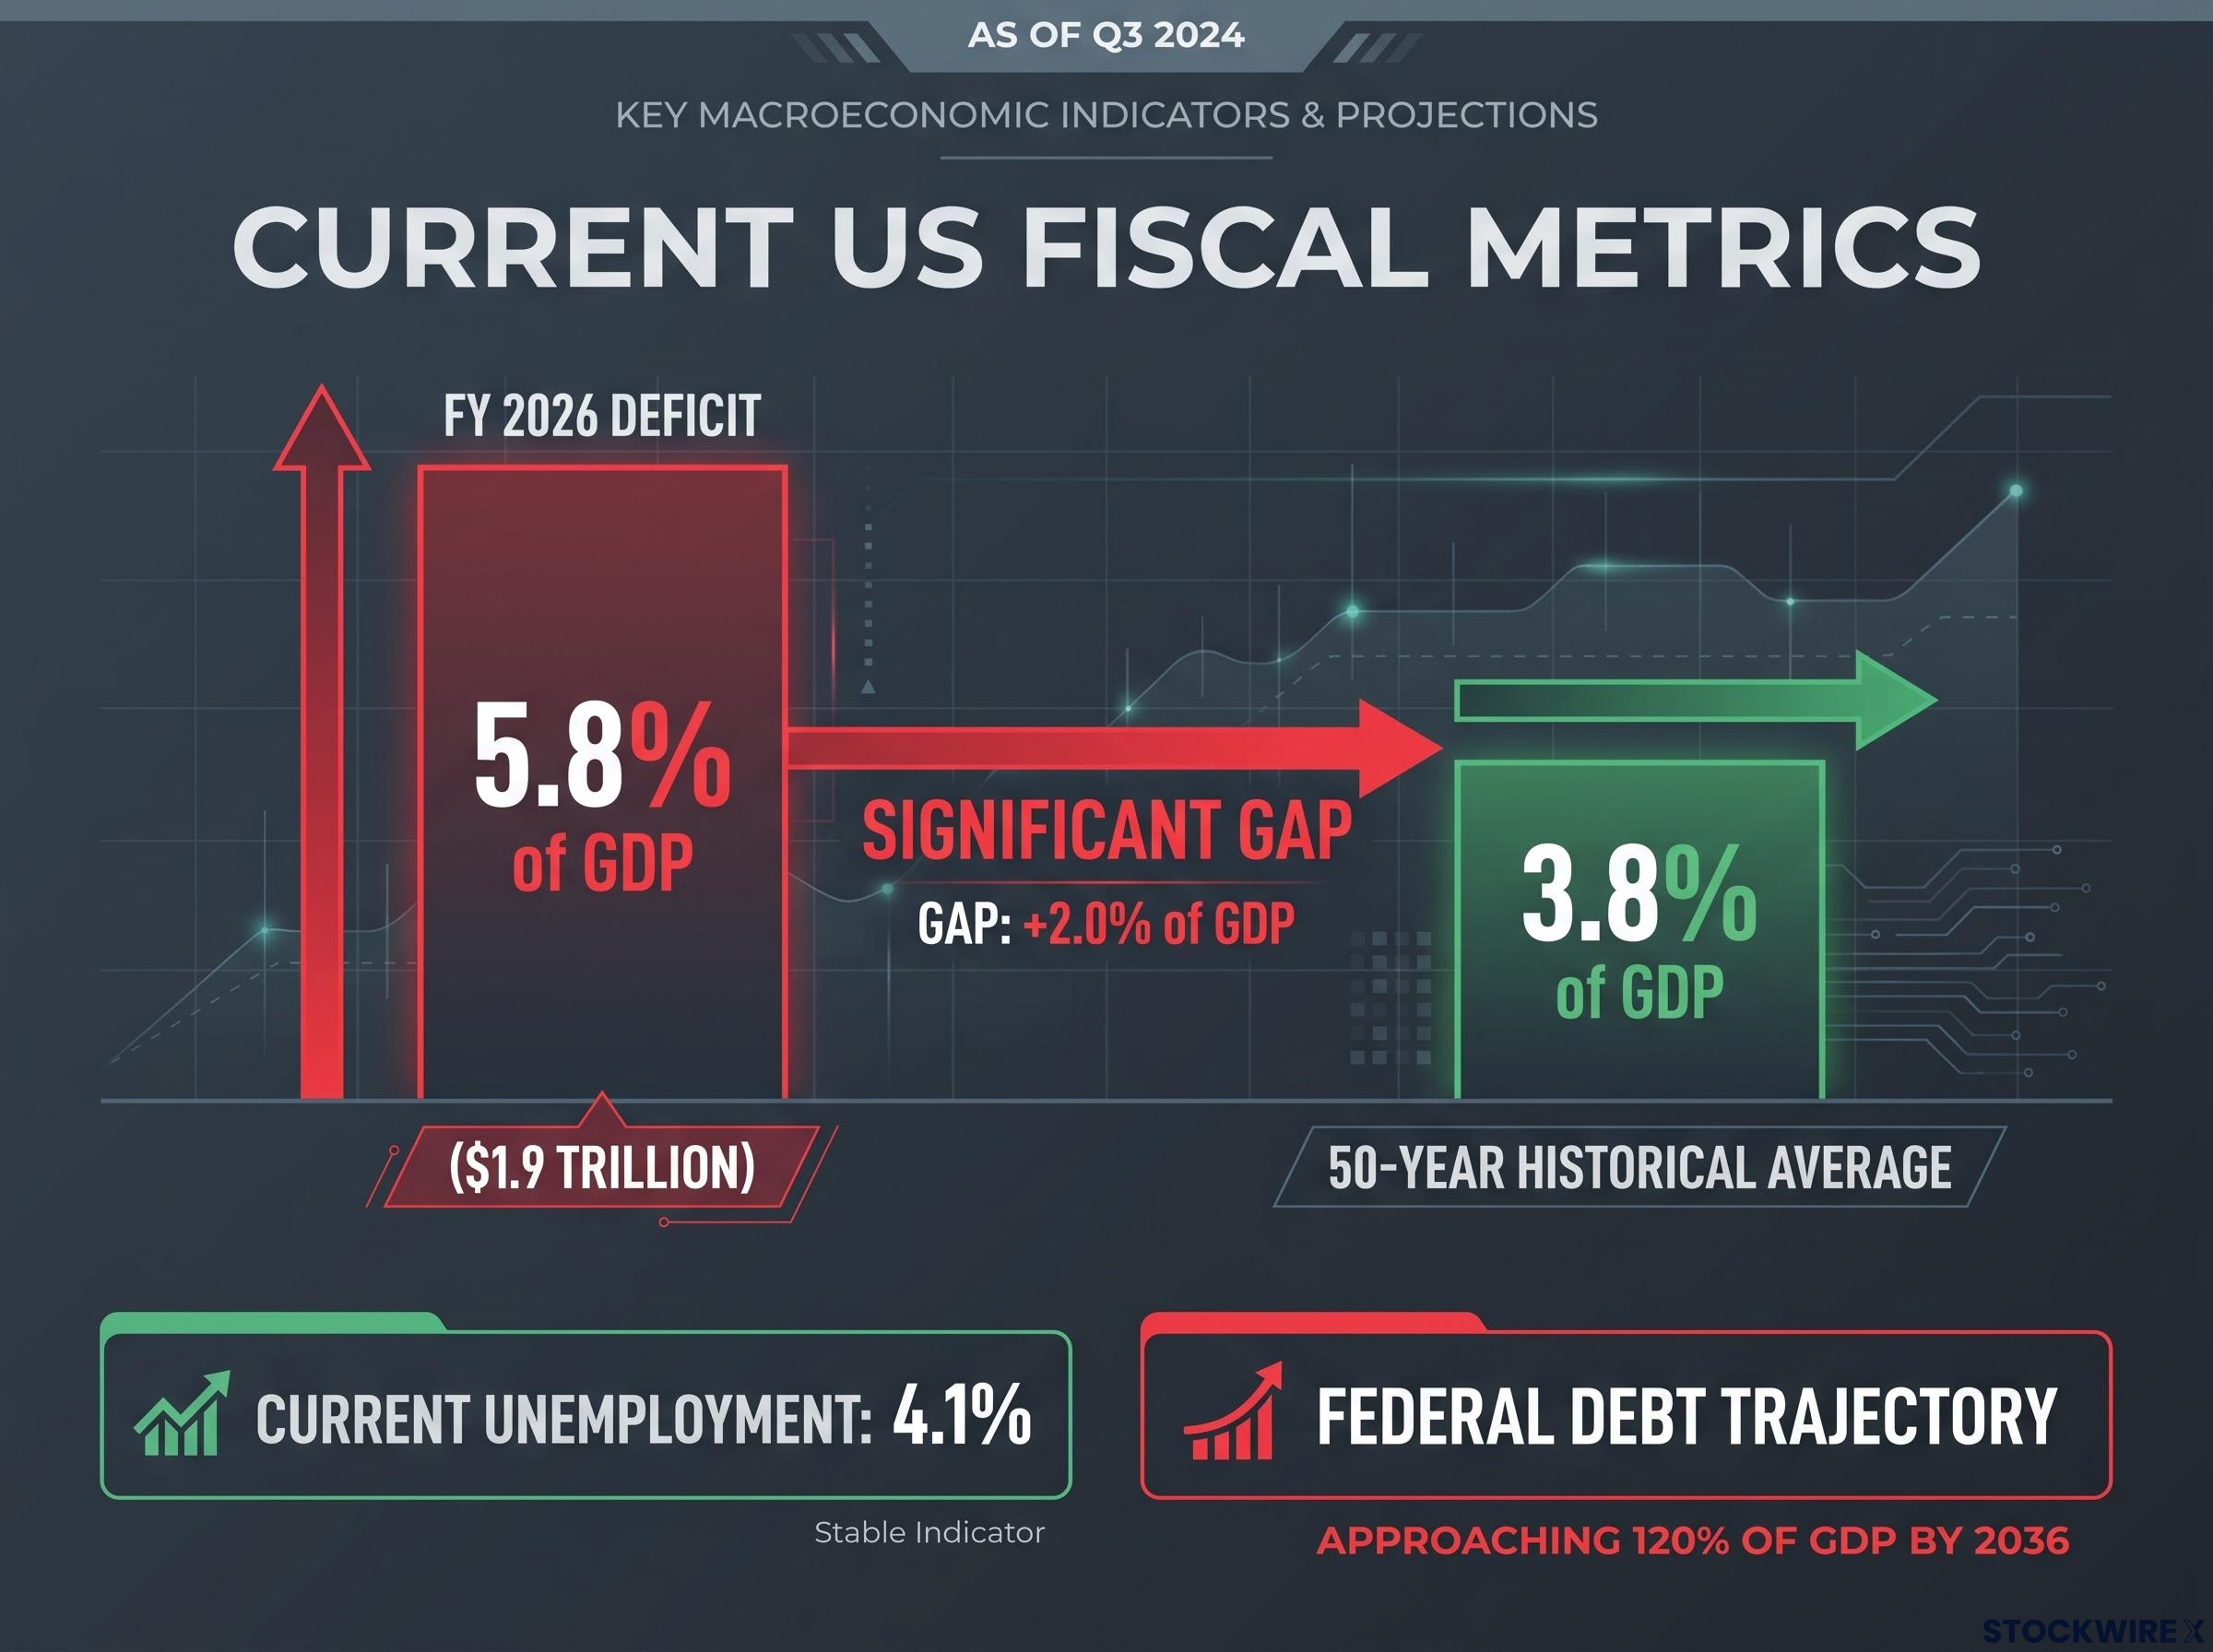
| Metric | Current (FY 2026) | Historical benchmark |
|---|---|---|
| Deficit as share of GDP | 5.8% | 3.8% (50-year average) |
| Deficit dollar value | $1.9 trillion | Well above the long-run norm |
| Federal debt trajectory | Approaching 120% of GDP by 2036 | Elevated versus prior cycles |
The number that should reframe how you think about this cycle is the deficit running 53% above its long-run average while unemployment sits at just 4.1%. The Fed is not fighting inflation in a weakening economy. It is fighting inflation in one that continues to run hot by its own structural design.
A labour market and tariff overhang adding fuel
The September 2026 SEP revised the 2026 unemployment projection down to 4.1% and lifted growth expectations. A labour market that tight keeps wage growth firm and consumer spending resilient, which makes demand-led inflation stickier and slower to fade.
There is a supply-side channel layered on top of the demand story. The CBO noted that inflation “softens in 2026 as the effects of higher tariffs on inflation continue to wane,” identifying lagging tariff-related cost pressures as a separate mechanism still working its way through prices.
For you, the practical read is this: prior tightening cycles typically ended when demand simply cooled, and cuts followed. This cycle is different because the drivers are structural, which is why the usual playbook of waiting a few quarters for cuts does not apply.
The AI productivity wildcard: why near-term optimism is itself an overheating risk
Most people assume artificial intelligence will eventually ease inflation by making the economy more productive. Goolsbee flagged the opposite risk for the near term, and the logic is worth following closely.
His argument is about sequencing. Anticipation of future productivity gains spurs investment, lifts equity valuations, and encourages risk-taking today, all of which boost demand well before any actual productivity improvement arrives.
The asymmetry sits at the heart of it. The demand-side effects of AI optimism, capital expenditure, wealth effects from rising equities, and corporate investment, show up now. The supply-side benefits, higher output per worker and lower unit costs, arrive later. That leaves a window where demand runs ahead of supply.
The mechanism unfolds in three steps:
- AI investment optimism triggers a wave of capital expenditure and drives equity valuations higher.
- Demand and risk appetite rise across the economy as that optimism spreads.
- The supply-side productivity gains arrive later, leaving a near-term overhang of demand without the offsetting increase in output.
Optimism about future productivity is itself an overheating risk in the present, because the spending arrives first and the output gains follow only later.
Honesty about the evidence matters here. This is a theoretical mechanism Goolsbee identified as a monitoring priority, not a dynamic confirmed by a named research consensus for 2026. No official or major analyst source has quantified this effect in the current data, so treat it as the Fed’s forward-looking risk identification rather than an established fact.
The AI productivity paradox, where task-level efficiency gains of up to 55% in software development sit alongside economy-wide productivity growth of roughly 0.1% annually, is exactly the sequencing gap Goolsbee was flagging: the demand-side investment wave is already visible in capex and equity valuations, while the GDP-level supply response remains elusive.
What it means for you is a shift in how to read future Fed commentary about AI. When officials discuss productivity, that is more likely a signal for caution than a basis for pricing in early cuts. The spending comes first; the relief, if it comes, comes later.
What the dot plot signals and where rates realistically go from here
The clearest way to see how far the higher-for-longer thesis has advanced is to compare the June and September 2026 projections side by side.
In June, the median year-end 2026 rate sat at 3.8%, with the 2027 median at 3.6%, implying cuts penciled in for next year. By September, the committee had revised both sharply higher and effectively erased those planned cuts.
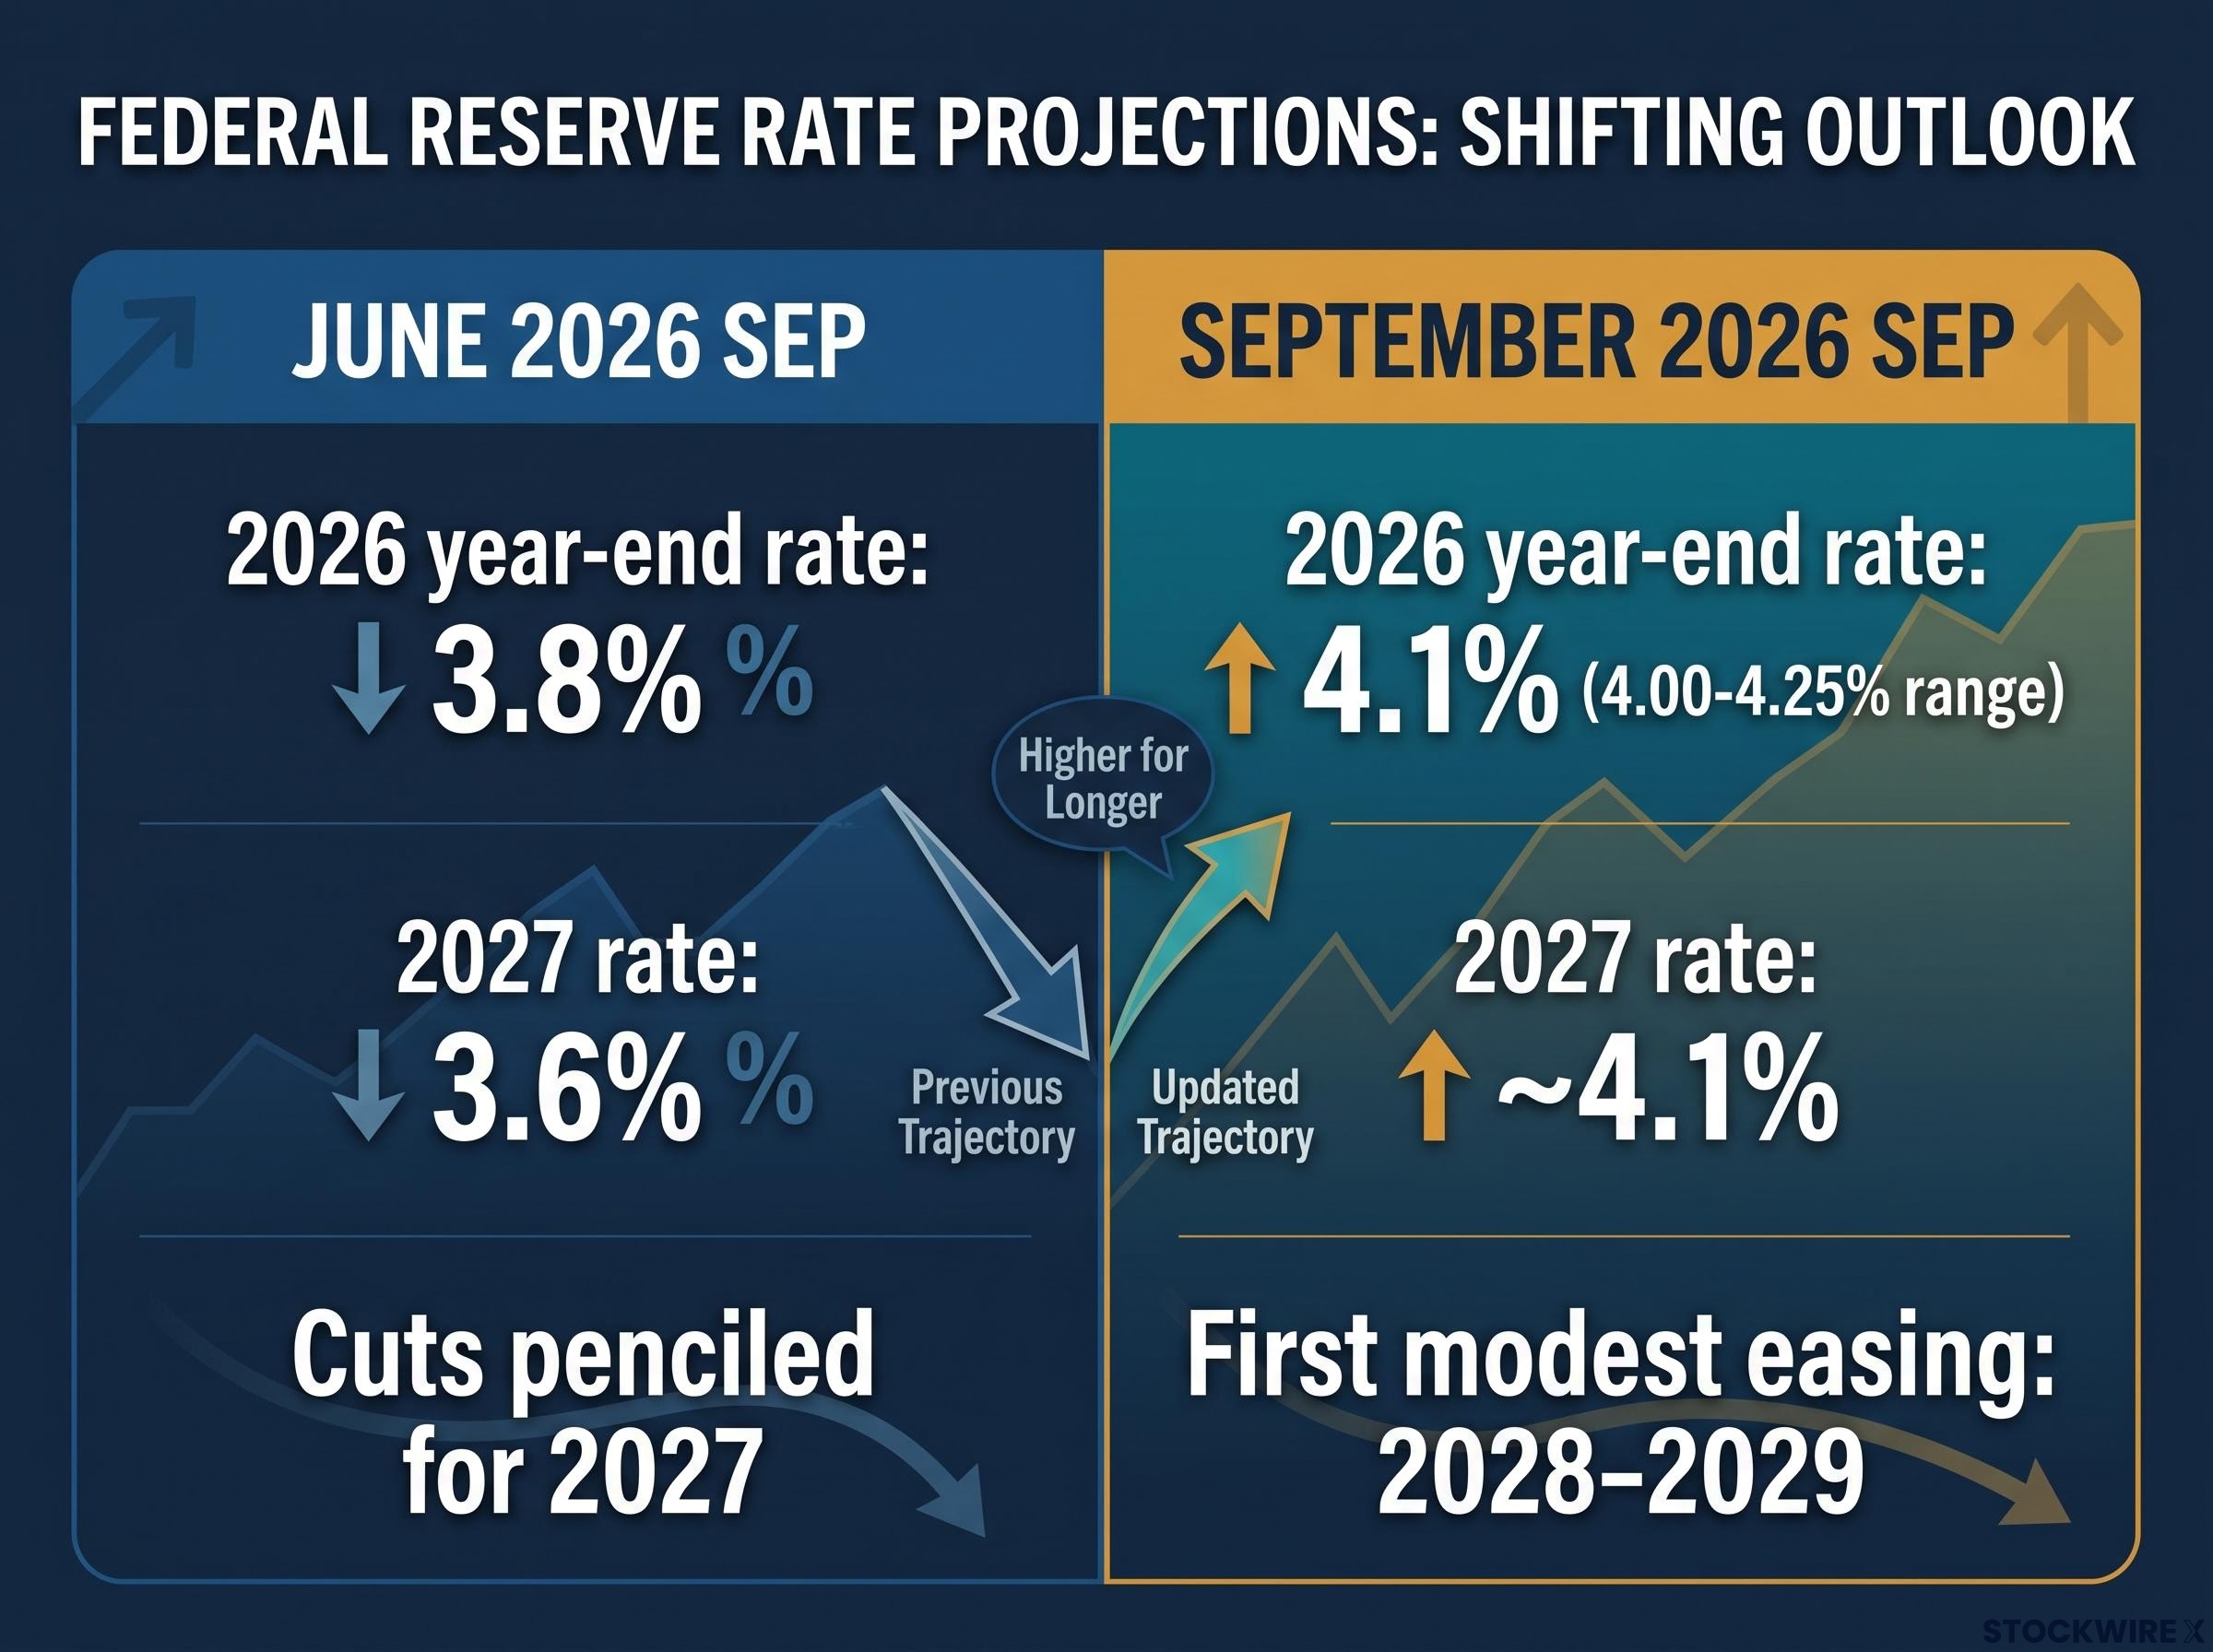
| Metric | June 2026 SEP | September 2026 SEP |
|---|---|---|
| 2026 year-end federal funds rate | 3.8% | ~4.1% (4.00-4.25%) |
| 2027 federal funds rate | 3.6% | ~4.1% |
| First projected easing | Cuts penciled for 2027 | 2028-2029 (modest) |
| 2026 headline PCE | Lower | 3.7% |
The September revision wiped out the cuts officials had projected for 2027 and implied the funds rate stays at its 2026 peak through the whole of next year. The first modest easing is not expected until 2028-2029.
Here is the read you should take from that. A committee that has revised its rate path higher throughout this cycle has now eliminated its own projected 2027 cuts. That track record of overestimating easing speed means the 2028-2029 window deserves to be treated as a best case, not a baseline. The SEP projects PCE inflation easing to 2.3% by 2027, while PNC and J.P. Morgan analysis does not expect inflation to return fully to 2% until around 2029, and the CBO baseline puts it near 2% by 2030.
Practical pressure points for a higher-for-longer environment
A rate held near 4.00-4.25% through at least 2027 does not sit in the abstract. It presses on specific parts of your financial life.
- Housing: Mortgage rates stay elevated, weighing on affordability and residential investment, and keeping activity subdued.
- Corporate credit: Higher benchmark rates lift corporate funding costs, adding pressure on leveraged firms and tightening conditions in high-yield and private credit.
- Consumer borrowing: Elevated rates on credit cards and auto loans restrain spending, particularly for more indebted households.
- Government interest expenses: Higher rates raise the cost of servicing the deficit, compounding the debt trajectory toward 120% of GDP by 2036.
The last point closes the loop with the earlier deficit discussion. Tight policy aimed at curbing fiscally-driven demand also raises the cost of carrying the deficit itself, a self-reinforcing dynamic that makes the delay harder to unwind.
What the Fed still needs to see before the picture changes
Goolsbee set a clear evidentiary bar. Before the Fed can act, he wants demonstrable evidence that inflation is resuming its downward trajectory, not a single soft print but a sustained trend.
Goolsbee’s FOMC dissent statement from December 2025 documents his concern that further easing required clearer evidence of sustained disinflation, establishing the evidentiary bar he has consistently applied and that the September 2026 SEP data has yet to clear.
Translating the September 2026 projections into a monitoring framework gives you three variables to watch:
- PCE trajectory: sustained monthly readings moving convincingly toward the 2% annual target.
- Labour market: unemployment holding at or above 4.1% without deteriorating sharply.
- Fiscal impulse: the deficit not adding further stimulus to an economy already running hot.
The gap between where inflation currently sits and where it needs to go is instructive. The Cleveland Fed reported a median PCE reading of +0.2% month-over-month for July 2026 in its 29 September 2026 update. That is a single monthly figure, and one soft print does not confirm a trend, which is precisely why you should not read any individual reading as a signal that the policy path is about to shift.
The CBO’s baseline is more sanguine, projecting inflation returns to roughly 2% by 2030, with the SEP putting 2027 PCE at 2.3%. Given how many times the committee has revised its path upward this cycle, those official projections are better treated as optimistic anchors than precise forecasts.
For investors wanting to build a framework for interpreting the September 2026 revision against futures pricing, our full explainer on dot plot vs market pricing examines the historical episodes where one signal proved more accurate and the conditions that determined which to trust.
Goolsbee has questioned whether the conventional approach of looking through supply-side price shocks still holds, and has noted that the Fed’s mandate does not include keeping the bond market satisfied or shielding equity investors from surprises.
That reexamination matters more than it might first appear. If the Fed stops automatically discounting supply-side price pressures, the bar for cuts rises further, and market narratives about imminent easing become easier to dismiss. Knowing what the committee is actually watching gives you a way to evaluate incoming data on its own terms rather than reacting to every softer-than-expected print.
Making sense of a delay that now has a timeline
The four threads converge on a single conclusion: this delay is structural, not tactical. Persistent fiscal stimulus, a labour market that will not soften, and the forward-looking risk that AI optimism boosts demand before it lifts supply form a reinforcing system, and no one of them reverses on its own.
That is why the current best-case easing window of 2028-2029, and the return-to-target range that analysts place around 2029-2030, should be read as a starting point rather than a promise. Each driving force needs a visible, sustained reversal before the committee’s calculus changes.
Goolsbee’s position sharpens the point. As a 2027 voter who sits more optimistic than the committee median and who has set a clear evidentiary bar, he will be a meaningful voice at exactly the meetings where easing first becomes plausible. If the optimist is not yet convinced, the wait is real.
For anyone watching for the turn, three variables are worth tracking:
- PCE trajectory: several consecutive months of genuine deceleration, not one print.
- Fiscal impulse: any shift in the deficit path that reduces net stimulus.
- AI productivity data: evidence that investment is finally generating measurable supply-side gains.
This article is for informational purposes only and should not be considered financial advice. Investors should conduct their own research and consult with financial professionals before making investment decisions. Past performance does not guarantee future results. Financial projections are subject to market conditions and various risk factors, and forward-looking statements are speculative and subject to change based on economic developments.