
At 13:45 GMT today, a survey of senior US business executives lands on trading desks worldwide, and depending on what it says, it will either validate the Federal Reserve’s freshly hawkish posture or begin quietly undermining it. The September 2026 flash purchasing managers’ index from S&P Global is one of the few releases that can move the Dollar, reprice rate expectations, and reshape the entire macro narrative inside a single hour.
The context makes it unusually loaded. The Fed raised rates to 3.75%-4.00% just one week ago, its first hike in roughly nine months, and its own projections point to a policy rate near 4.1% by year-end. That path assumes the economy holds up under the weight of restrictive policy, and today’s data is one of the earliest September reads on whether it is.
Here is what you will take away. By the time the numbers print, you will know what the manufacturing and services readings are expected to show, why those figures feed straight into Fed rate expectations and Dollar pricing, and how to interpret whatever result comes through without waiting for a commentator to tell you what it means.
What the flash PMI actually measures, and why it moves markets before GDP does
You already recognise the headline signal: a number above or below 50. That single threshold does most of the work. But underneath it sits a mechanism that explains why a sentiment survey carries harder consequences than its “soft data” label suggests.
The flash PMI is a preliminary, survey-based estimate. S&P Global collects responses from senior private-sector executives across US manufacturing and services industries, asking them how business conditions have changed month over month. It arrives weeks ahead of comparable official government statistics, which is precisely why it matters.
Today’s release contains three separate readings. The Manufacturing PMI captures conditions across factories and goods producers. The Services PMI measures the far larger services economy, everything from finance to hospitality. The Composite PMI blends the two into a single weighted figure for overall private-sector activity.
What executives report on falls into five categories:
- Production levels
- Trade flows
- Capacity usage
- Workforce levels
- Inventory conditions
Each response feeds into an index reading that tells you not just direction but intensity.
Why the 50 line does the heavy lifting
The 50-point threshold is the structural pivot. A reading above 50 signals expansion in that sector; a reading below 50 signals contraction. The distance from 50 tells you how forceful the move is: 56 is a stronger expansion than 51, and 47 is a deeper contraction than 49.
The reason this survey moves hard markets comes down to timing. Official figures on GDP, industrial output, and employment arrive with a lag of weeks or months. The flash PMI gives traders their first directional read on the economy’s health for the month, before anything official confirms it. That head start is what turns a business sentiment survey into a price-moving event, and it is why professionals never dismiss it as anecdotal.
Professionals approach reading PMI data through a four-step sequence: note the composite direction, disaggregate manufacturing from services, check forward sub-indices such as new orders and prices, then cross-reference one hard-data input before updating any position.
When big ASX news breaks, our subscribers know first
What today’s September numbers are expected to show
The interesting question today is not whether the US economy is expanding. Both major sectors are forecast to stay comfortably in growth territory. The question is by how much it is decelerating, and what the gap between expectation and result tells the Fed about the durability of that growth.
Consensus points to modest softening from a position of genuine strength. The Manufacturing PMI is expected to come in around 53.5-53.6, down from a prior reading of 53.9. The Services PMI is forecast at 56.0, easing slightly from 56.5 in August.
You will notice the manufacturing figure carries a small range. That reflects a minor discrepancy between forecast vintages: the original source cites 53.5, while FXStreet’s 23 September preview cites 53.6. This is rounding, not disagreement. Both point to the same thing: solid expansion, a touch softer than last month.
| Component | Prior Reading | September Consensus | Directional Signal |
|---|---|---|---|
| Manufacturing PMI | 53.9 | 53.5-53.6 | Modest softening, firmly in expansion |
| Services PMI | 56.5 | 56.0 | Slight easing, comfortably in expansion |
No composite consensus figure is available in current sources, so treat the two component readings as the numbers to anchor on.
Both readings are expected to stay above 50, marking continued private-sector expansion despite the Fed delivering its first rate hike in nine months.
For you as a reader, the significance sits in the direction and the gap from prior, not the absolute level. A print that matches or beats these forecasts confirms the economy is still absorbing rate hikes without real damage. A meaningful miss reopens the question of whether cumulative tightening is biting harder than the Fed’s own projections assume. Knowing the benchmark before the release is what lets you read the headline in context rather than reacting to it blind.
The Fed just hiked rates: why PMI data carries extra weight right now
This is where a routine monthly data point becomes a public stress test of the Fed’s own assumptions, priced in real time.
On 16 September 2026, the Federal Open Market Committee voted unanimously, 12-0, to raise the federal funds target range by 25 basis points to 3.75%-4.00%. It was the first hike since 2023, and it followed roughly nine months of the rate sitting in the 3.50%-3.75% range since December 2025.
The Fed rate hike market impact that followed the September 2026 decision ran counter to typical investor intuition: the S&P 500 gained 1.14% and the Nasdaq jumped 1.69% the session after the unanimous 12-0 vote, reflecting how certainty about the policy path can outweigh the mechanical cost of higher borrowing rates.
Here are the key policy markers to hold in mind:
- Federal funds target range: 3.75%-4.00%
- Interest on reserve balances: 3.90%, effective 17 September 2026
- Primary credit rate: 4.00%, effective 17 September 2026
- Median year-end 2026 projection: 4.1%, central tendency 4.1%-4.4%
- PCE inflation: running around the mid-3% range, above the Fed’s 2% target
The FOMC’s 12-0 vote and its 4.1% median year-end projection tell you the Fed is not close to easing. Its own dot plot embeds at least one further hike and no cuts until later years.
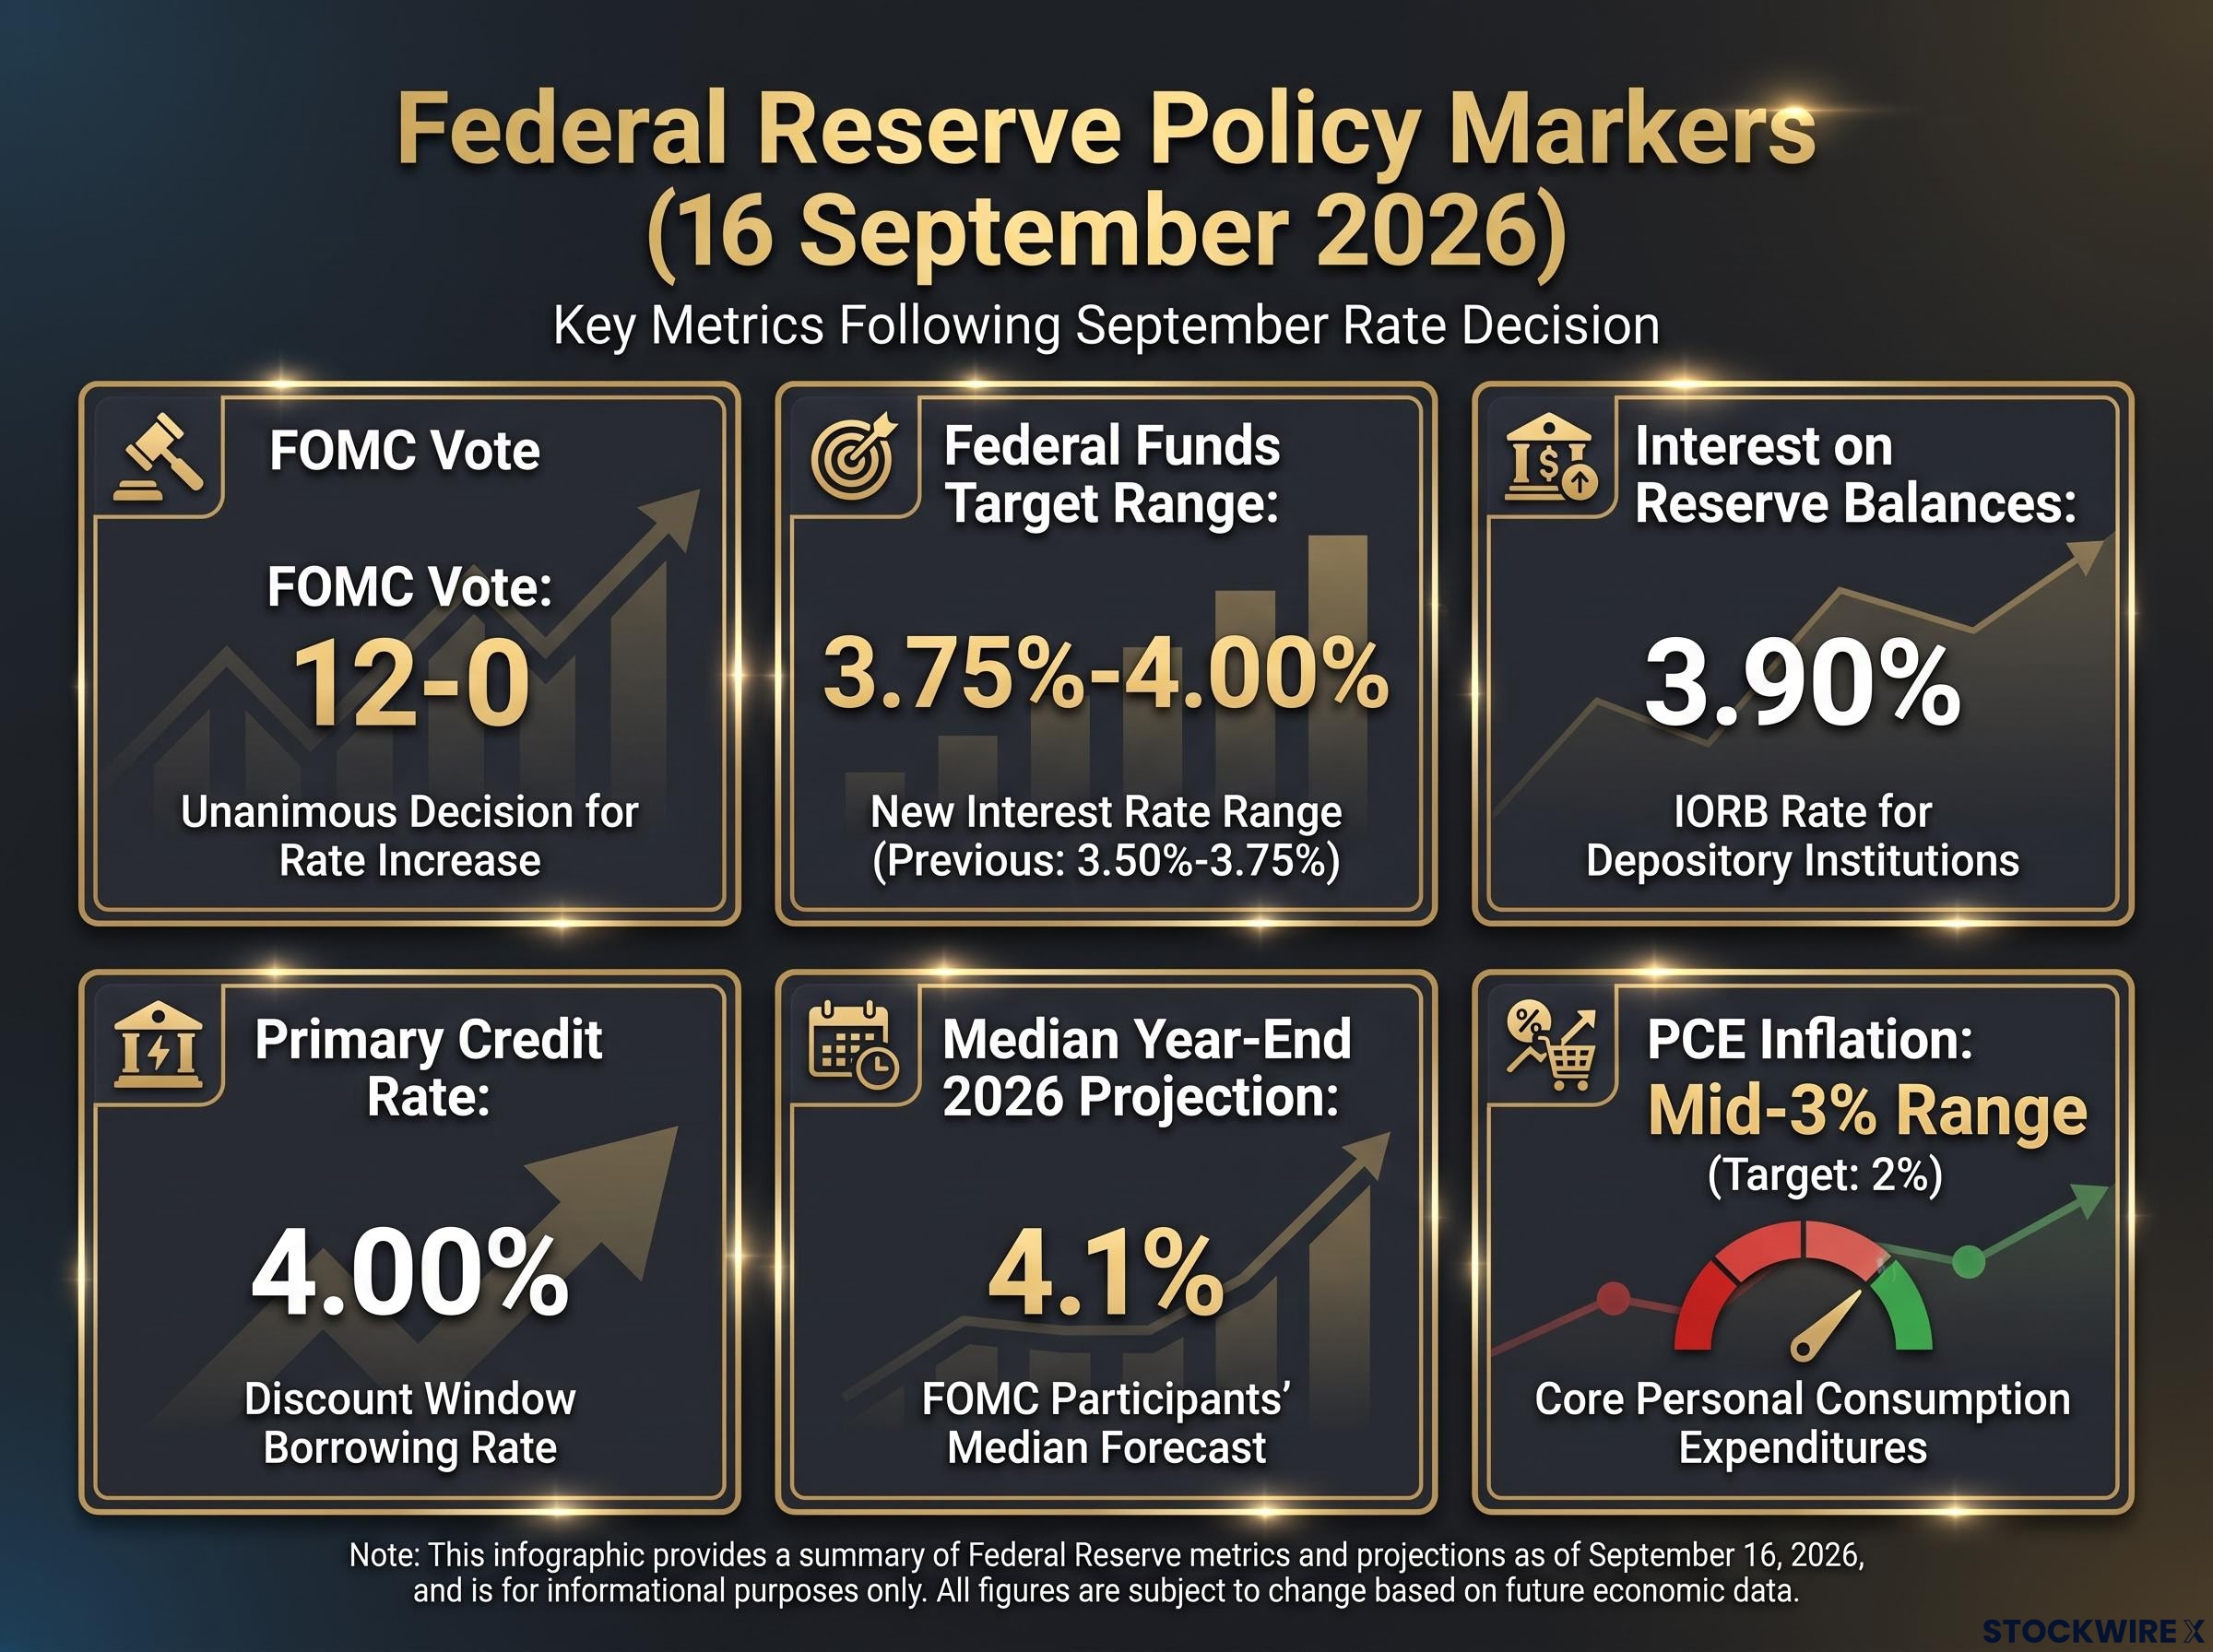
The reason the Fed is tightening even as activity holds up is the inflation backdrop. With PCE inflation stuck in the mid-3% range, the central bank is openly managing a trade-off: stubborn price pressure on one side, durable consumer spending on the other.
That trade-off is exactly what today’s PMI speaks to. A reading confirming resilient expansion validates the higher-for-longer path baked into the Fed’s projections. A reading signalling unexpected softness raises the uncomfortable question of whether restrictive policy is already working faster than the dot plot assumes.
For you, this is why today’s release is not background noise. The Fed just moved for the first time in nine months, its projections imply more restraint ahead, and traders will reprice rate expectations within minutes of the print. The PMI is a live signal about whether those projections hold.
How a beat or a miss translates into Dollar and rate moves
To use this release in real time, you need the transmission channel, not just the directional outcome. The mechanism is the same in both scenarios: the PMI shifts the probability distribution of Fed rate decisions, and rate expectations are the primary driver of short-term currency moves right now.
Take the beat scenario first. A stronger-than-expected print confirms demand and output are holding up despite higher borrowing costs. That reinforces the higher-for-longer narrative, pushes yield differentials in the Dollar’s favour, and supports the Dollar through carry and a relative growth advantage over softer economies elsewhere.
Now the miss. A softer-than-expected reading suggests restrictive policy is biting harder than anticipated. Markets respond by pricing a lower future rate path or earlier cuts, US yield differentials compress against other major economies, and the Dollar tends to weaken.
| Scenario | Fed Rate Expectations | Dollar Impact |
|---|---|---|
| Beat (stronger than forecast) | Reinforces higher-for-longer; may extend restraint | Supported via wider yield differentials and carry |
| Miss (weaker than forecast) | Markets price lower path or earlier cuts | Weighed down as yield advantage compresses |
Historically, large positive PMI surprises have tended to strengthen the Dollar by reinforcing expectations that the Fed can hold restrictive policy without triggering a downturn. Negative surprises have done the reverse. With a fresh hike, a dot plot anchoring rates near 4.1%, and PCE still above target, the market’s sensitivity to today’s data is elevated well beyond a typical mid-cycle release. The Dollar index level heading into the print should be checked against a live feed, as it sits outside the research at hand.
The Dollar index breakout above 100 in the week of the September hike was driven by three simultaneous forces: the hawkish unanimous rate decision, Middle East geopolitical risk layering safe-haven demand onto yield differentials, and a technical breakout that cleared the mechanically loaded 100 level for the first time in roughly seven weeks.
Why even a strong print deserves careful reading
A strong number is not a clean all-clear, and there are three methodological limits worth holding onto.
First, PMIs are sentiment-based surveys, not hard activity data. They are excellent for direction but weaker as stand-alone guides to long-term growth. Second, flash estimates are preliminary and subject to revision when the final reading arrives later in the month. Third, sector-level strength can mask strain elsewhere: buoyant services do not guarantee health in interest-sensitive corners such as housing and capital goods.
Two analytical camps sit in the commentary, and both are legitimate. One reads strong PMIs as confirmation that extended restraint is justified. The other warns that strength concentrated in services can overstate broad momentum. You do not need to resolve the debate today, but you should hold both in view when the number lands.
What to watch for when the numbers land at 13:45 GMT
When the print hits, you want to be in an active stance, not a passive one. Here is the concrete checklist.
The most market-sensitive reading is likely to be the Services PMI. Services activity is the dominant engine of the US economy and the component the Fed watches most closely for inflation pressure, since services demand keeps upward pressure on exactly the prices most resistant to rate hikes.
Watch these three signals in order:
- Whether the Services PMI beats or misses the 56.0 consensus
- Whether the Manufacturing PMI beats or misses the 53.5-53.6 consensus
- Whether the two components tell the same directional story or diverge
The size of the deviation from consensus matters as much as the direction. A services print of 56.5 against a 56.0 forecast is a very different story from 53.0 against 56.0.
The Composite PMI gives you the unified headline, but traders will pull the two components apart for a more granular read on where momentum is concentrated or missing. Remember, no composite consensus is available in current sources, so the component gaps are your reference points.
There is a global overlay too. US readings are judged against activity elsewhere. A resilient US print alongside softer readings abroad tends to widen the growth and yield differential that underpins Dollar strength.
The practical takeaway is that the first reaction to the headline may not be the last word. Watch how the components break down, and whether services and manufacturing agree. Divergence complicates both the Fed’s read and the market’s pricing, and that is where the more interesting move often develops.
What the PMI result will and will not settle
Today’s flash PMI is a leading indicator of whether the US economy is absorbing the Fed’s restrictive policy without stalling. Its result will either reinforce the higher-for-longer path or introduce the first genuine uncertainty about how durable that path really is.
Here is a clean way to frame it.
What it will tell you:
- Whether both sectors are still expanding despite the September hike
- Where momentum is concentrated, in services or manufacturing
- Which direction rate expectations and the Dollar lean in the near term
What it will not settle:
- Whether one month’s flash reading marks a genuine trend, given it is a preliminary estimate subject to revision
- Whether the Fed’s dual mandate is resolved, since PCE inflation remains around the mid-3% range regardless of today’s print
The 4.1% median year-end projection is the policy anchor this data tests, but does not alone determine. The Fed will weigh today’s numbers against PCE, employment, and later hard-activity figures before its next move.
For readers wanting to understand the structural constraint shaping how far the Fed can realistically push rates, our deep-dive into fiscal dominance and the limits of Fed tightening explains why US federal debt at roughly 122% of GDP means each additional hike imposes fiscal costs four times faster than the Volcker campaign did in 1981.
So hold your interpretation with appropriate calibration. A single beat does not confirm the economy is invincible, and a single miss does not prove tightening has broken it. The PMI sets the tone; the reading will evolve as the rest of the month’s data arrives. Resist over-indexing on the first market reaction.
This article is for informational purposes only and should not be considered financial advice. Investors should conduct their own research and consult with financial professionals before making investment decisions. Past performance does not guarantee future results, and forward-looking projections are subject to market conditions and various risk factors.