When you buy an option, you probably watch two things: where the stock is heading and how volatile it looks. Those inputs matter. But they are not the only forces setting the price on your screen.
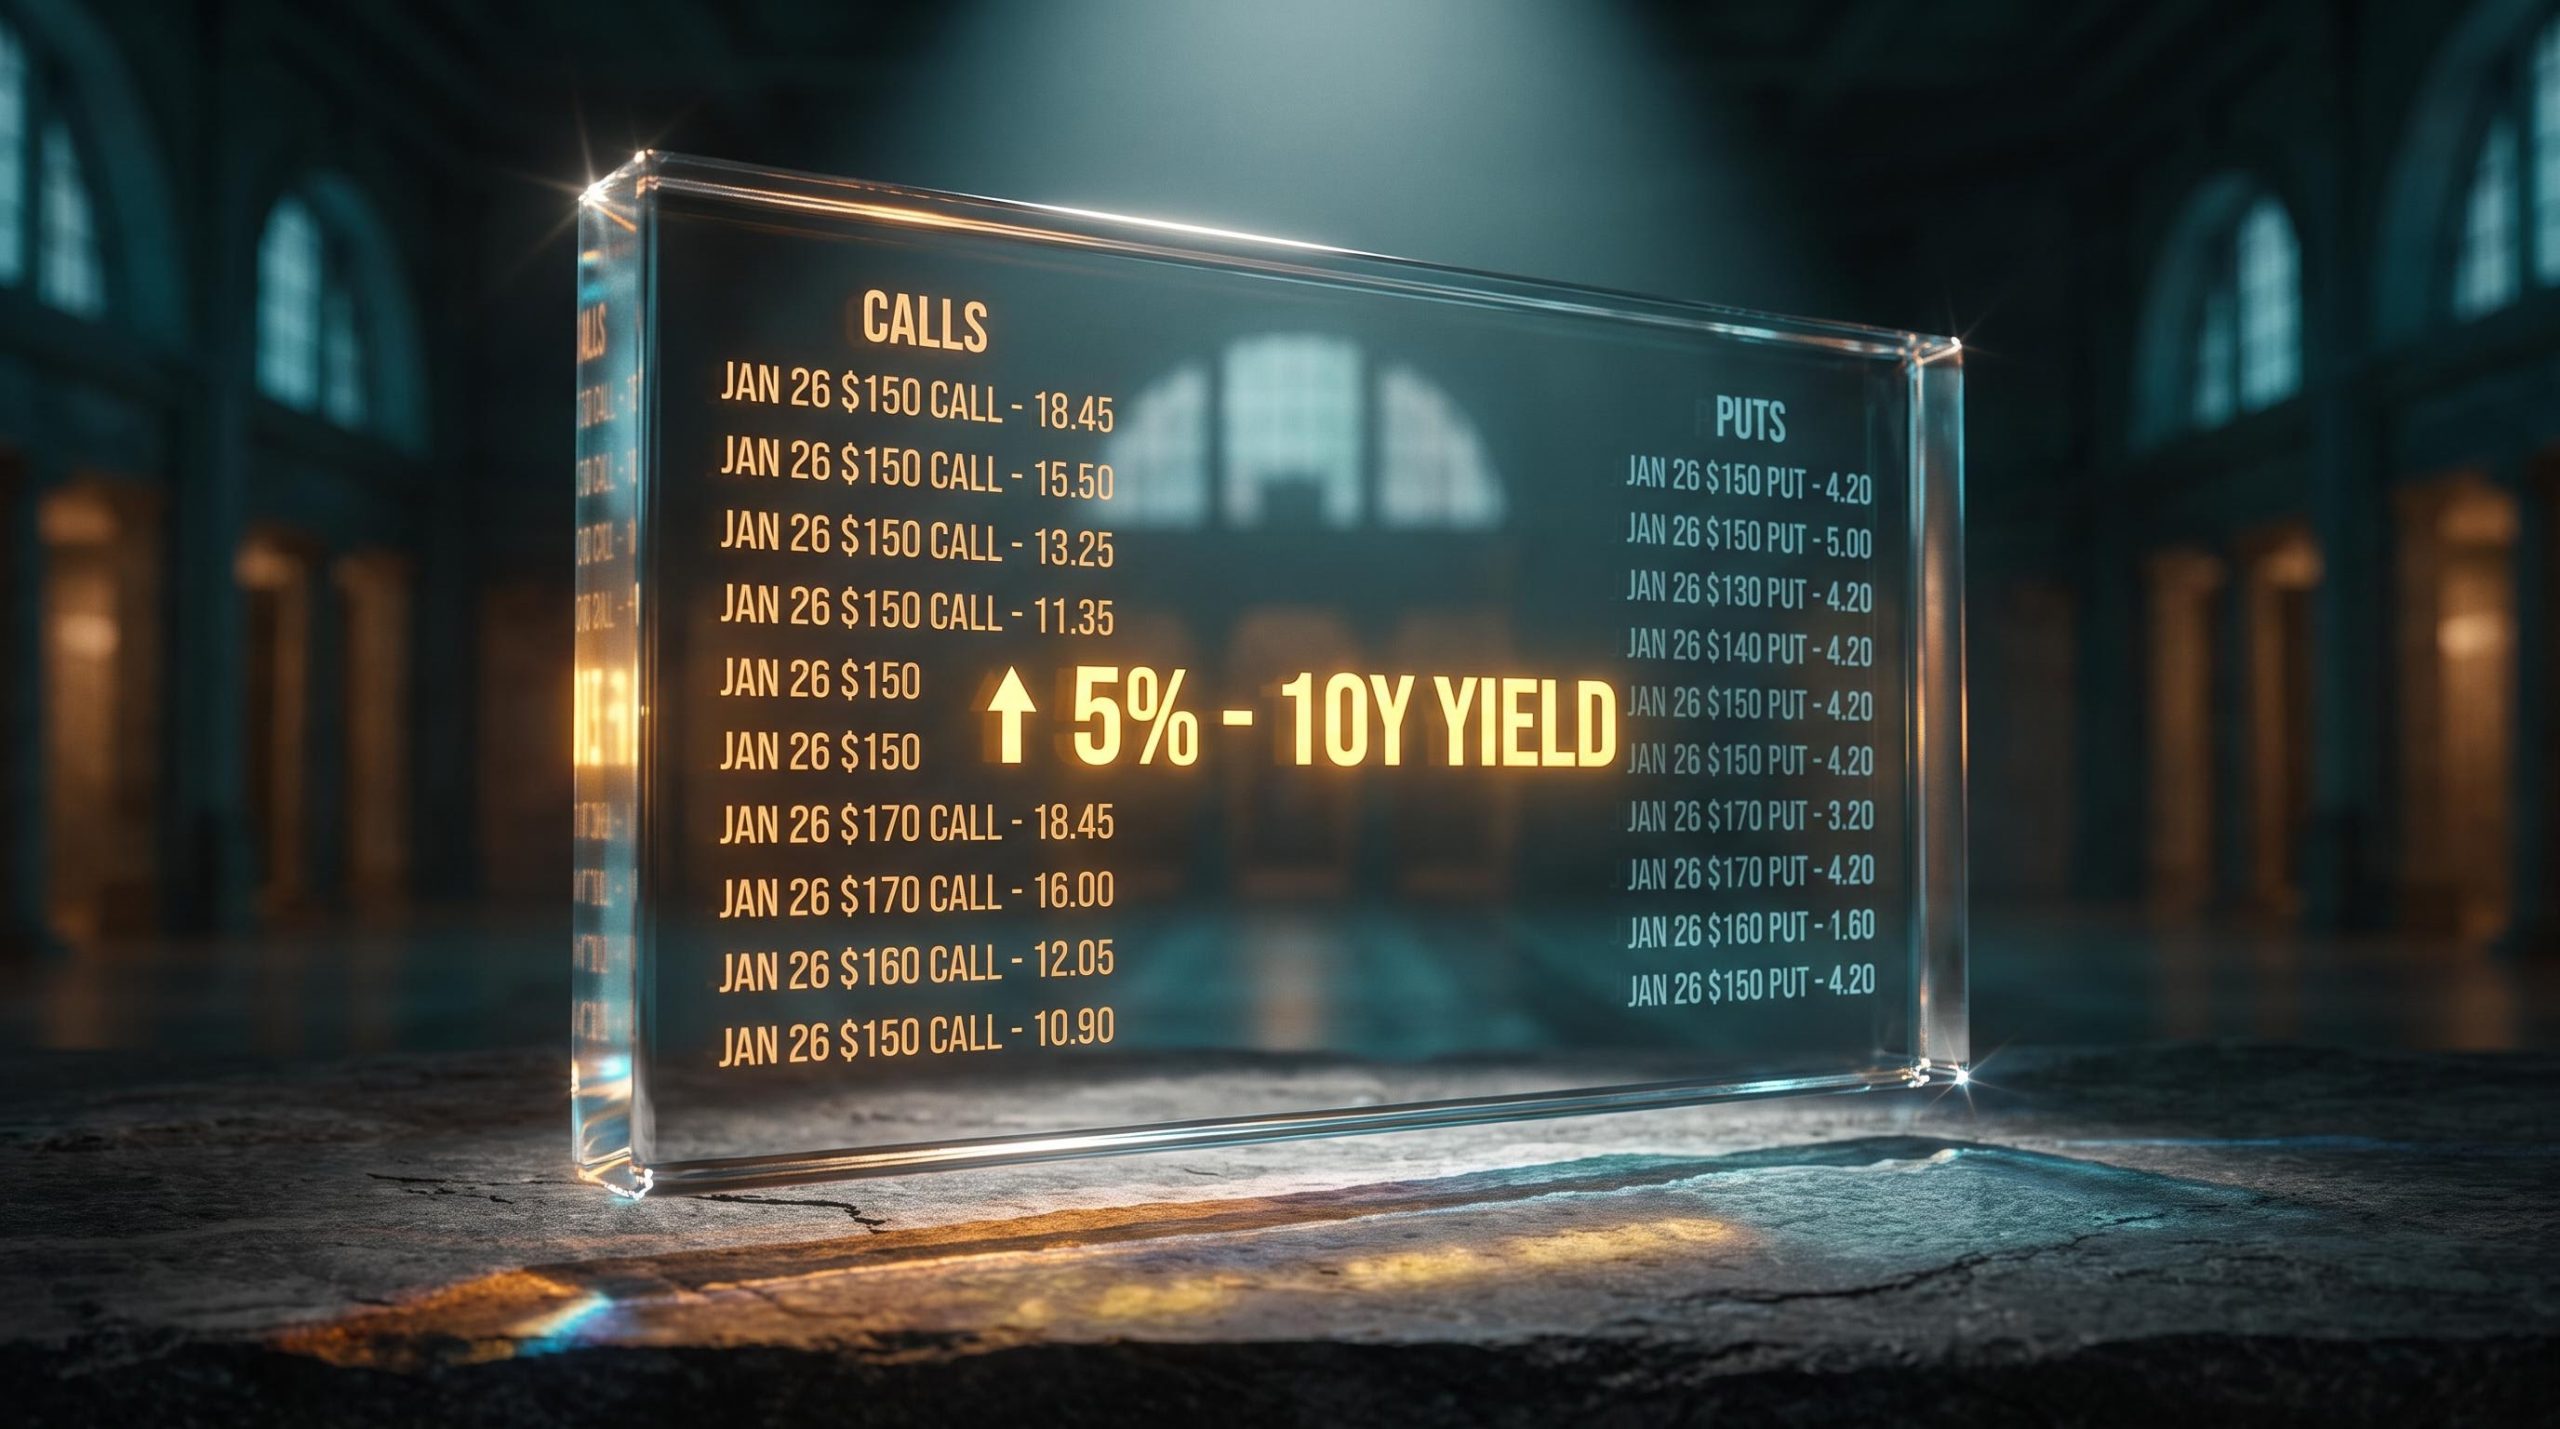
There is a third input, and in 2026 it has teeth. With the US Federal Funds target range sitting at 3.75-4.00% and the 10-year Treasury yield hovering near 5%, the cost of holding capital has become a material driver of options pricing. Interest rates now reprice calls and puts even when the stock and its implied volatility have not moved at all.
This matters most for anyone holding long-dated positions. What follows here is a working framework for how capital costs skew call and put premiums, so you can stop overpaying for time and start reading a price the way a market maker does.
How the cost of carry defines forward value
Look at an options chain and you will notice something odd. The synthetic price of the stock built from options rarely matches the ticker price on your dashboard. That gap is not an error. It is the market telling you what capital and time cost.
Options are priced off the forward value of the underlying asset, not its current spot price. The forward value is what the asset is expected to be worth at expiry once you account for the cost of holding it until then.
That holding cost has a name: cost of carry. It is the financing cost or opportunity cost of tying up capital in a position over time. If your money is sitting in shares, it is not sitting in risk-free Treasury bills earning interest, and options models price that trade-off in.
Higher interest rates lift the forward price above spot. The logic is direct: holding the asset requires capital that could otherwise be earning the risk-free rate, so the forward has to compensate for that foregone return.
The fair forward price for a non-dividend stock is captured by a single formula.
F = S × e^(rT) where F is the forward price, S is the current spot price, r is the risk-free interest rate, and T is the time to expiry in years.
One point deserves emphasis. Implied volatility has no effect on the embedded cost of carry. Carry is a separate, distinct input driven by rates and time, not by how much the market thinks the stock will swing.
The difference between spot and forward pricing
So why do pricing models ignore the ticker price you actually see? Because that price reflects the present, and an option settles in the future. The model needs to know what the asset is worth at expiry, not today.
The bridge between the two is opportunity cost. Deploying cash into shares means giving up the interest that same cash could earn parked in Treasury bills, and the forward price bakes that lost interest back in.
The difference between spot and forward tells you exactly what the market charges for time and capital. In a high-rate environment, that charge is not trivial, and you must factor it into your strike selection. A call that looks structurally expensive may not be a volatility event at all. It may simply be carry.
When big ASX news breaks, our subscribers know first
Put-call parity and the asymmetry of elevated rates
Here is where rates start pulling calls and puts in opposite directions. The mechanism is a relationship called put-call parity, and once you see the scales it uses, the asymmetry stops looking mysterious.
Put-call parity is the no-arbitrage link between a call, a put, and the underlying at the same strike. For a non-dividend stock it is written as:
C – P = S – PV(K)
Read that carefully. PV(K) is the present value of the strike price, and present value shrinks as interest rates rise. When PV(K) falls, the left side of the equation, C – P, has to grow to keep the relationship balanced.
That growth resolves in a predictable direction. Call prices rise and put prices fall. This is what the Greeks capture as positive rho for calls and negative rho for puts.
The intuition behind the split is worth holding onto. Consider what a 5% rate environment does to each side.
- Buying a call: You control the upside while delaying payment of the strike. Your cash stays in your pocket earning interest until you exercise. Higher rates make that deferral more valuable, so the call is worth more.
- Buying a put: You are buying the right to receive a fixed cash amount later. As rates rise, the present value of that future cash erodes, so the put is worth less.
- The financing angle: Higher margin borrowing costs make shorting stock more attractive than buying puts, since a short position can earn interest. That pulls put demand and put pricing lower still.
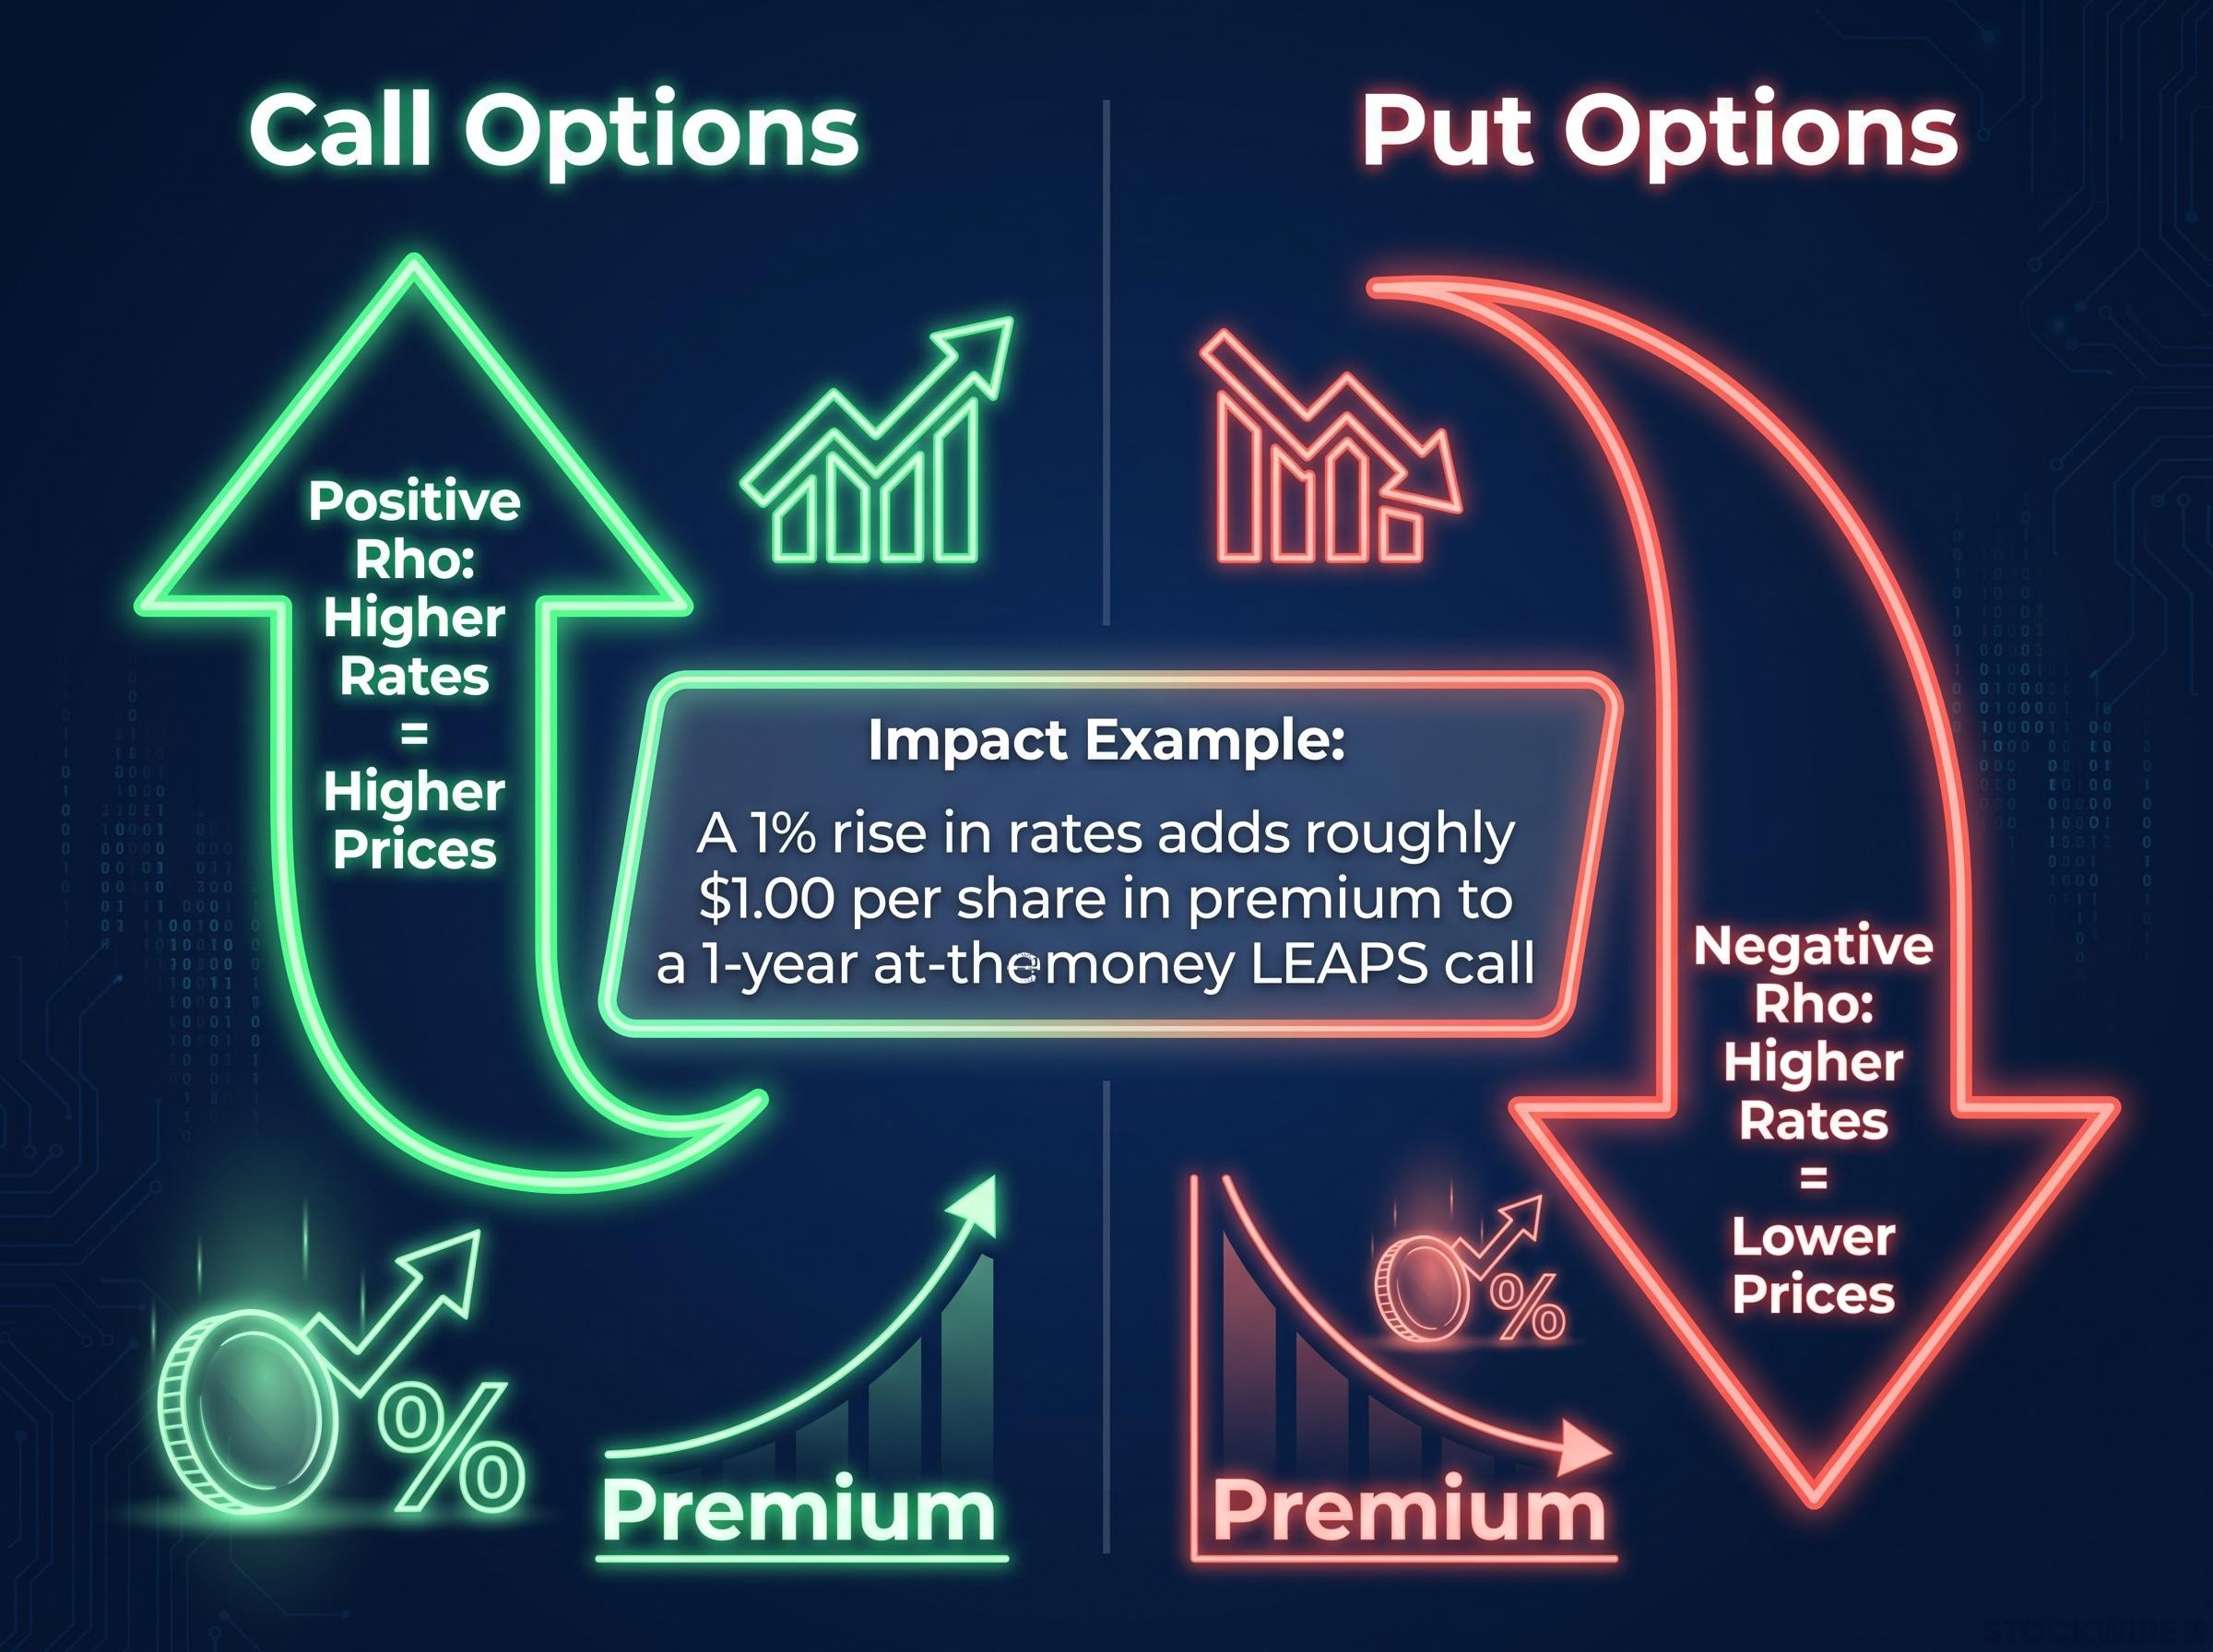
The scale of the effect grows with duration. On a 1-year at-the-money call structured as a LEAPS contract, a 1% rise in rates can add roughly $1.00 per share in premium. On a weekly, you would barely notice it.
What this means for you is straightforward. When you buy a call in this environment, you are paying a premium for the privilege of holding your cash while controlling upside. Put buyers pay the opposite penalty for delaying their receipt of cash. Recognising that lets you spot when a market maker’s pricing simply reflects borrowing costs rather than any directional view, so you avoid overpaying on synthetic positions.
The dividend offset effect on option premiums
Rates are only half the carry equation. The other half pulls the forward price in the opposite direction, and it is dividends.
Dividends are the exact counterweight to interest rates. Where high rates push the forward price up, expected dividends push it down, because option holders do not collect the cash payouts that shareholders receive. The stock typically drops by the dividend amount on the ex-date, and options price that drop in ahead of time.
The dividend-adjusted forward formula shows both forces sitting side by side:
F = S × e^((r – q)T)
Here q is the continuous dividend yield. Subtract it from the financing rate r and you get the net cost of carry: financing rate minus income yield. The two inputs partially offset each other.
The practical rule follows naturally. High-dividend stocks behave like lower-forward underlyings, which makes their calls structurally cheaper and their puts structurally richer than a non-dividend equivalent at the same spot. An educational illustration cited in options research shows an at-the-money call on a stock with a 2% dividend yield trading noticeably cheaper than the zero-dividend case, while its matching put trades richer.
Think of a high dividend yield as a gravitational pull on the forward price. It means you need a different baseline expectation when trading income stocks than when trading growth names. Applying rate-driven bullishness to a high-yield equity without adjusting for the dividend drag can quietly cost you, because the ex-date drop is predictable and already priced.
The summary below captures the two forces and how they move calls and puts.
| Variable | Direction of change | Effect on calls | Effect on puts |
|---|---|---|---|
| Interest rates | Rise | Higher | Lower |
| Interest rates | Fall | Lower | Higher |
| Dividends | Rise | Lower | Higher |
| Dividends | Fall | Higher | Lower |
Managing rho and trade duration in a 4 percent world
All of this sensitivity to rates lives in a single Greek. Rho measures the dollar change in an option’s price for a 1% change in the risk-free rate, holding everything else constant. If a call’s rho is 0.25, a one-point rate rise lifts its price by $0.25 per share.
The reason rho was ignored for most of the past decade is that its impact depends heavily on time. On a 0DTE or weekly option, the effect is close to nothing. On a 6-month to 24-month LEAPS, it becomes a dominant force.
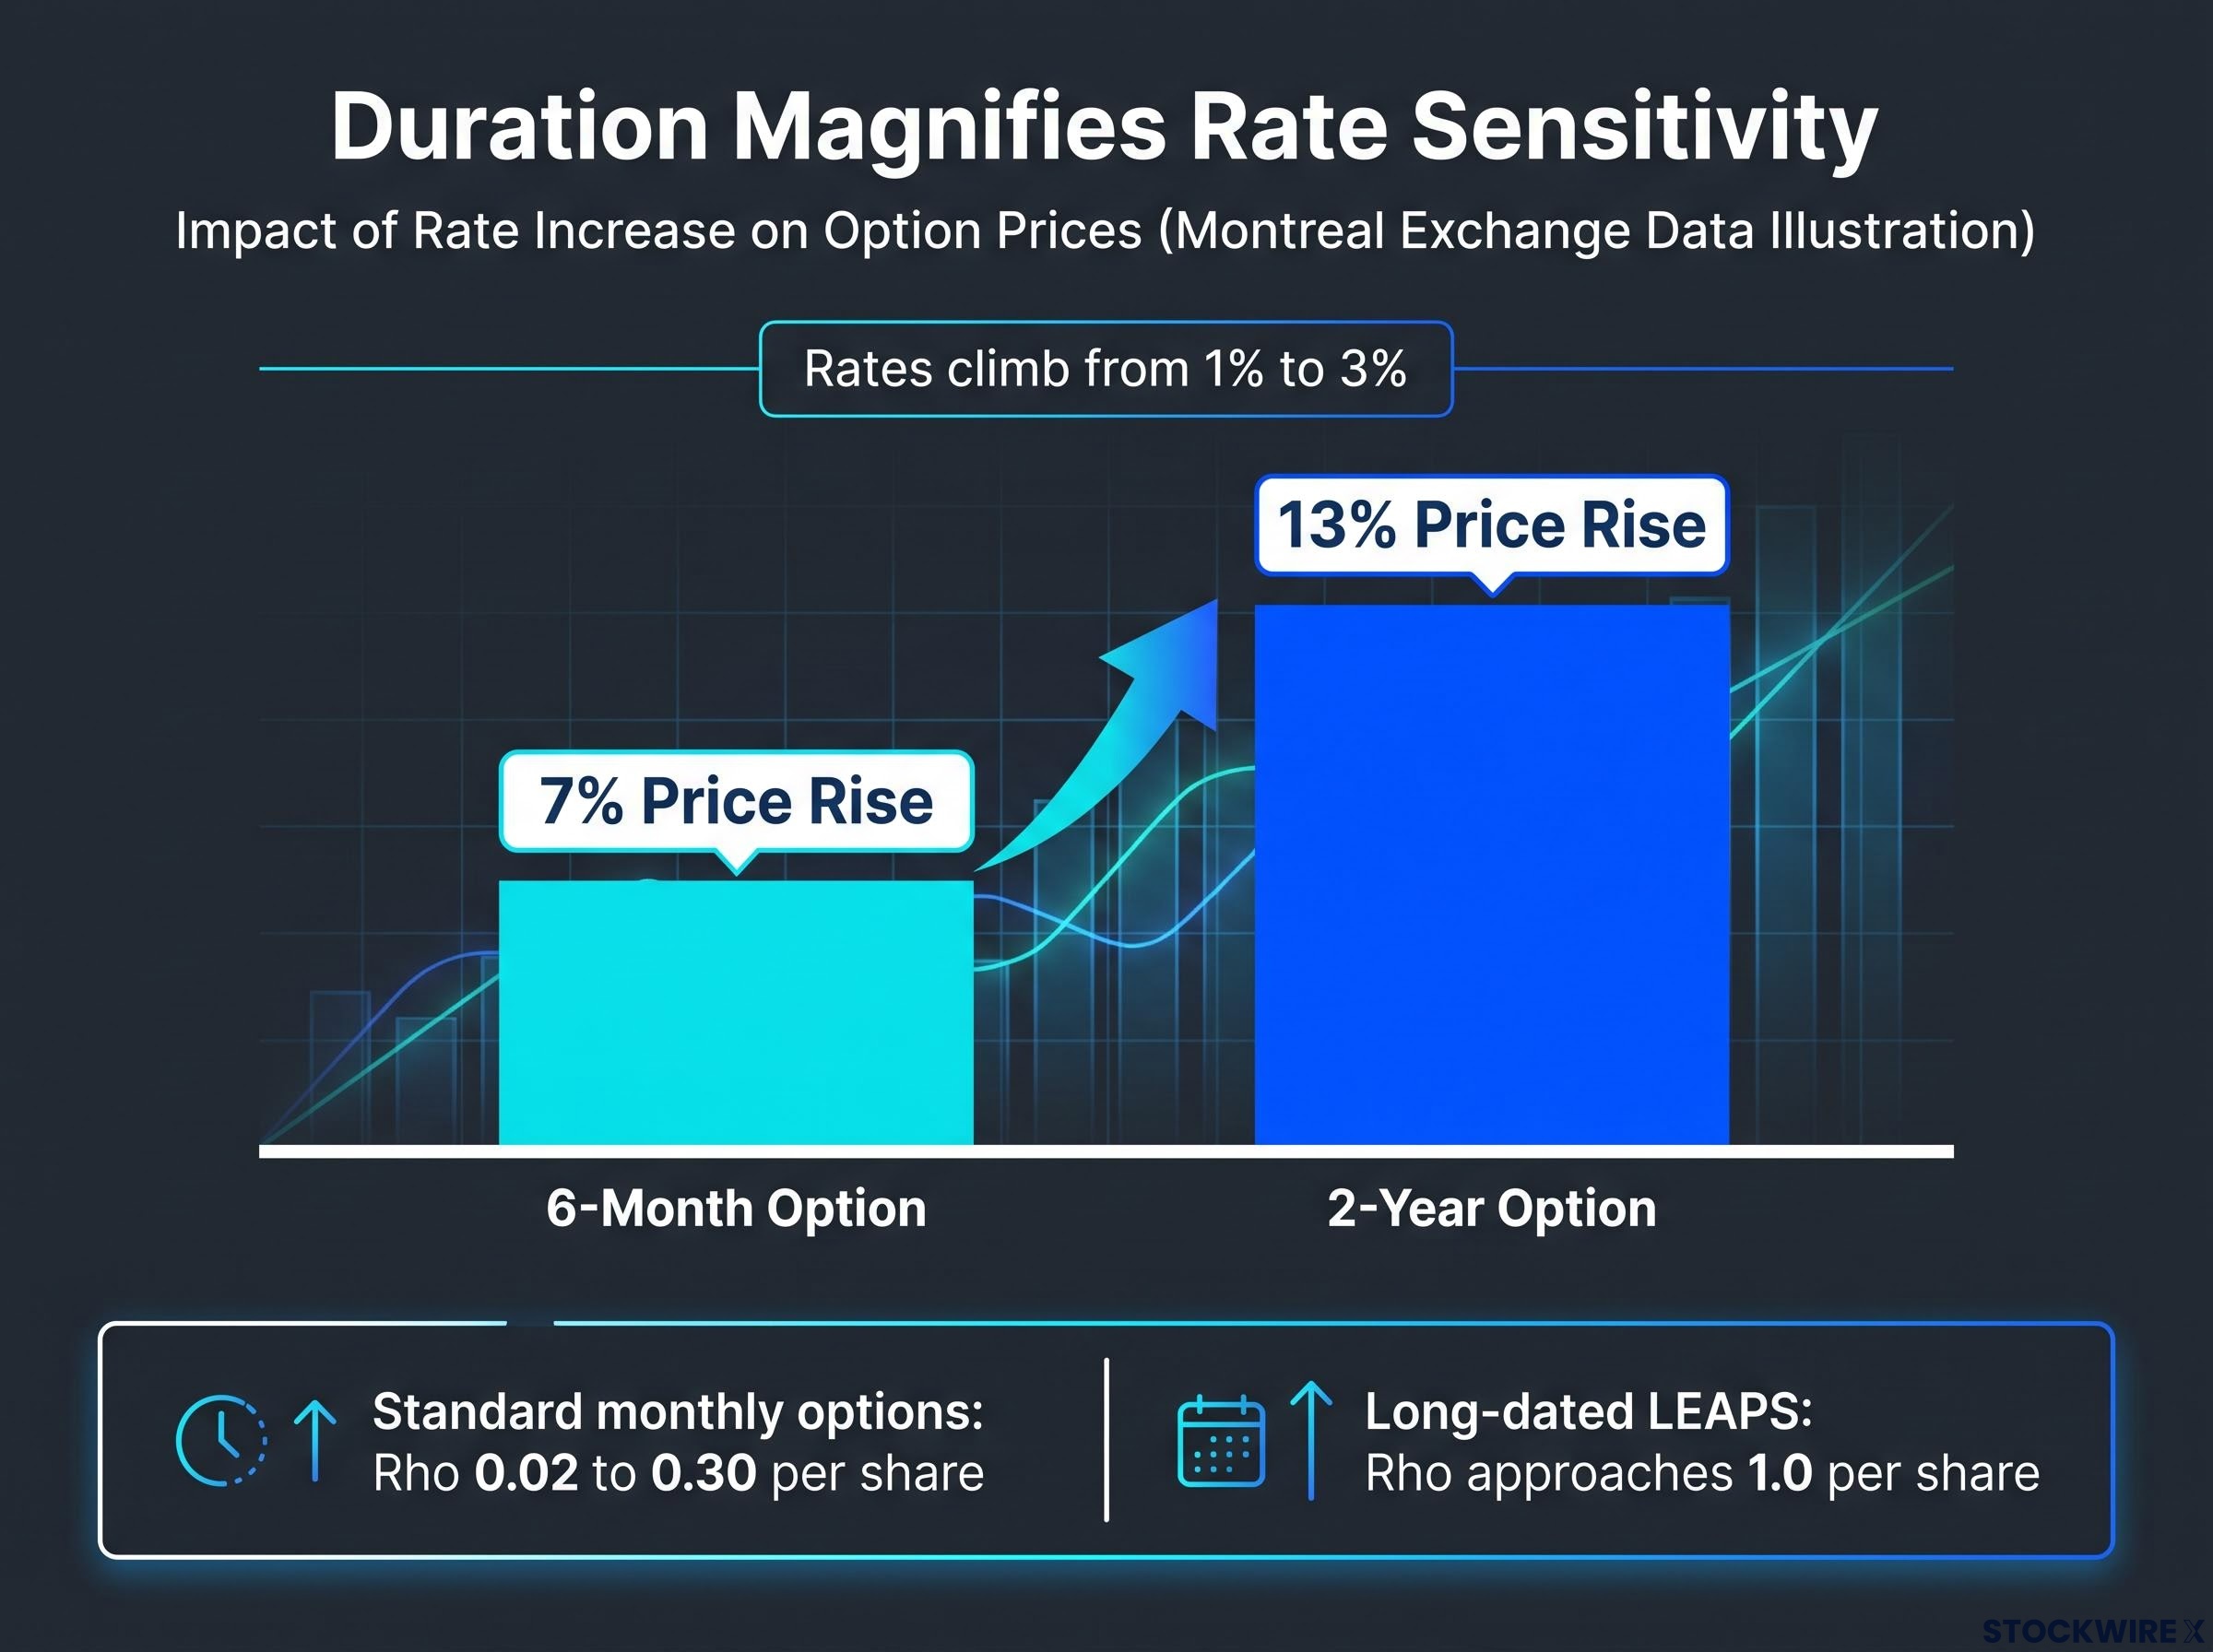
The magnitudes tell the story. Standard monthly options typically carry rho values roughly in the range of 0.02 to 0.30 per share. Long-dated LEAPS can approach 1.0 per share, which means a 10-contract position moves around $1,000 for every 1% shift in rates.
The Montreal Exchange put concrete numbers on the duration effect. According to its technical work, a 2-year option’s price rises about 13% when rates climb from 1% to 3%, versus only 7% for a 6-month option on the same move. Longer tenors absorb rate changes disproportionately.
What this means for you is that your risk parameters can no longer stop at delta and theta. For any position stretching beyond 90 days, rho belongs in the same conversation, because at that duration rate sensitivity becomes a genuine driver of your profit and loss.
Adjusting your strategy selection
Translating this into trade decisions comes down to a few disciplined checks.
- Evaluate duration first. For directional trades, extending expirations beyond 31 days gives the position time to develop. But every extra month adds carry, so calculate the rho exposure you are taking on before you commit.
- Prefer calls over stock for bullish exposure. On low-dividend or non-dividend names, a call lets you defer the strike payment while your capital earns interest, an edge that grows with rates.
- Reassess protective puts. As rates rise, shorting stock earns interest and buying puts does not, which structurally depresses put pricing. Weigh that before defaulting to puts as a hedge.
- Account for financing drag on carry strategies. Covered calls and collars hold long delta, so elevated margin and stock-loan costs now embed a real financing cost that eats into returns.
- Size to the exposure, not the excitement. When long-dated premiums are inflated by carry, a smaller position controls the same rho risk. Trading a single contract carries no disadvantage.
The takeaway is a matter of knowing when rates matter and when they do not. For ultra-short trades, you can safely ignore rho. For structural, long-dated positions, it must shape the strategy.
Aligning trade architecture with the cost of capital
The thread running through all of this is that in a 3.75-4.00% policy environment, forward pricing is no longer a background assumption. It actively sets your premiums. Higher rates lift calls and depress puts through cost of carry and put-call parity, dividends pull in the opposite direction, and rho decides how much of that reaches your position based on how long you hold it.
Ignoring carry is only defensible for ultra-short-term trades. Anything structural demands deliberate rate analysis before you enter.
So review your long-dated exposures now. Confirm that the return you expect genuinely outpaces the financing cost baked into the premium, because in this environment that cost is real and it compounds with time.
This article is for informational purposes only and should not be considered financial advice. Investors should conduct their own research and consult with financial professionals before making investment decisions.
Past performance does not guarantee future results. Financial projections are subject to market conditions and various risk factors. The pricing relationships described are simplified for readability and depend on model assumptions that may differ from live market conditions.