Most investors spend their days parsing earnings calls, rebuilding discounted cash flow models, and waiting for analysts to confirm what the numbers already imply. Yet one of the clearest leading indicators for where money flows next is not buried in a 10-K. It is published, for free, on government websites.
That is the premise behind a framework gaining traction among strategists who argue the current U.S. administration has become the primary market signal generator. Cem Karsan, founder of Kai Wealth, contends that aligning your portfolio with the assets government capital is being steered toward is the most effective medium-term positioning strategy available right now. As of September 2026, with Trump Accounts live since July, sovereign wealth fund legislation circulating, and post-midterm dynamics in play, this reads less like theory and more like something you can act on.
Here is the framework for identifying which sectors government capital allocation is priming, how the deployment vehicles actually work, what the evidence says, and where the signal breaks down.
Why the administration is the signal, not the noise
At first pass, this sounds like politics dressed up as an investment strategy. Follow what the president favours, buy accordingly, and hope the two things stay aligned. The instinct to dismiss it is understandable.
But strip away the branding and you find one of the oldest trades in modern markets: money follows power. When the largest buyer in an economy telegraphs where it intends to spend, the investors who track that telegraph are positioning alongside it rather than against it.
Karsan’s core thesis is that the U.S. government is now acting as the primary capital allocator, and that tracking administration-favoured assets means positioning with the biggest buyer in the market rather than waiting for private capital to confirm the move.
The reason this functions as a medium-term signal, a two-year-plus horizon rather than a quick trade, is the lag. Policy gets announced, then legislated, then appropriated, then actually deployed. That gap between the headline and the cheque clearing is precisely where the timing edge lives.
Tracking individuals close to the administration works as an early-warning layer on top of this. The research cites the Winklevoss brothers and their firm Gemini as one such proxy: watching where politically proximate operators move can flag where government-directed capital heads next.
The CHIPS Act as proof of concept
Semiconductors offer the cleanest recent example. Government activity in the sector, specifically the CHIPS Act awards, functioned as a confirmed leading indicator before broader market capital followed.
The award figures were substantial: roughly $8.5 billion in grants for Intel, $6.6 billion for TSMC Arizona, $6.1 billion for Micron, plus multi-billion-dollar allocations for Samsung.
Here is what that sequence tells you. The subsidy announcements landed months before the earnings-level impacts showed up in fundamentals. Investors who tracked the policy had a structural timing advantage over those waiting for the numbers to validate the story. The signal was in the appropriation, not the income statement.
When big ASX news breaks, our subscribers know first
What are the actual vehicles: sovereign wealth funds and Trump Accounts
A thesis is only as useful as its plumbing. Two deployment mechanisms sit behind this framework, and they are at very different stages of life.
The first is a proposed U.S. sovereign wealth fund. On 3 February 2025, President Trump signed Executive Order 14196, directing the Treasury and Commerce Departments to develop a plan for such a fund within 90 days, covering funding, investment strategy, structure, and governance.
The proposed financing mechanisms are unconventional: tariff revenues channelled through a proposed “External Revenue Service,” proceeds from a “gold card” scheme, and the potential conversion of the U.S. International Development Finance Corporation into a fund-like vehicle.
The second vehicle, Trump Accounts, has actually launched. Also known as 530A accounts, they are government-backed, IRA-style investment accounts created under the “One Big Beautiful Bill Act” and live nationally since 4 July 2026. Here is how they work:
- Seed capital: every American child born between 1 January 2025 and 31 December 2028 receives a one-time $1,000 payment from the U.S. Treasury.
- Contributions: parents can add up to $2,500 annually in pretax income, with total private contributions capped at $5,000 per child; government and charity contributions do not count toward the cap.
- Investment restriction: funds must be held in low-cost mutual funds or ETFs tracking broad U.S. equity indices, charging no more than 0.10% in annual fees.
- Access: account holders gain access at age 18, with the structure designed for long-term growth.
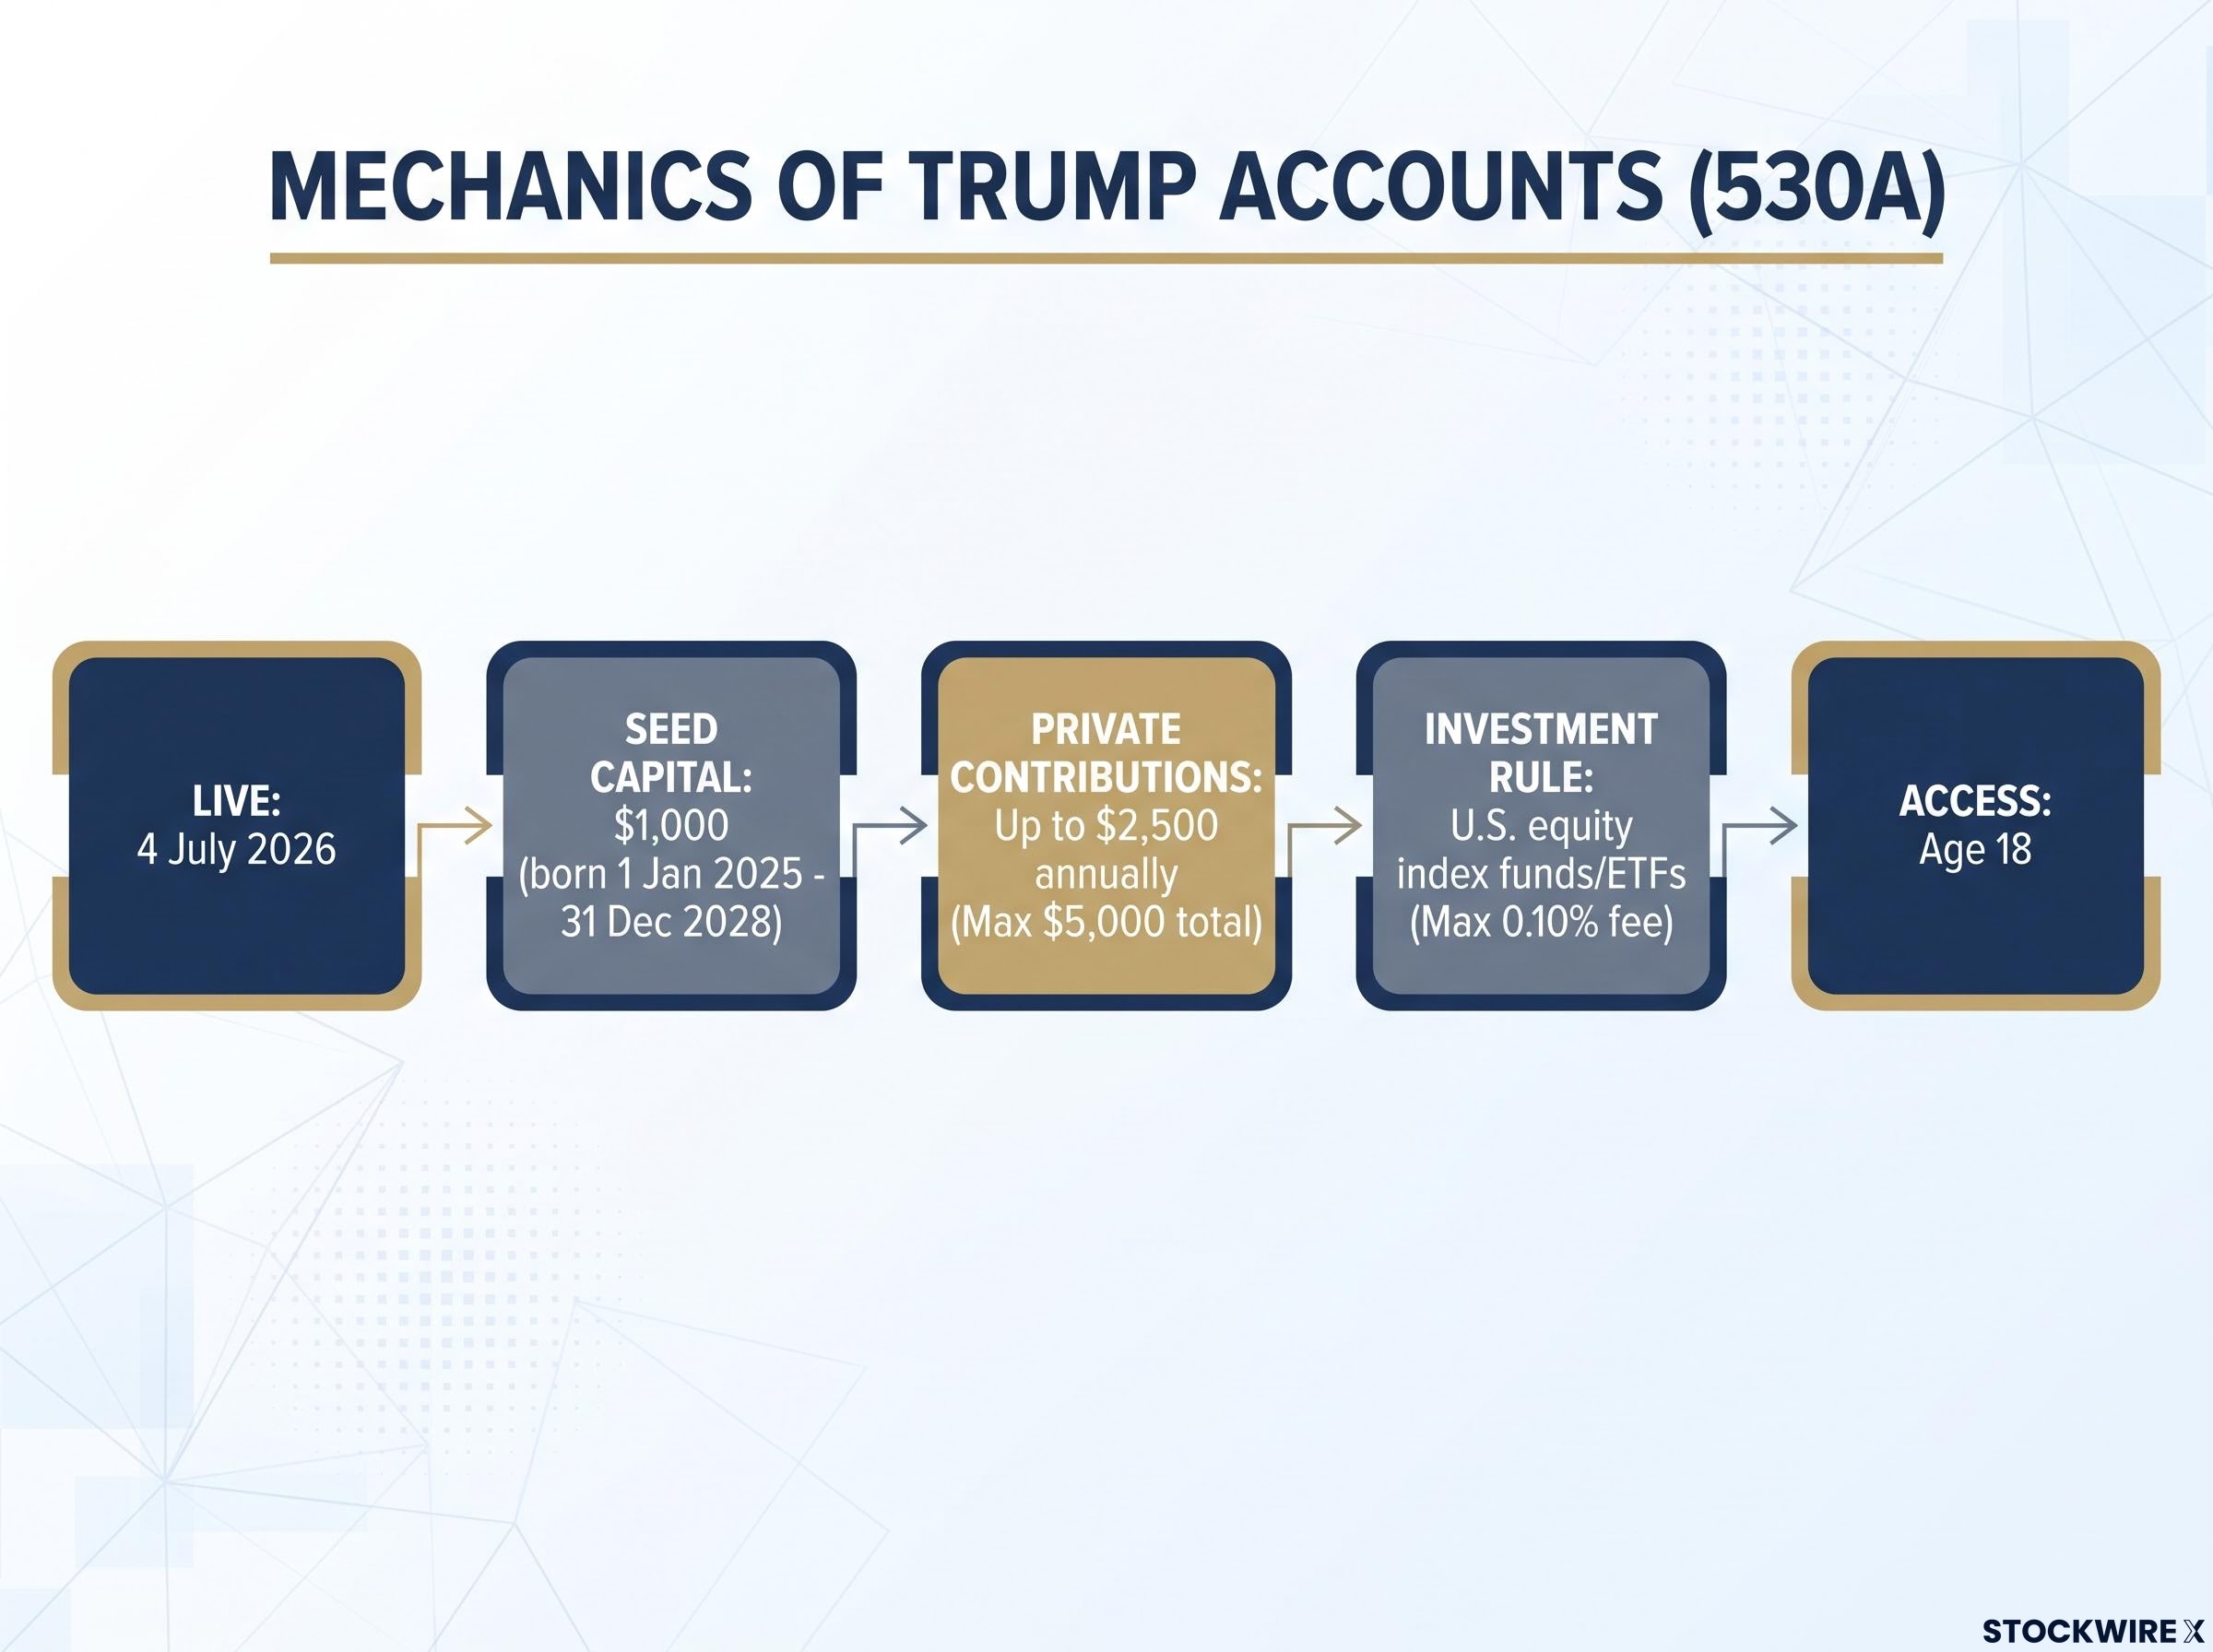
That investment restriction is the point worth sitting with. By mandating low-cost, broad U.S. equity index exposure, the programme structurally channels billions in government-seeded capital into the U.S. equity market over the next decade, largely regardless of which party controls Congress.
| Vehicle | Current Status | Funding Mechanism | Investment Focus |
|---|---|---|---|
| Sovereign Wealth Fund | Proposed via executive order; not yet enacted as law | Tariff revenue, “gold card” proceeds, possible DFC conversion | Strategic corporate acquisitions, industrial policy sectors |
| Trump Accounts (530A) | Live and operational since 4 July 2026 | $1,000 Treasury seed plus private contributions | Broad U.S. equity index funds and ETFs |
The sovereign wealth fund: executive order versus enacted law
It matters that you do not treat the sovereign wealth fund as a live market force yet. The executive order directs a plan; it does not create a funded institution.
On the legislative side, H.R. 3116 (the American Sovereign Wealth Fund Exploration Act) was introduced on 30 April 2025 to establish a study commission, and S. 4825 (the American A.I. Sovereign Wealth Fund Act) was introduced by Senator Bernie Sanders on 18 June 2026. Neither has been enacted.
Carnegie Endowment and Council on Foreign Relations analyses both flag the unconventional financing mechanisms as legally fragile. Until statutory backing exists, the fund represents potential directed acquisition activity, not committed capital.
How to read the signal in practice: sectors and precedents
Here is where the framework becomes a method rather than an idea. The screening logic is straightforward: look for businesses that sit on the U.S. government budget, are strategically important to domestic rebuilding, or are connected to individuals with proximity to the administration.
Apply that lens and two sector calls surface from the research:
- Clean energy (particularly solar): framed as legitimate U.S. energy infrastructure that markets have largely abandoned, yet positioned to benefit from even modest policy shifts.
- Healthcare: a lagging form of infrastructure with politically sticky entitlement programmes, where private providers and insurers with low Medicaid exposure are identified as protected from cuts while benefiting from deregulation.
- Semiconductors: the precedent sector, where CHIPS Act subsidies already demonstrated the policy-before-earnings timing pattern.
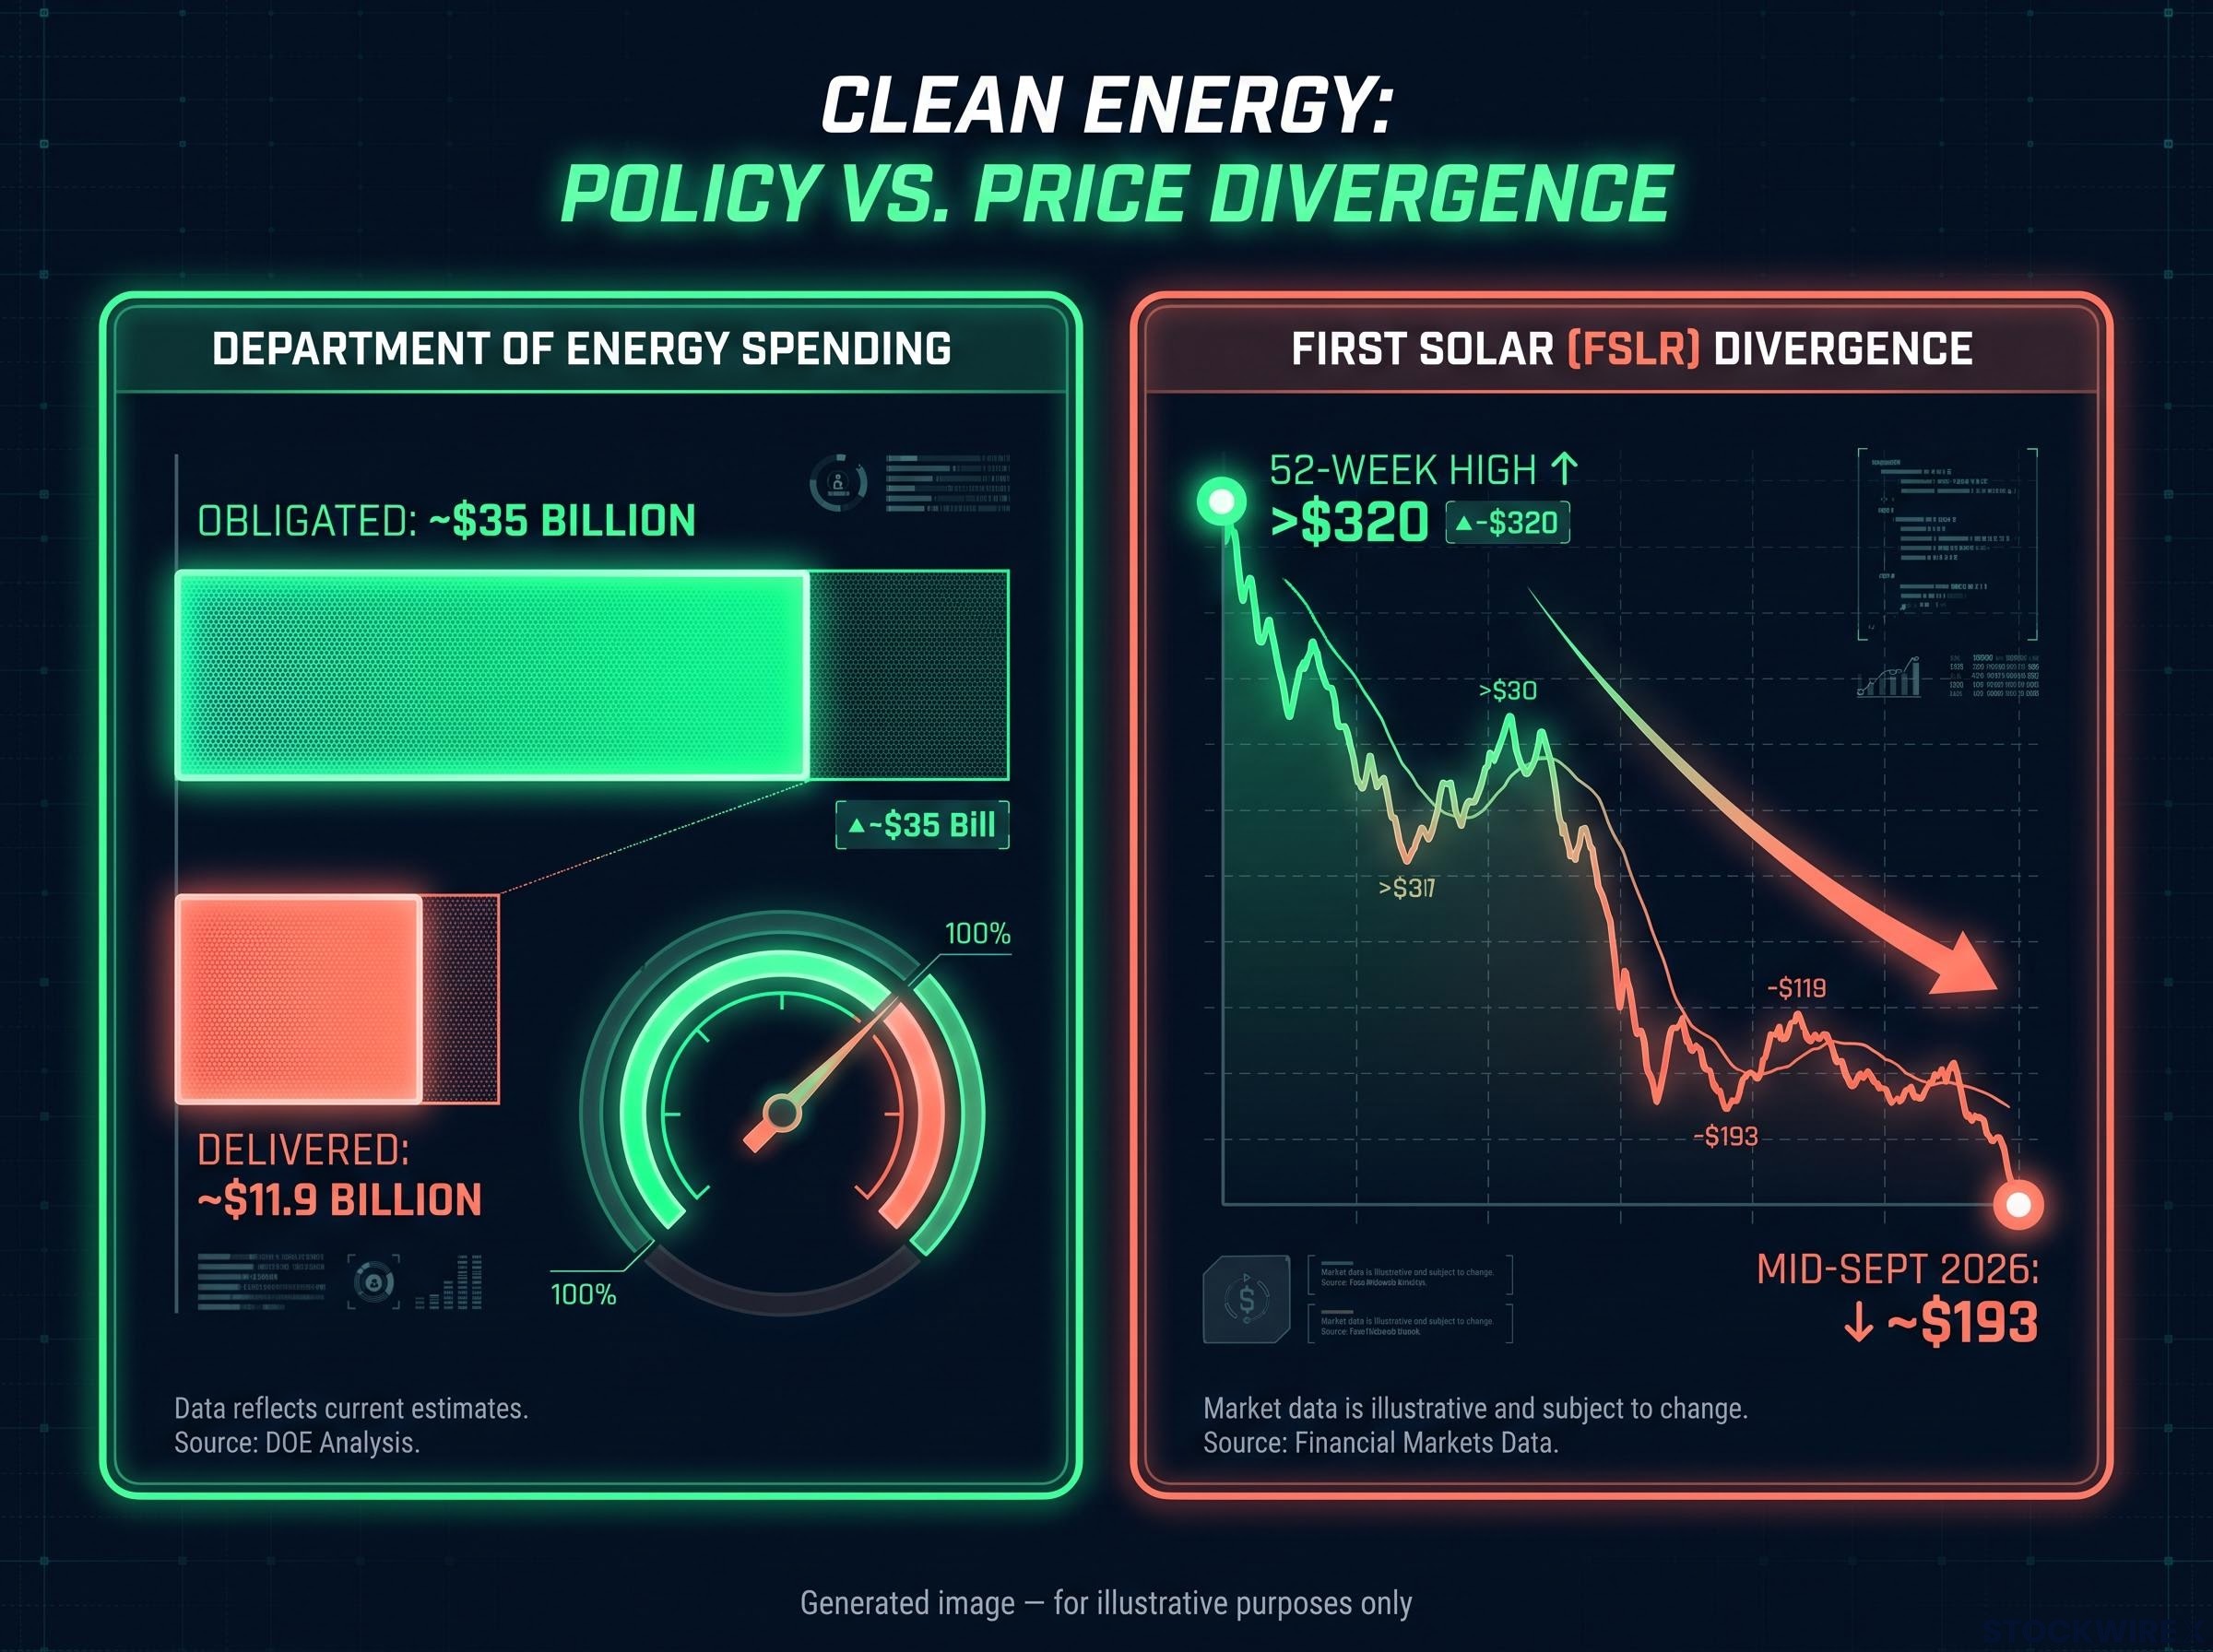
The clean energy case has hard numbers behind it. A Clean Air Task Force review estimated the Department of Energy obligated about $35 billion in federal spending, with roughly $11.9 billion actually delivered, most of it directed to clean-energy projects. Those multi-year appropriations create delayed, politically durable inflows.
First Solar (FSLR) illustrates what the framework is built to surface. As of mid-September 2026, the stock traded near $193, down roughly 23% year-to-date, against a 52-week high above $320. That price-to-policy divergence, an asset the market has de-rated while government capital allocation has not abandoned the sector, is exactly the kind of gap the signal-reading approach is designed to flag. For diversified exposure, the iShares Global Clean Energy ETF (ICLN) traded near $17.50, up around 8% year-to-date.
What the research says about contract-based signals
None of this holds up without evidence, and the empirical literature is more coherent than you might expect. Three studies form a body of work rather than isolated data points.
| Study / Source | Finding | Signal Type |
|---|---|---|
| Economics Letters (2025) | Portfolios built around large contract recipients generate positive cumulative returns that outperform the market | Contract |
| HEC Montréal thesis (2024) | Contract recipients achieve cumulative excess returns of 1.3%-1.7% over the two weeks after awards | Contract |
| TenderAlpha white paper (2026) | Government-contract strategies deliver annualised Sharpe ratios between 0.77 and 1.27 | Contract |
Sovereign flows corroborate the picture from a different angle. Global sovereign wealth and public pension funds directed over $131 billion into the United States in 2025, concentrated in AI, semiconductors, critical minerals, and energy infrastructure.
One caveat keeps the framework honest. An event study in the Journal of Economic Analysis on pharmaceutical firms winning federal contracts found positive average abnormal returns that were not statistically significant in some event windows. The signal is real, but it is not uniform across every sector.
Where this framework breaks down
If it all sounds too easy, that is the correct instinct. Knowing the specific conditions under which the signal fails is what separates disciplined application from wishful thinking.
Start with policy reversal risk. The unconventional funding mechanisms behind any new sovereign vehicle, and the absence of bipartisan statutory backing, make these structures vulnerable to rapid reversal, legal challenge, and post-election reprioritisation. Carnegie Endowment and Council on Foreign Relations analyses both underline this fragility.
Then there is crowding. With sovereign investors already concentrated in AI, semiconductors, and energy infrastructure, arriving late to government-favoured sectors carries genuine bubble dynamics.
This is the risk with the most immediate implication for you. If sovereign funds have already steered over $131 billion into U.S. strategic sectors in a single year, a retail investor chasing the same thesis in late 2026 may be buying after the price has already absorbed the policy signal.
Governance risk is subtler but real. Tying investments to presidential priorities blurs the line between industrial policy and investment management, raising the possibility that capital reflects political signalling rather than risk-adjusted logic.
Regulatory design adds another layer of reversibility.
A December 2025 Bloomberg analysis noted that lowering capital requirements for certain big-bank subsidiaries freed up as much as $219 billion in incentive for banks to hold Treasuries and government-backed assets, a reminder that regulatory design, not just direct spending, reshapes capital flows, and can be undone just as quickly.
The failure modes worth keeping in front of you:
- Policy reversal: legally fragile funding, no bipartisan backing.
- Crowding: valuations may already embed future policy support.
- Governance and cronyism: political signalling over return logic.
- Signal noise: contract signals weak or insignificant in some sectors, notably pharmaceuticals.
How post-midterm dynamics could reprice the sectors investors have ignored
Here is the forward-looking hypothesis worth monitoring. Post-midterm political compromise tends to broaden the working definition of “infrastructure” as each party hunts for wins it can claim.
That broadening is the mechanism through which clean energy and healthcare get folded back into the government capital allocation story, even though the market currently under-owns both.
The staggered nature of federal spending is what makes this more than a guess. The Department of Energy obligation-to-outlay gap, roughly $35 billion obligated against $11.9 billion delivered, is not an accounting footnote.
It tells you the government has already committed money to clean energy infrastructure that has not yet reached the market. The sector’s medium-term capital tailwind therefore exists independently of what any future Congress decides.
International precedents show committed government capital sustaining sector rerating across political cycles:
- India: solar subsidies reached INR 3,670 crore in FY 2024.
- Denmark: offshore wind tenders of 3 GW with subsidies up to 55.2 billion Danish crowns.
- Norway: wind subsidies capped at 35 billion Norwegian crowns.
Bring it back to a live example. First Solar at $193, down 23% year-to-date against prior highs above $320, is what “underpriced relative to committed government capital” looks like in practice. The sectors the market has de-rated but the government pipeline has not abandoned are precisely the ones this framework exists to surface.
Applying the framework without getting the timing wrong
None of this is a standalone system. It is a leading-indicator layer that sits alongside fundamental analysis, and applying it well comes down to a repeatable discipline:
- Identify the asset: the business on a budget line, strategically important, or politically proximate.
- Verify the committed capital: confirm real money behind the story via procurement data, a budget line, or an executive order with legislative backing.
- Assess the cycle timing: decide whether the signal is early-cycle (policy announced, capital not yet deployed) or late-cycle (capital deployed, price already moved).
The data sources that make this actionable are public and free. USASpending.gov carries procurement and contract data, the Federal Register captures regulatory capital changes, and legislative trackers show where bills actually stand.
Government-contract strategies delivered annualised Sharpe ratios between 0.77 and 1.27, per the 2026 TenderAlpha white paper, evidence the signal has been statistically productive when applied systematically rather than anecdotally.
Here is the limitation to internalise. The CHIPS Act showed the edge lives in lead time, and that lead time compresses as more investors track the same data. Your advantage is greatest when you are early to a specific deployment and weakest once the signal is being discussed across financial media.
This article is for informational purposes only and should not be considered financial advice. Investors should conduct their own research and consult with financial professionals before making investment decisions. Past performance does not guarantee future results, and these forward-looking scenarios are speculative and subject to change based on policy, market, and legislative developments.