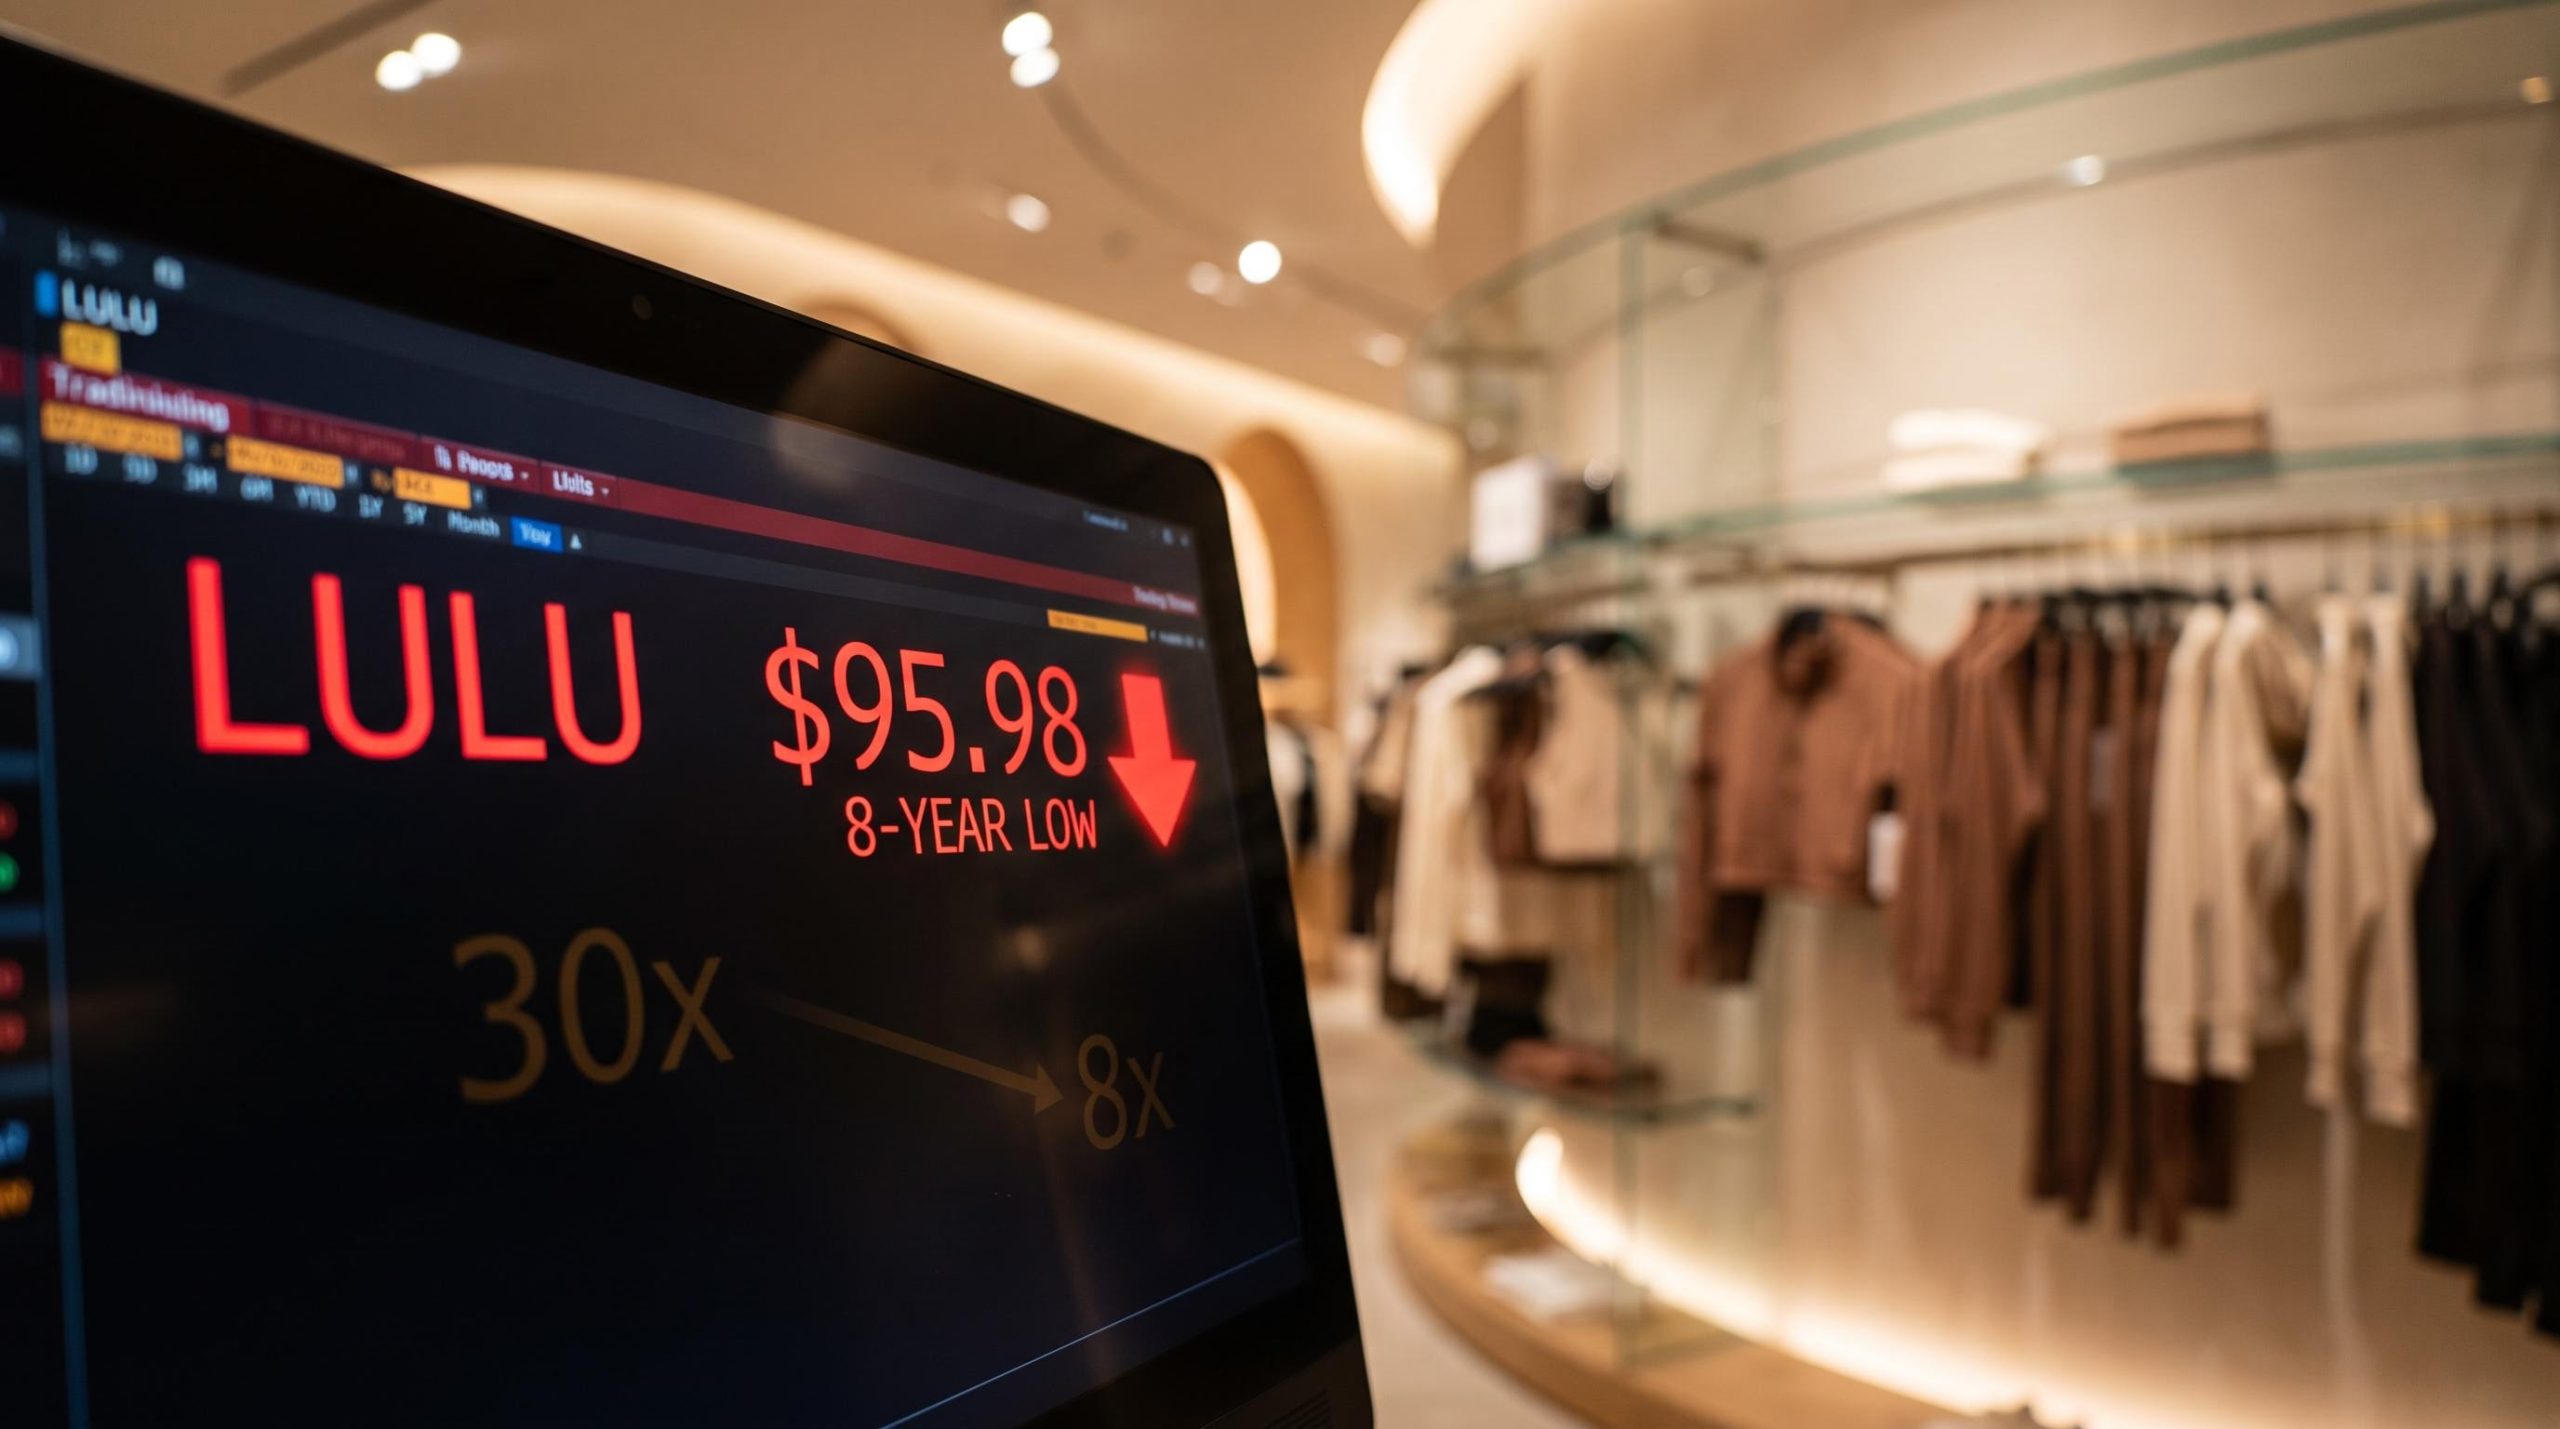
Lululemon trades at roughly 8x trailing earnings today, sitting near $95.98 at an eight-year low. At the peak of its growth story, this was the premium growth brand the market happily paid 30x earnings or more to own.
That gap is the whole story. A company with genuine pricing power, a loyal community, and disciplined full-price selling has just reported an 8% revenue decline in the Americas, guided the next quarter well below what Wall Street expected, and handed the top job to a Nike veteran who has been in the chair for nine days.
You are not here for a company overview. You are here to work out whether this dislocation is a buying signal or a warning sign. What follows gives you the financial data, the valuation framework, and the risk inventory you need to form your own view on whether the stock is priced for recovery or priced to disappoint again.
What the revenue numbers actually show
Start with the top line, because everything else depends on it. For the second quarter of fiscal 2026, reported on 3 September 2026, Lululemon posted total net revenue of $2.42 billion, missing the consensus figure of $2.46 billion. That works out to a 4% year-over-year decline, or 5% in constant currency.
A single soft quarter is one thing. A pattern is another, and the pattern is what should concern you here.
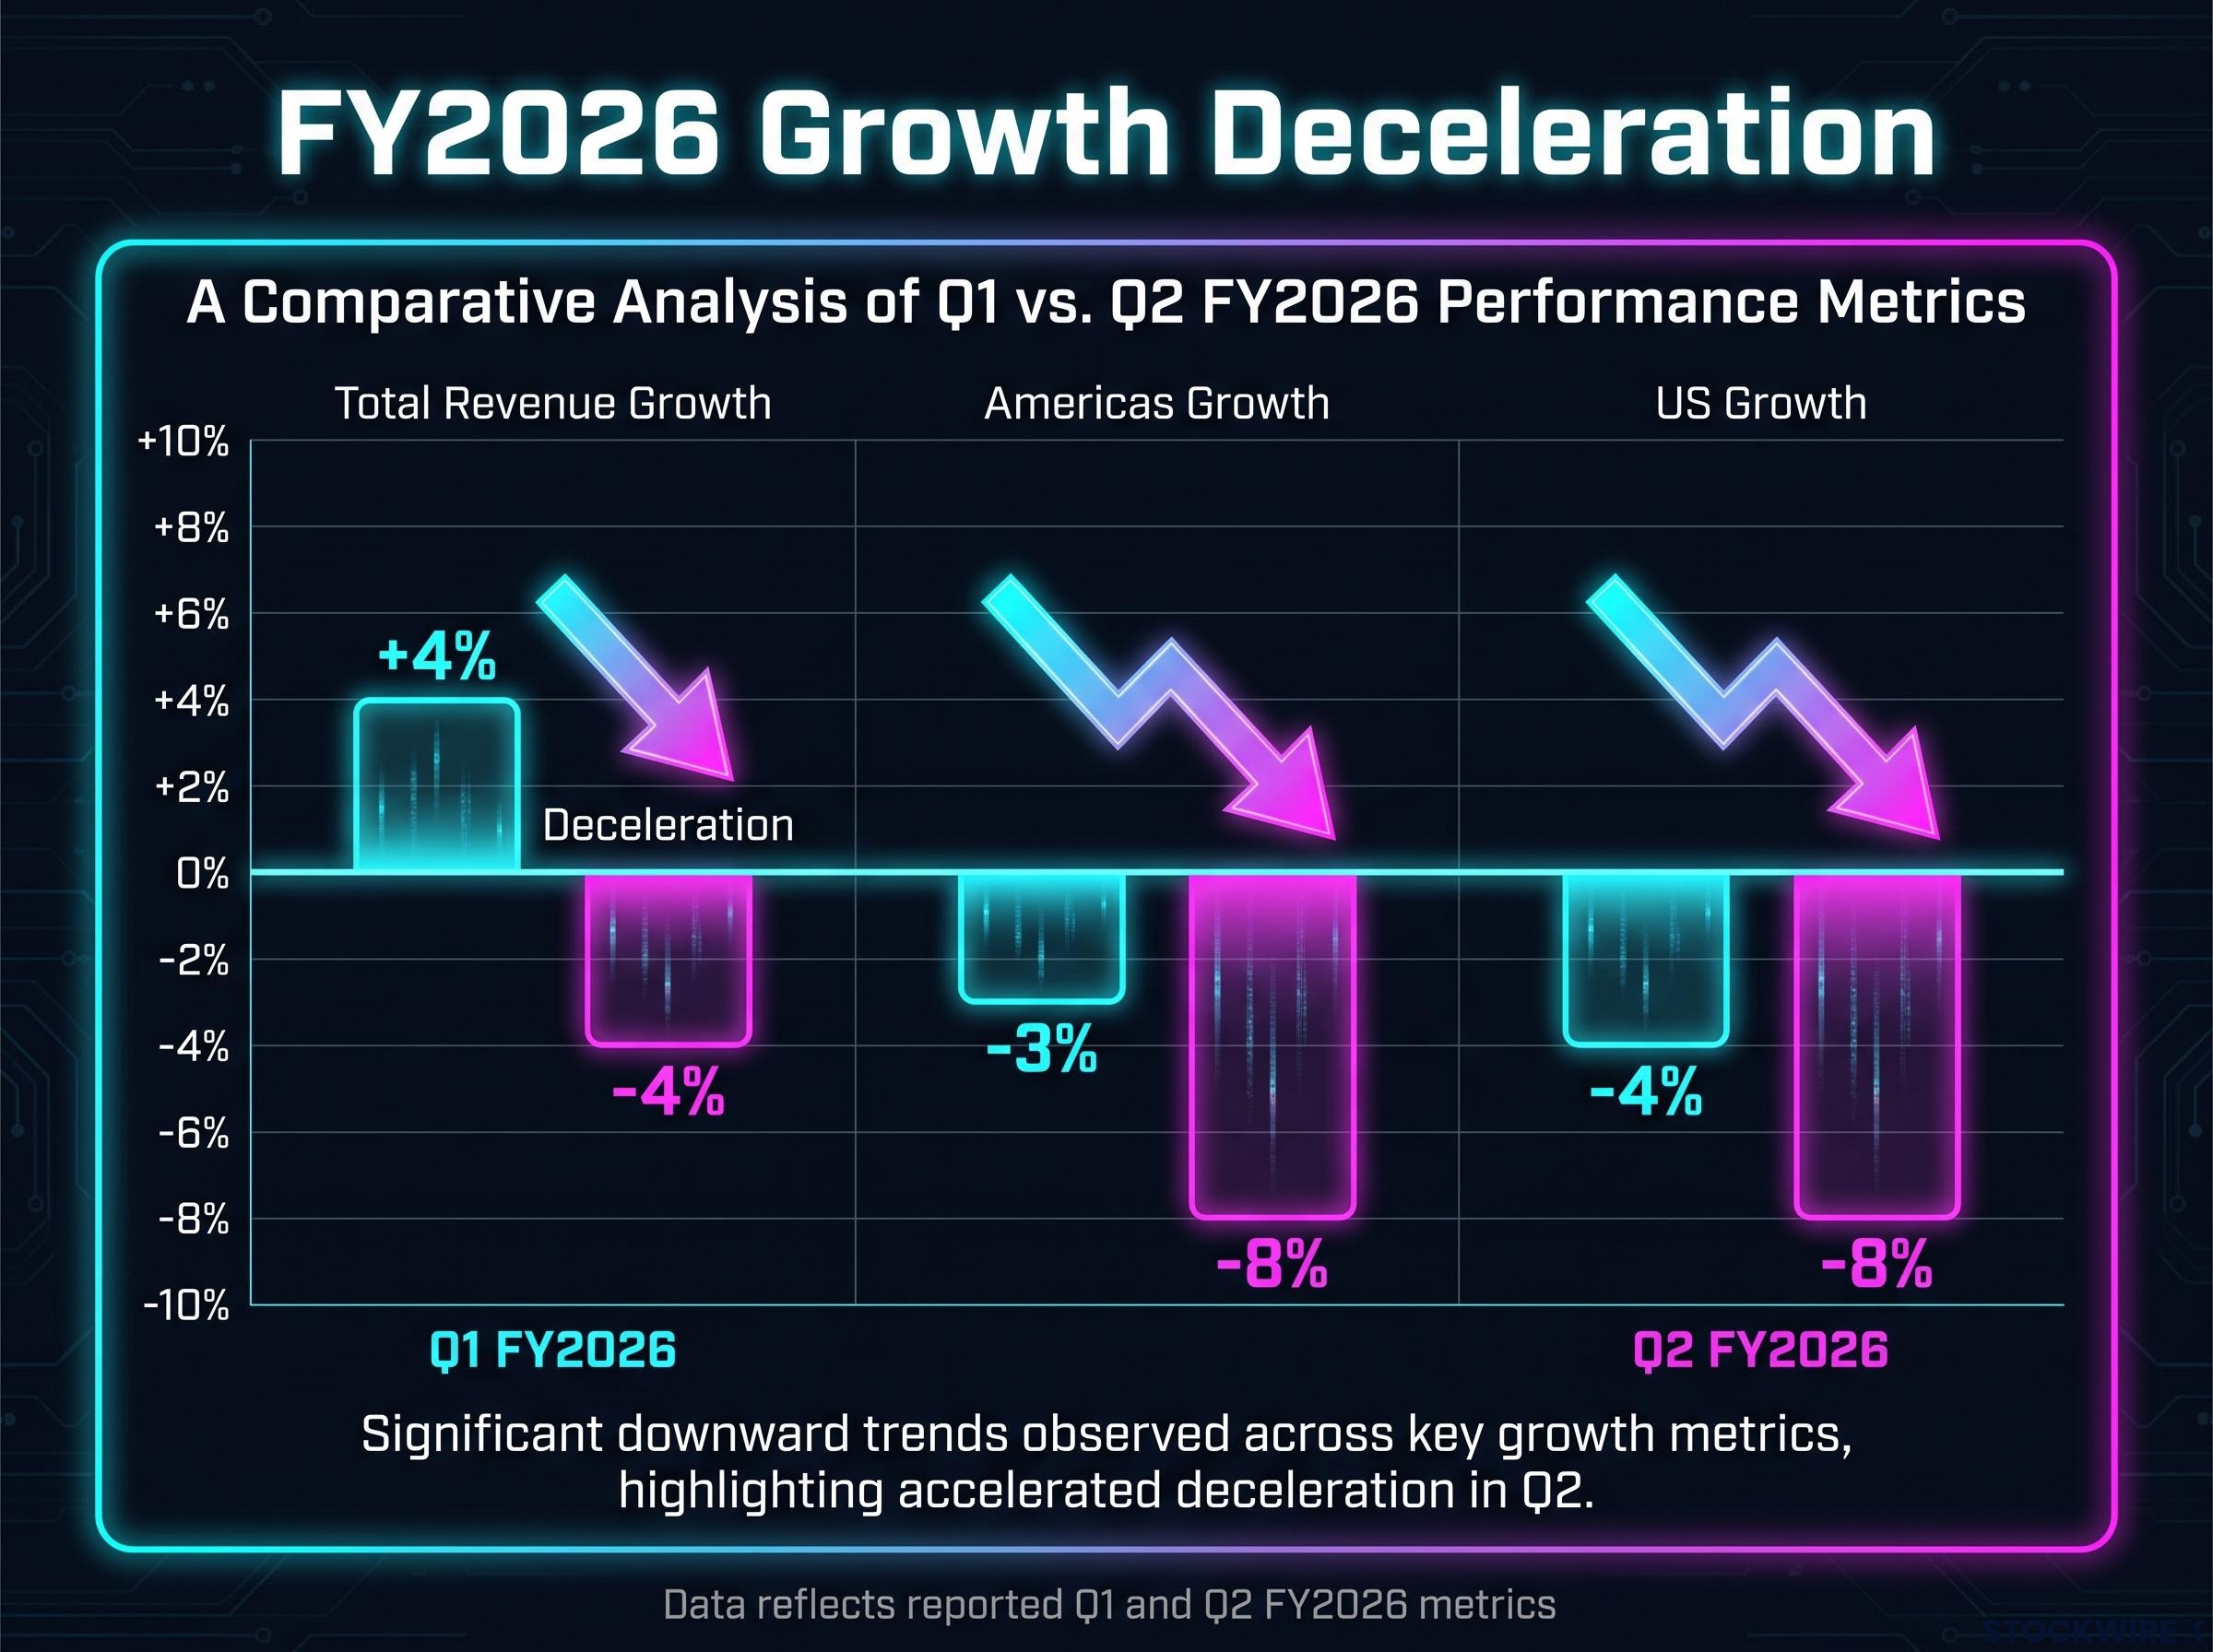
Rewind one quarter. In Q1 FY2026, total revenue actually rose 4%, yet the cracks were already visible: the Americas segment fell 3% and the US fell 4%. By Q2, those declines had roughly doubled.
| Metric | Q1 FY2026 | Q2 FY2026 |
|---|---|---|
| Total revenue growth | +4% | -4% |
| Americas growth | -3% | -8% |
| US growth (constant currency) | -4% | -8% |
| China mainland comps | Slowing | -8% |
The detail that matters most: the US and China both fell 8% in the same quarter. China mainland comparable sales dropped 8%, and management named China as the single largest contributor to the shortfall. When your two most important markets deteriorate in lockstep, this stops being a regional soft patch you can look through and becomes a global brand problem.
Management was specific about the cause. The company attributed the weakness to reduced foot traffic across North America and China, not to pricing weakness or shoppers failing to convert once in store. That distinction is a genuine diagnostic: it means fewer people are walking in, rather than the brand losing its ability to sell at full price to those who do. Retail analytics firm PassBy reported same-store traffic down approximately 3.1% across 395 locations, while competitor traffic posted gains over the same window.
US consumer spending data through mid-2026 complicates the traffic-decline narrative: aggregate retail sales rose for five consecutive months and Bank of America card transactions posted their strongest year-over-year growth in four years, which makes Lululemon’s specific foot-traffic decline a brand-level problem rather than a broad consumer pullback.
The forward number is where the pressure becomes concrete.
Lululemon guided Q3 FY2026 revenue to approximately $2.3 billion, against a prior consensus that had sat near $2.6 billion.
That is a roughly $300 million gap between what management now expects and what the market had been modelling. Before any valuation debate is worth having, you need to accept that the company itself is telling you the slide has not yet found its floor.
When big ASX news breaks, our subscribers know first
Margin compression and what it means for free cash flow
Falling revenue is the symptom. The financial consequence shows up in the margins, and this is where the damage starts to look structural rather than cosmetic.
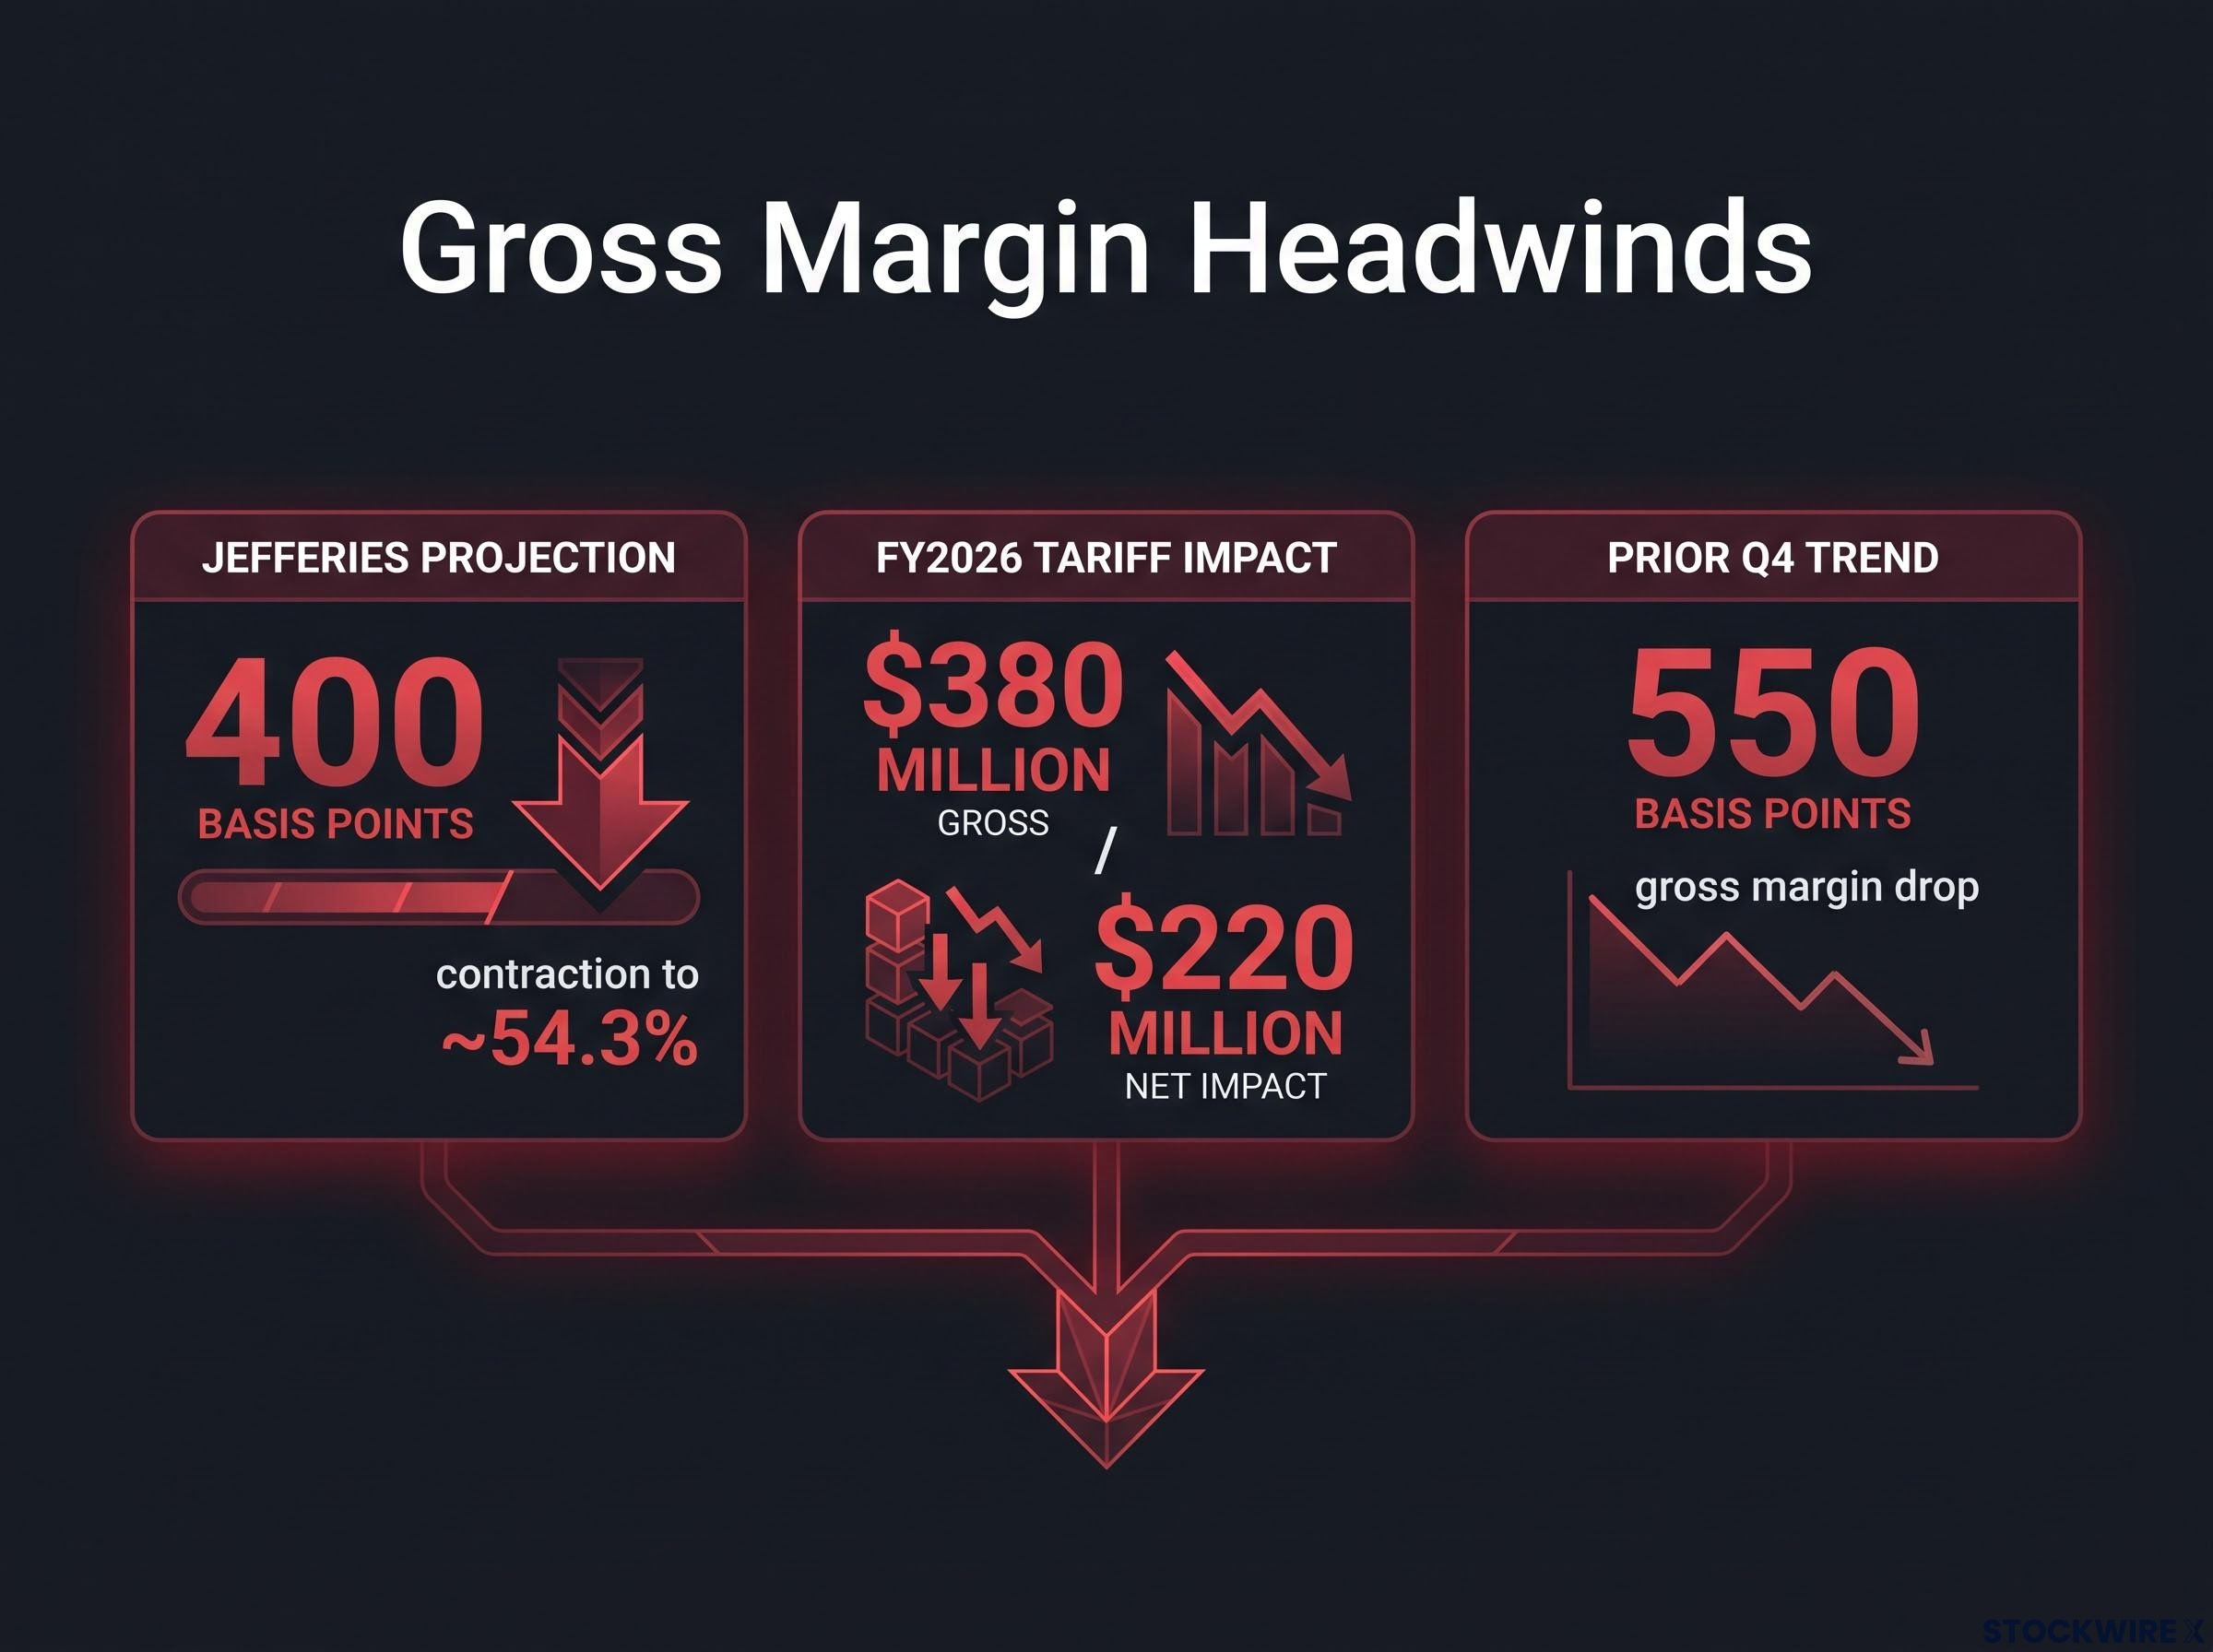
Jefferies projects gross margin contraction of roughly 400 basis points, taking the figure down to around 54.3%. Three forces are doing the work here:
- Elevated markdowns: the company is shipping fewer units while working to keep full-price sell-through intact, which erodes operating leverage.
- Input-cost inflation: higher costs across the supply chain that cannot be fully passed on when traffic is weak.
- Tariffs: the FY2026 gross tariff impact is estimated at $380 million, netting to roughly $220 million after mitigation.
This is not the first quarter of margin pain. In Q4 of the prior fiscal year, gross margin dropped 550 basis points. The trend, in other words, predates the current headlines.
Free cash flow: recovery or relief rally?
Here is where the numbers can mislead you if you take them at face value. Analyst consensus, aggregated from 22 analysts at major institutions including Goldman Sachs and JP Morgan, projects roughly $887 million in free cash flow for the current fiscal year. On its own, that sounds like the balance sheet of a healthy business.
The context changes the read entirely. Lululemon posted two consecutive years of free cash flow decline before a recent rebound in the trailing-twelve-month figure, and analysts warn that forward-looking estimates point down rather than up.
So the $887 million is not a floor you can build a thesis on; it is a number that analysts themselves expect to shrink. That matters more than the trailing rebound, because free cash flow is the denominator in every discounted cash flow model you might use to decide whether this stock is cheap. If the cash generation that once justified a premium multiple is now eroding, then “trading at 8x earnings” means something very different from a straightforward bargain.
Understanding Lululemon’s brand moat and why it is under pressure
Before you can judge whether the discount closes, you need to understand the mechanism that would close it: the brand moat.
An economic moat is the competitive advantage that lets a company sustain pricing power and margins above the industry average over time. For a consumer brand, it is the reason a shopper pays $120 for leggings when a functional alternative costs a fraction of that. If the moat holds, the valuation discount is temporary. If it erodes, the discount is a warning.
Lululemon’s moat has several components that remain intact:
- Community retail model: yoga studios and events inside stores that deepen customer loyalty beyond the transaction.
- Premium pricing discipline: full-price sell-through is holding, meaning the brand is not resorting to broad discounting to move product.
- Women’s apparel leadership: women’s products account for approximately 63% of revenue, anchoring a category where the brand still leads.
- Cultural positioning: an established place at the centre of the athleisure category.
But other parts of the moat are visibly under pressure:
The brand dilution mechanics that accelerated through FY2025, including the Disney partnership misstep and failed category expansions, contributed to the same 550 basis-point gross margin contraction in Q4 that the current article traces forward into Q2 FY2026 territory.
- Younger-consumer defection: challenger brands Alo Yoga and Vuori are capturing traffic among younger shoppers, with PassBy data showing Lululemon down 3.1% while named competitors gained.
- Innovation lag: the “Breezethrough” product line underwhelmed, and former management had warned the brand risked becoming too predictable.
- Reputational overhang: founder Chip Wilson’s public criticism and a Texas Attorney General probe into alleged “forever chemicals” have fed negative sentiment.
- Lingering perception damage: the earlier transparent-leggings quality controversy still colours the brand’s image.
Placer.ai comparative athleisure traffic data from the same period shows Lululemon’s younger-skewing competitor locations posting visitation gains, adding quantitative weight to the qualitative concern that challenger brands like Alo Yoga and Vuori are capturing the demographic cohort Lululemon needs to retain.
For context, men’s apparel contributes roughly 24% of revenue, giving the company a second growth lever that is less exposed to the women’s category competition.
The sharpest signal of how contested this moat is comes from the ratings.
Morningstar maintains a 5-star rating on Lululemon with a “narrow economic moat” and a fair-value estimate of $295, against a share price near $96.
That roughly $200 gap between one analyst’s fair value and the market price tells you the moat is contested, not destroyed. The entire investment thesis rests on which of those two views turns out to be correct, which is why skipping the moat analysis and going straight to the P/E multiple would leave you working from the wrong end of the problem.
What the numbers say LULU is worth right now
Now to the valuation itself, from the simplest multiple up to the cash-flow model. The “cheap” label depends entirely on which growth assumption you are willing to trust.
Start with the multiples. At $95.98, Lululemon carries a market capitalisation of roughly $11.1 billion, a trailing GAAP price-to-earnings ratio (the share price divided by earnings per share) of about 7.87, a forward P/E in the 10.23 to 11.34 range, and a normalised P/E of 8.06. Set those against the 30x-plus multiples the stock commanded at the peak of its growth story, and the compression is stark.
The discounted cash flow model, which estimates a company’s value based on the cash it is expected to generate, sharpens the picture. Using the $887 million baseline free cash flow figure, the fair value swings dramatically with the perpetual growth rate you assume.
| Perpetual growth rate | FCF base | Implied fair value | Vs. ~$96 price |
|---|---|---|---|
| 2.5% (long-run inflation) | $887M | ~$105 | Modest upside |
| 0% | $887M | ~$86 | Modest downside |
Read that table carefully, because it contains the core of the decision. At roughly $96, the market is pricing Lululemon almost exactly as though it will deliver zero real long-term growth. If you believe the brand recovers even to inflation-level growth, there is upside. If you think the erosion is structural, the current price is already generous.
The challenge with turnaround stock valuation is that standard inputs, particularly earnings and margins at a trough, produce systematically distorted outputs; the normalisation step, anchoring to a multi-year average rather than the depressed current figure, is what separates a genuine margin-of-safety price from a number that looks cheap only because the denominator is broken.
The analyst community cannot agree, and it would be dishonest to smooth that over.
MarketBeat’s 12-month consensus target sits at $111.54, but the range runs from a low of $44 to a high of $225, with a “Reduce” rating across 29 analysts.
MarketWatch puts the average at $98.35 with a high of $128.20 and the same $44 floor, while TipRanks had a consensus near $122 to $123 before recent cuts. A spread from $44 to $225 is not a consensus. It is a fundamental disagreement about whether the business is recovering or unravelling, and it tells you the market has no settled view for you to lean on.
Heidi O’Neill, the turnaround clock, and what investors should watch
Into that disagreement steps a new chief executive. Lululemon announced Heidi O’Neill’s appointment on 22 April 2026, and she officially took the role on 8 September 2026, nine days before this article’s publication.
O’Neill arrives with more than 25 years at Nike, most recently as President, Consumer, Product & Brand, where she oversaw global brand strategy and product innovation. Her appointment came under pressure from founder Chip Wilson and a large activist investor, following a wave of executive departures that added organisational risk to the transition. The market’s verdict on the near-term picture was blunt: after the Q2 miss and guidance cut, shares fell approximately 18% to an eight-year low.
Nine days in is far too early to assign credit or blame. It is, however, exactly the right time to calibrate what success should look like and how long you are willing to wait for it.
History offers a template. Turnarounds in premium athletic apparel tend to follow a predictable arc:
- Year one: diagnostic clarity, where the new leader identifies what is broken.
- Year two: operational movement, where fixes begin to show in the business.
- Year three: visible financial improvement in the reported numbers.
Analyst consensus points to a 2-3 year minimum before visible financial improvement, based on comparable athletic-brand turnarounds.
Consumer brand turnarounds that involve simultaneous traffic recovery, product reinvention, and leadership transition, as Starbucks has been navigating across its international portfolio including China, tend to compress on a multi-year timeline even when early operational indicators move in the right direction.
The precedents reinforce the patience required. Analysts point to Nike’s return of veteran Elliott Hill, whose “Win Now” strategy is cited as delivering five consecutive quarters of double-digit growth in running, even as broader Nike revenue reportedly still fell in a recent quarter. Under Armour’s Kevin Plank, who returned in 2024, cut around 25% of product lines and guided to a 15-17% North American revenue decline, yet revenue kept falling. Neither turnaround delivered a quick, broad recovery.
The three risks O’Neill cannot control from day one
Some of the pressure on Lululemon sits entirely outside the new CEO’s influence. Separating what she can shape from what she inherits is essential to setting realistic expectations.
The first is tariffs. The FY2026 net tariff impact of roughly $220 million is a direct hit to margins that no amount of strategic vision removes; it is a cost of doing business, not a lever to pull.
The second is China. The company’s heavy reliance on the Chinese market, where mainland comps fell 8%, ties its fortunes to geopolitical and domestic-consumer conditions that no CEO controls from Vancouver.
The third is the inherited product pipeline. The “Breezethrough” failure was the most recent evidence of an innovation engine that needs rebuilding, and O’Neill inherits that timeline rather than setting it from scratch. Anyone pricing in a 12-month recovery is working from an assumption these precedents do not support.
Buying a turnaround story or paying for someone else’s mistakes?
Pull the threads together. You have the revenue trend, the margin and cash-flow mechanics, the contested moat, the valuation math, and the turnaround clock. The decision now comes down to a single conditional.
At roughly $96, with a 0% perpetual growth rate effectively priced in, Lululemon offers asymmetric upside if O’Neill stabilises traffic and margins. The $86 to $105 DCF corridor frames the risk and reward cleanly. But it is not a safe value play if the brand erosion proves structural rather than cyclical, because in that scenario even today’s discounted price is not low enough.
That is why independent assessments, including those from Jefferies and KeyBanc, favour waiting for clearer evidence before committing capital. With MarketBeat’s 29 analysts sitting at “Reduce” and the guidance already cut, the earliest hard signal will come from Q3 results and the $2.3 billion revenue figure the company has set as the bar.
The honest position is that the difference between a value trap and a turnaround opportunity here is almost entirely a function of whether traffic trends change within the next two quarters, and you should be candid with yourself about how much certainty you actually have on that question. Rather than a verdict, here is the framework to watch:
- US and China same-store traffic in Q3 and Q4, the leading indicator of any real recovery.
- Gross margin trajectory measured against Jefferies’ 400 basis points contraction projection.
- O’Neill’s first strategic communication, when it arrives.
This article is for informational purposes only and should not be considered financial advice. Investors should conduct their own research and consult with financial professionals before making investment decisions.
Past performance does not guarantee future results. Financial projections are subject to market conditions and various risk factors. Forward-looking statements are speculative and subject to change based on market developments and company performance.