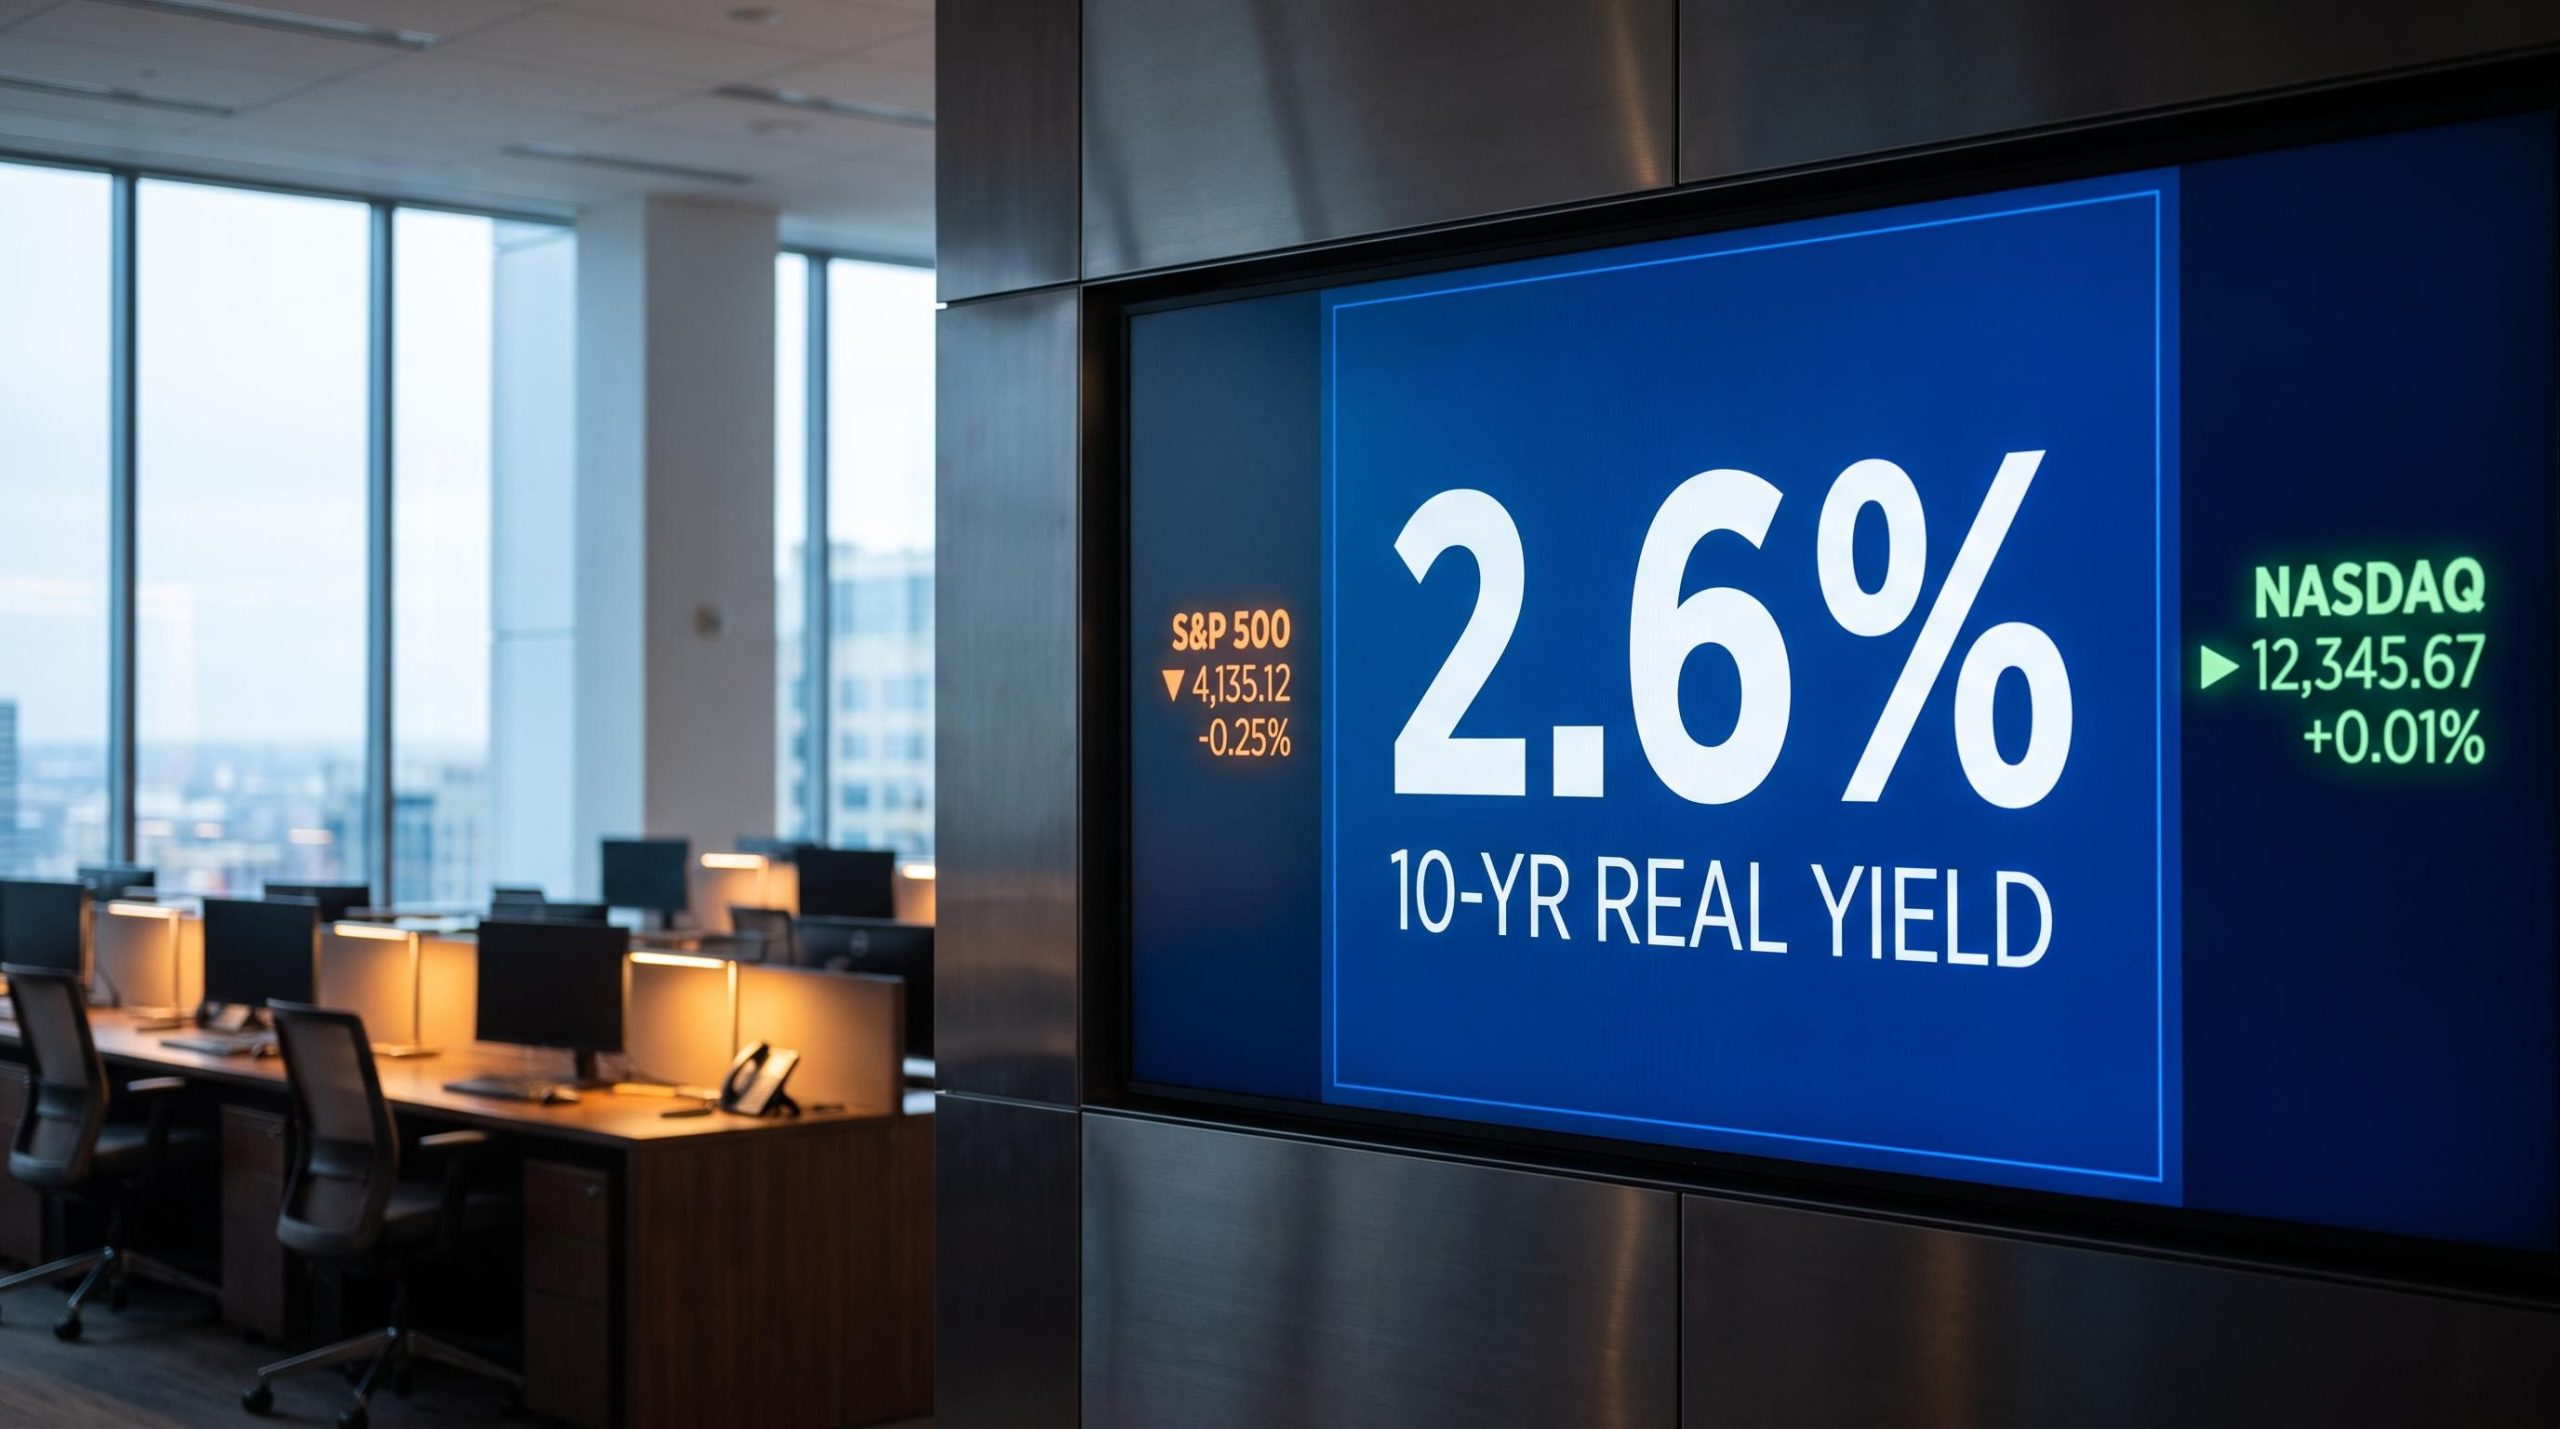
The rate-hike playbook is unambiguous: when real yields climb, growth stock valuations compress. And yet here we are in September 2026, with the 10-year real yield running near 2.6%, and AI-linked megacaps have not cratered.
That is the contradiction worth sitting with. Real yields at this level have not been sustained since before the era of post-crisis financial repression, when central banks held rates artificially low for the better part of a decade.
Any investor running a standard duration-risk model would have trimmed growth exposure months ago. A meaningful cohort did not, and has been rewarded for the refusal. That is the anomaly this analysis works through.
By the time you finish, you will be able to assess something specific: whether the intermarket signals visible today justify holding a growth-tilted portfolio, or whether the current resilience is already priced in and the risk-reward is quietly shifting beneath the surface. This is a decision you can make with sharper information, and the framework for making it is what follows below.
The yield signal that most investors are misreading
Start with the number everyone already knows. The 10-year nominal Treasury yield sits at roughly 5%, with mid-September readings clustered near 4.99%-5.04%. CNBC reported an intraday touch of 5.041%, the highest level since 2007.
That headline figure is where most analysis stops. It should not.
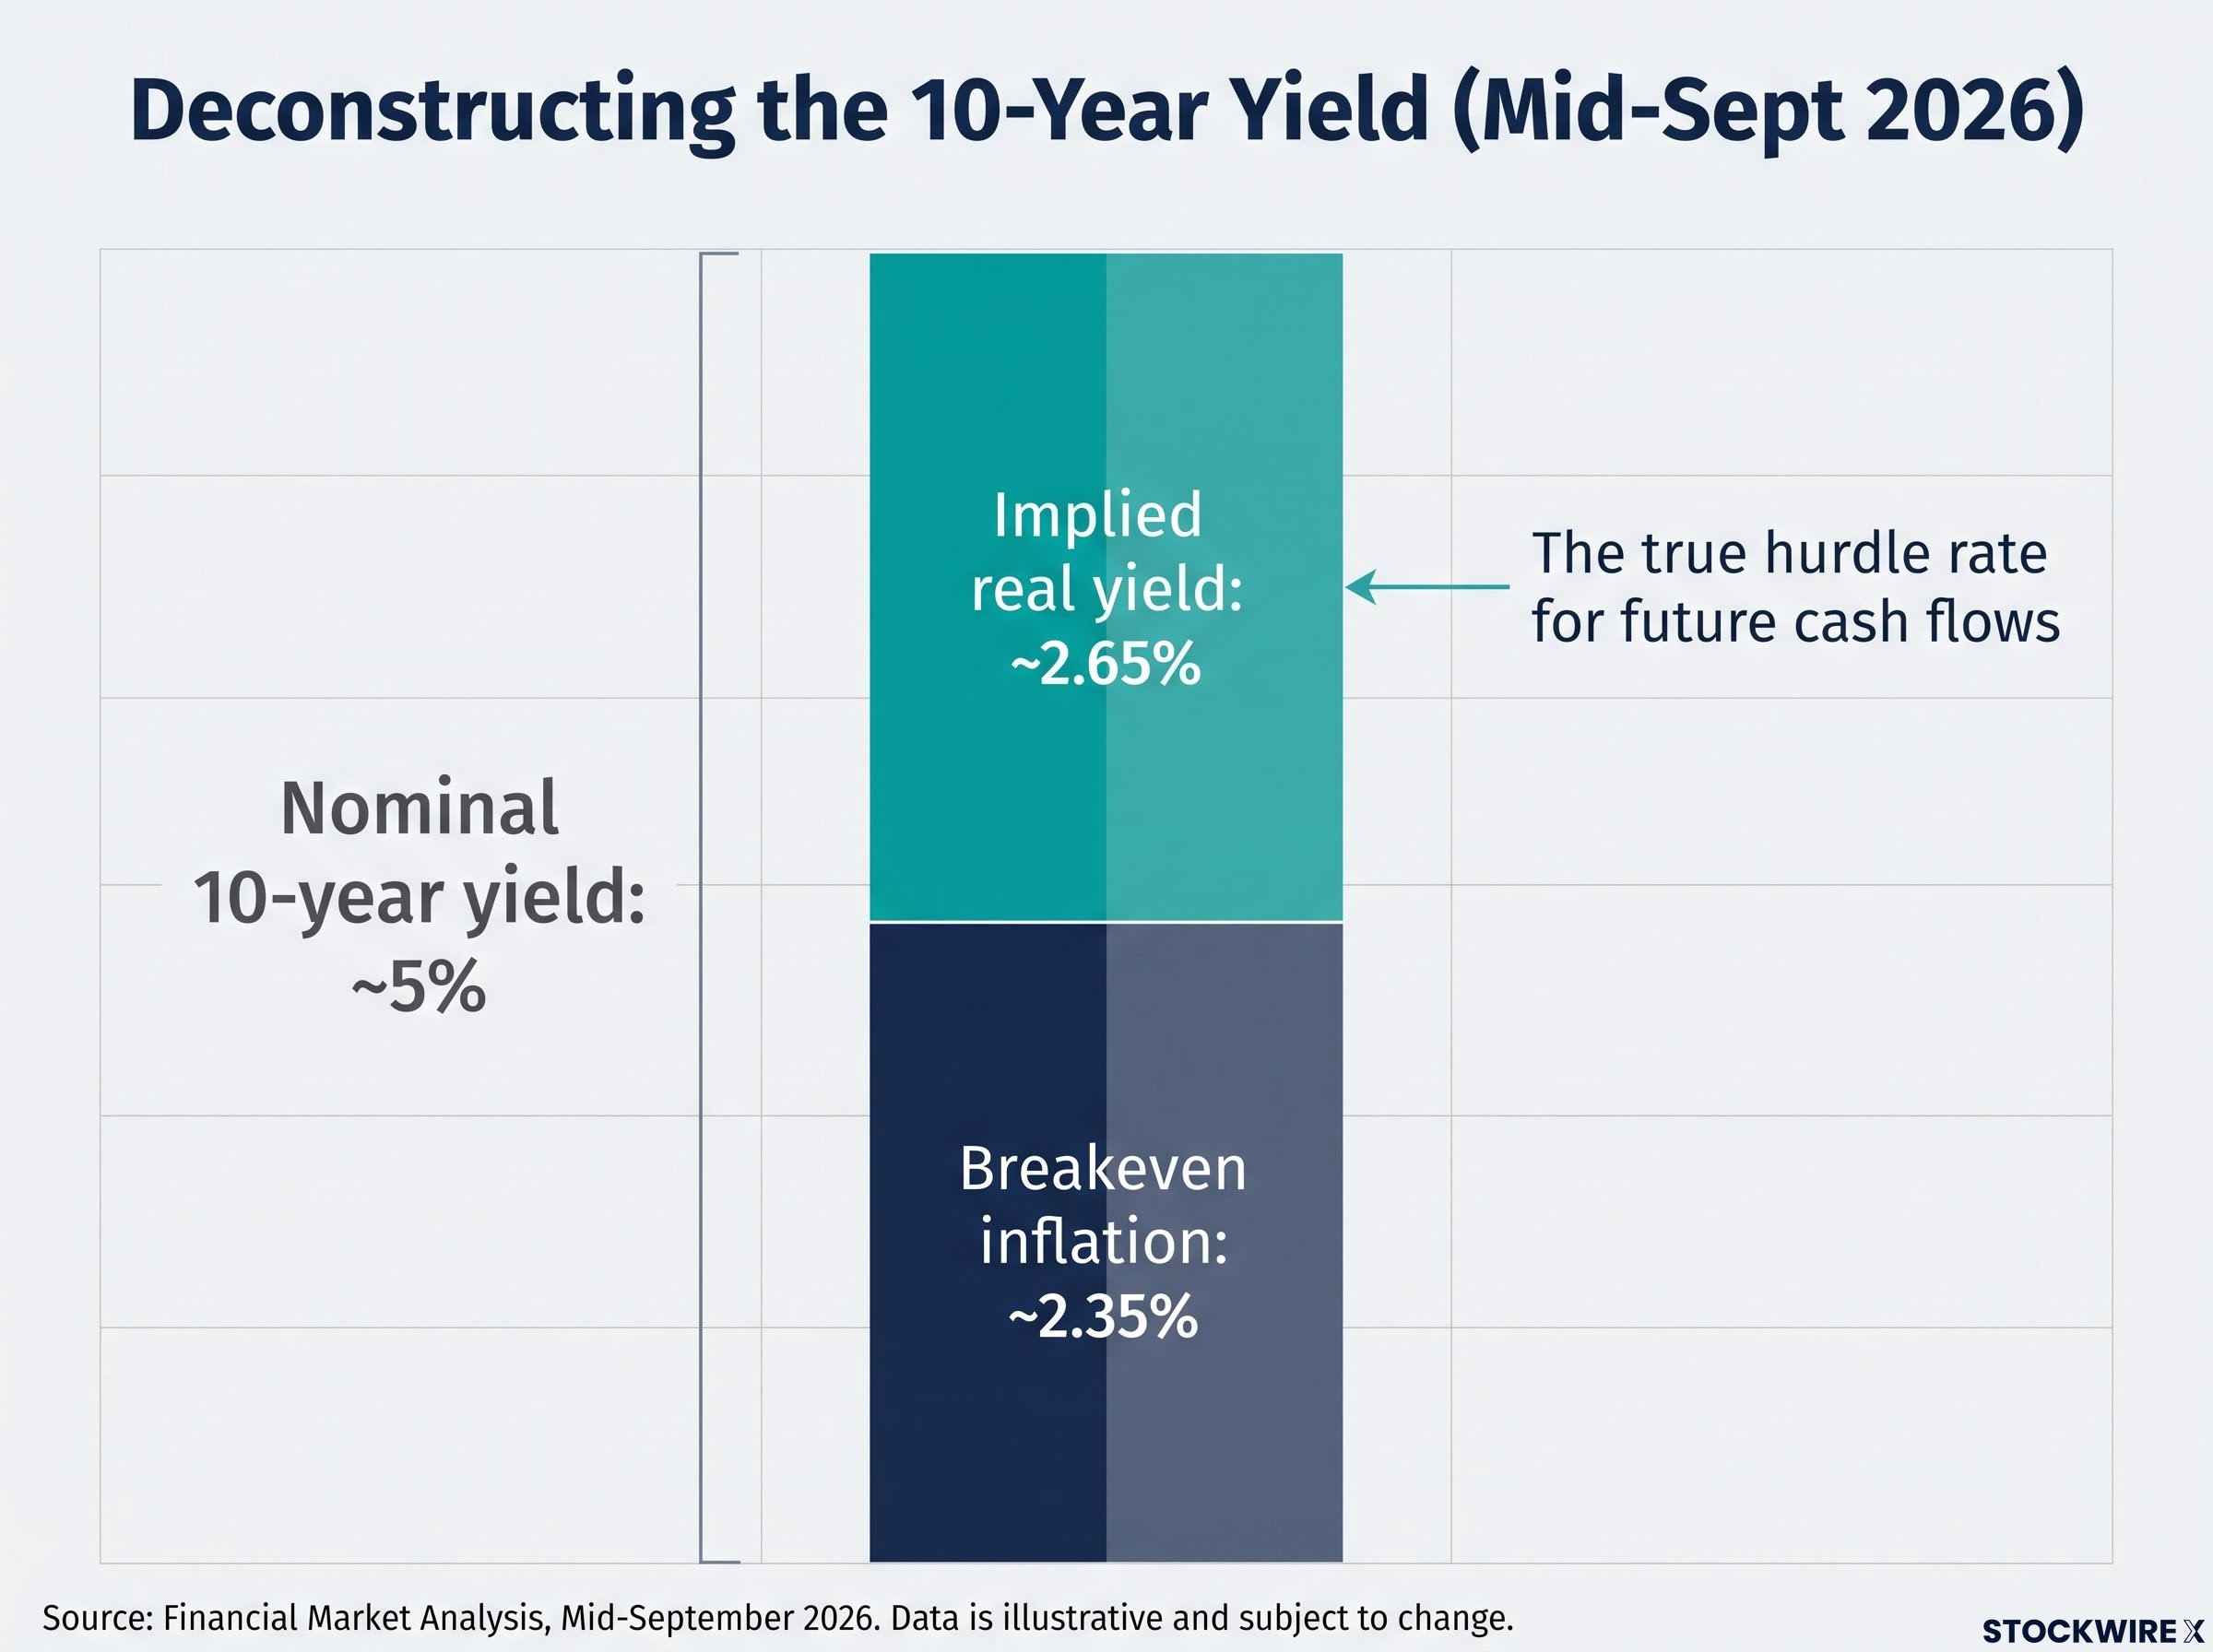
A nominal yield is two things stacked together: the market’s inflation expectation over the next decade, plus the real return an investor demands on top of that. Strip out the inflation component and you get the number that actually matters for equities.
That inflation component, the 10-year breakeven rate, sits at approximately 2.33%-2.40% as of mid-September 2026, placing it in the 85th percentile of the past decade. Subtract it from the nominal yield and the real yield underneath is roughly 2.6%.
Here is what that decomposition reveals.
| Yield component | Current level (mid-Sept 2026) | Interpretation |
|---|---|---|
| Nominal 10-year yield | ~5% | The headline figure most investors watch |
| Breakeven inflation | ~2.35% | Market-implied inflation over 10 years |
| Implied real yield | ~2.65% | The true hurdle rate for future cash flows |
What a 2.6% real yield actually demands of equities
The real yield is the risk-free hurdle rate. Every dollar of future cash flow a growth stock promises must clear that bar to justify today’s price. When the hurdle rises, distant earnings are worth less in present terms.
In purchasing-power terms, a 2.6% real yield is comparable to periods five to eight years ago, when nominal yields sat in the 2.5%-3% range but inflation was near zero. That context matters because it shows how genuinely elevated the current hurdle is once you remove the inflation illusion.
This is the highest risk-free hurdle US growth investors have faced in years. The point to hold onto is that the growth trade surviving at this level is the anomaly requiring explanation, not a baseline you should assume will hold. Notably, the bond market is not yet pulling capital away from growth equities, which is precisely the puzzle the rest of this analysis resolves.
When big ASX news breaks, our subscribers know first
What the VTV/VUG ratio is actually telling you (and what it is not)
One reading of the current market says no rotation is happening. The ratio of the Vanguard Value ETF (VTV) to the Vanguard Growth ETF (VUG) has moved essentially sideways over the past year. In prior rate-hiking cycles, that ratio would have swung hard toward value. Its flatness, on this reading, signals continued growth leadership.
Then the trailing performance data arrives, and it complicates the story.
- VTV 1-year return: approximately 26.83% versus VUG at approximately 12.79% (BrimindInvest, updated 2 August 2026, flagged as unverified)
- J.P. Morgan U.S. ETF Midyear Report (10 July 2026): the Russell 1000 Value Index outperformed the Russell 1000 Growth Index by 10.9 percentage points year-to-date (flagged as unverified)
- ETFDb: Russell 1000 Value returned roughly 32% over the past year versus about 14% for Growth (flagged as unverified)
Those figures do not describe a market ignoring value. They describe value winning on trailing returns by a wide margin.
So which is it? Both, and that is the analytical point. Value has outperformed in relative terms, but growth has not suffered the de-rating collapse that previous rate-hiking cycles produced. The absence of that collapse is itself the signal.
The internal disagreement runs deep, and institutional positioning shows it plainly.
A review of roughly 6,400 13F filings for Q2 2026 found the market split down the middle: 44% of institutions trimmed their Magnificent Seven positions, while 42% initiated or expanded them.
That near-even split tells you something important about how to read this. The VTV/VUG ratio is not a binary switch that flips from growth to value. It is a measure of degree, and the degree here is partial. A meaningful value rotation has already occurred without triggering the growth collapse the playbook predicted, and that changes how you should calibrate risk in a growth-tilted portfolio. Treating the ratio as a single-variable signal would cause you to miss the more consequential finding underneath it.
Why AI-linked earnings are rewriting the discount rate logic
The numbers explain the resilience before any theory does. Start with the scale of what AI-linked earnings are actually delivering.
Nvidia’s reported Q2 fiscal 2026 revenue soared roughly 106% year-over-year to about $96.2 billion, with approximately $89 billion of that stemming from its data-center business (flagged as unverified). Its earlier Q4 fiscal 2026 release (25 February 2026) had already reported record quarterly revenue of $68.1 billion, up 73% year-over-year, and full fiscal-year revenue of $215.9 billion, up 65% (flagged as unverified).
Alphabet’s reported Q2 2026 total revenue reached $119.8 billion, up 24% year-over-year, with Google Cloud revenue climbing 82% to $24.8 billion on enterprise AI demand (flagged as unverified).
| Company | Key revenue metric (Q2 2026) | Year-over-year growth |
|---|---|---|
| Nvidia | ~$96.2B total revenue | ~106% |
| Alphabet | $24.8B Google Cloud revenue | ~82% |
This is the weight that makes the discount rate argument land rather than merely assert itself. Growth resilience is not pure sentiment; current earnings are partially validating the prices.
The mechanism is counterintuitive, and Bank of America named it directly.
Bank of America has noted that AI-sector earnings growth is running so strong it is outpacing share-price appreciation, causing price-to-earnings multiples to compress rather than expand (flagged as unverified).
Sit with that. When earnings grow faster than the stock price, the valuation argument against growth stocks weakens even as real yields climb. That is the specific condition separating this cycle from the 2022 growth selloff, when prices had raced ahead of earnings that never fully arrived.
When rising yields are a growth signal, not a threat
Not all yield increases mean the same thing for equities. Yields that rise alongside genuine upgrades to GDP and earnings expectations have historically been equity-positive. Yields that rise because of fiscal alarm or inflation fear are equity-negative.
Morgan Stanley strategists have argued the market can absorb higher bond yields without a major correction if the economy keeps expanding, citing a 23% earnings growth projection for 2026 (flagged as unverified). BlackRock’s Q4 2026 Investment Outlook echoed the point, noting US earnings expectations continue to rise, driven heavily by AI-linked companies (flagged as unverified).
The current environment reflects a market upgrading its growth expectations. That is why the rate-hike playbook is not firing as expected. If you are waiting for a 2022-style collapse, you may be waiting for conditions that the present earnings cycle simply does not contain.
Where the risks are actually building
Everything above explains why growth has held. Now for where the logic breaks, stated without hedging.
The first risk is duration shock. State Street strategists warn that rising bond yields lift the discount rate applied to distant earnings, which means long-duration growth equities are the most exposed if real yields climb meaningfully from here and stay there (flagged as unverified). The very earnings streams that justify today’s prices sit furthest out on the curve, where a higher discount rate does the most damage.
The second risk is expectations. Current resilience is entirely conditional on AI-linked companies continuing to beat already ambitious consensus estimates. An earnings miss, or a capex rollback among the hyperscalers, could trigger a rapid de-rating with little warning.
The third is that a tug-of-war is already underway in the fund flows.
Morningstar reported that in February 2026, large-growth ETFs saw $5 billion in outflows, their first since January 2023, while large-value ETFs took in a record $17 billion in the same month (flagged as unverified).
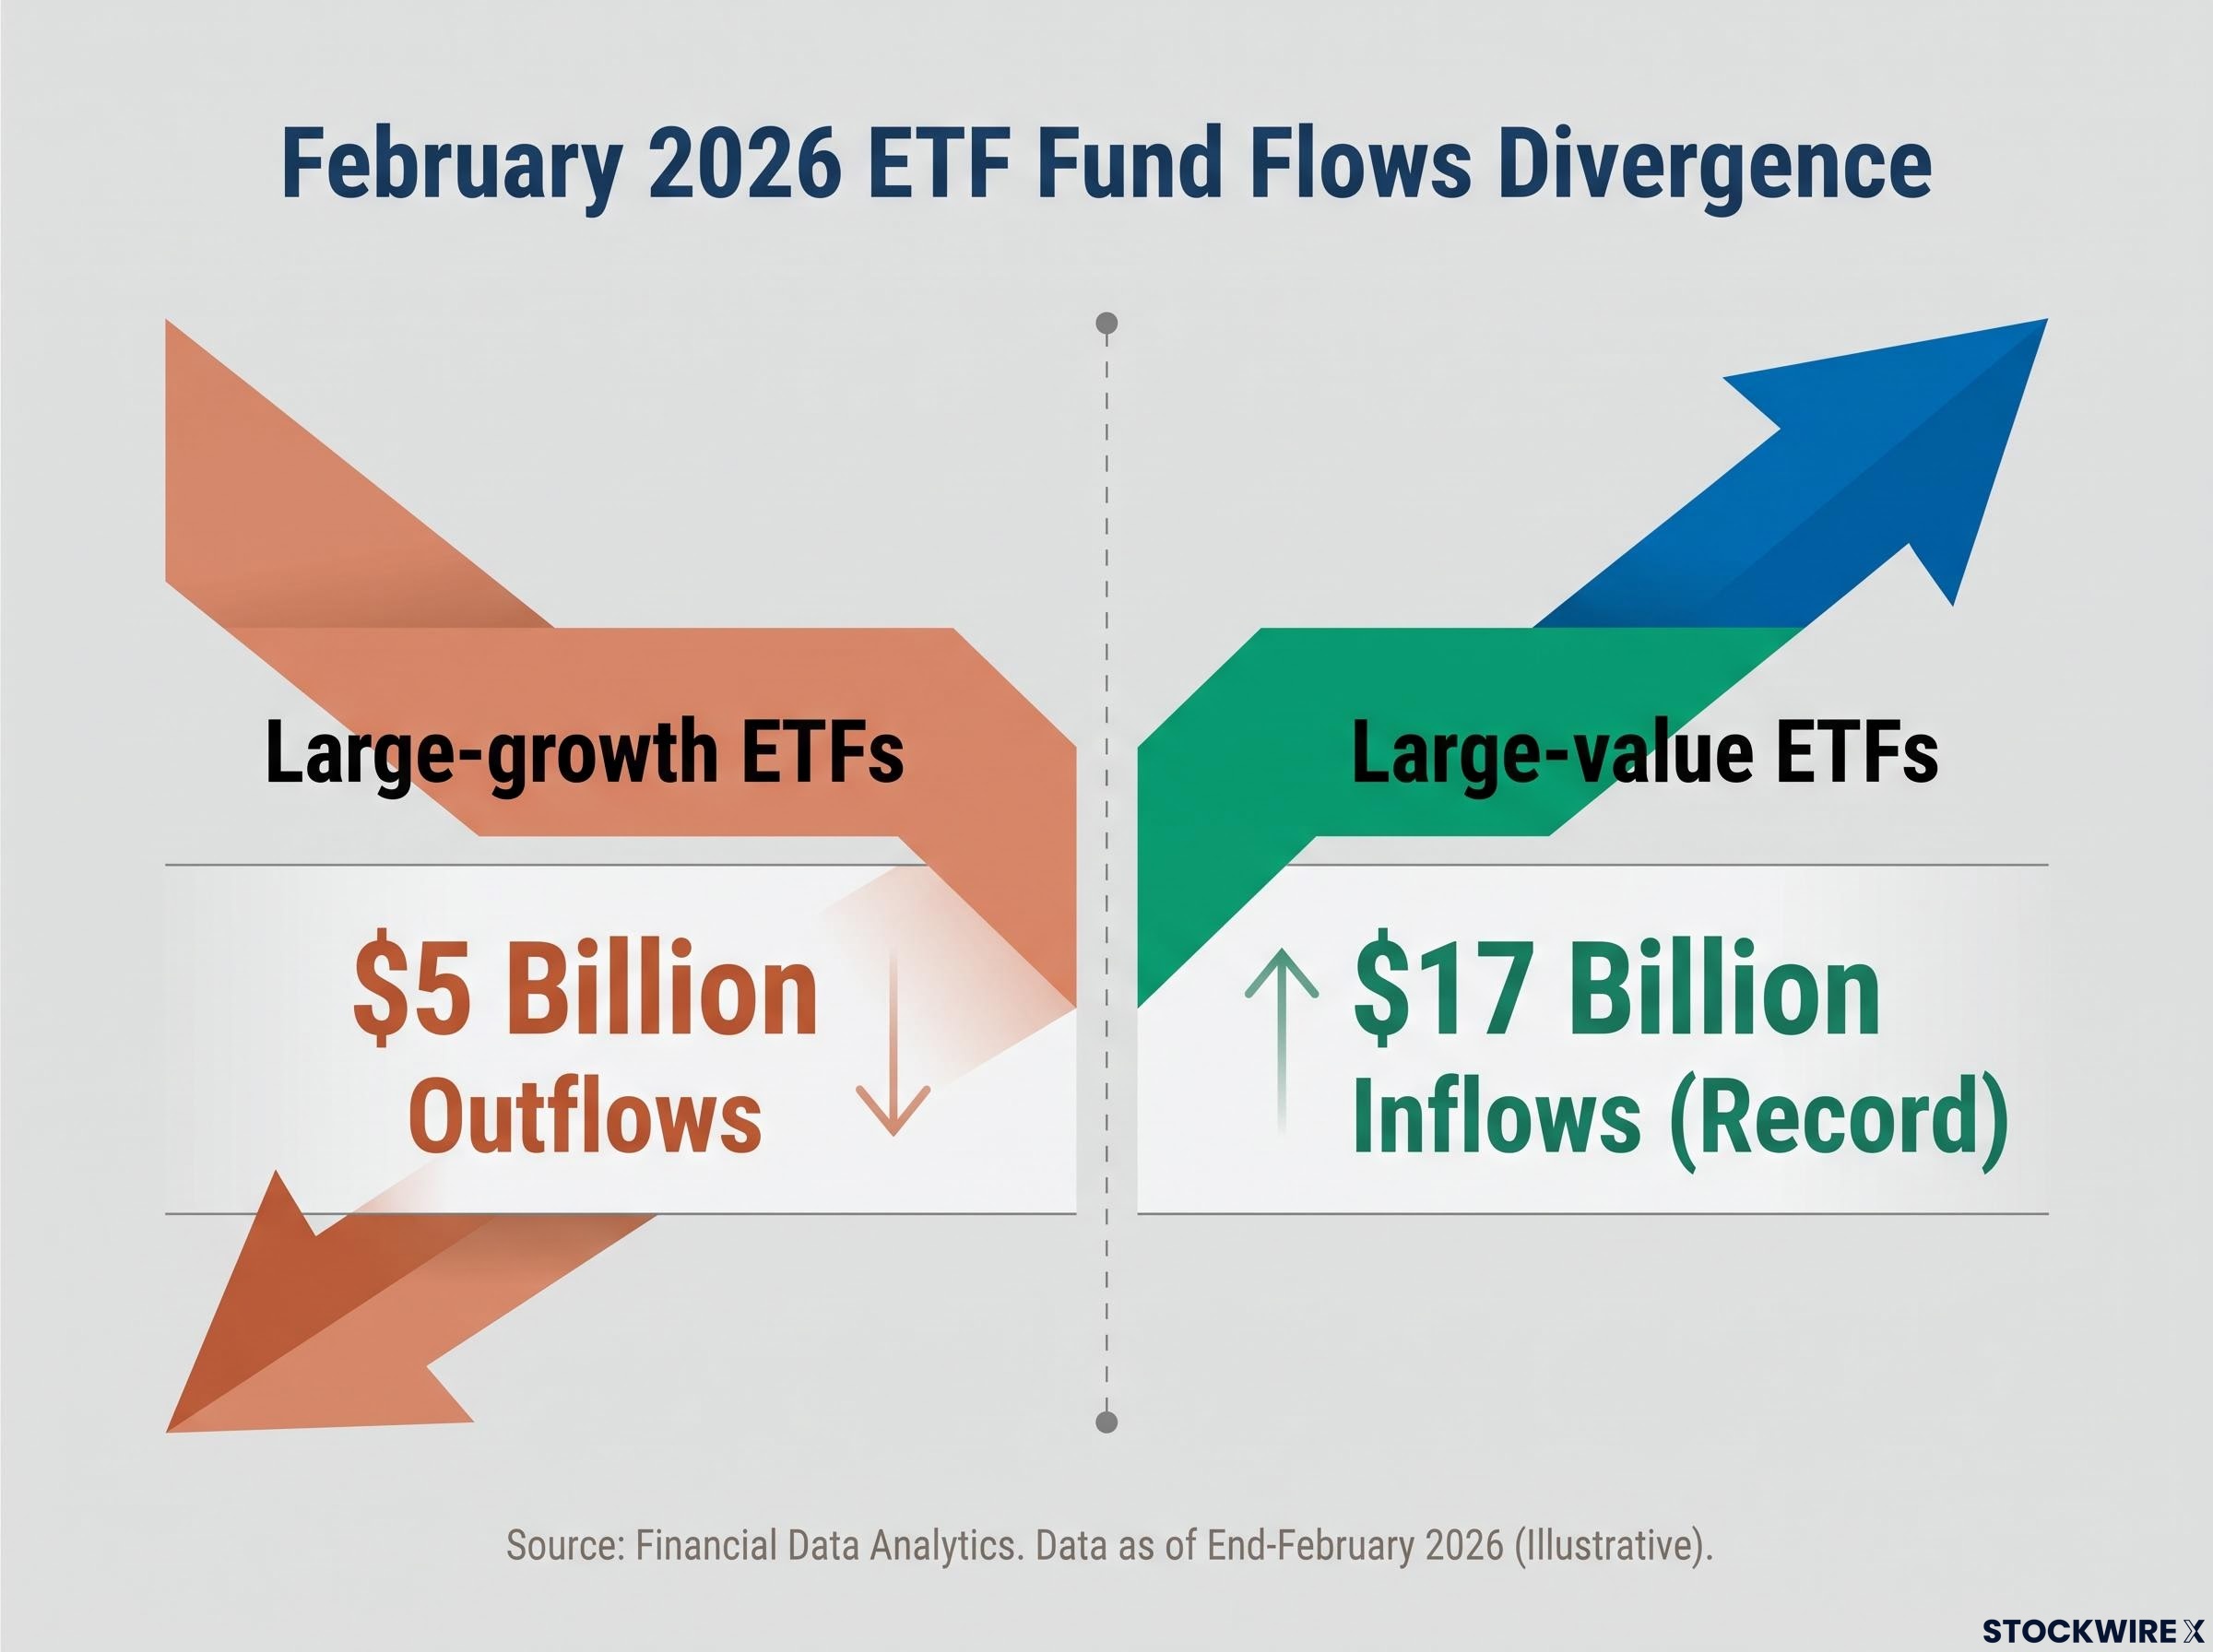
That single month is the starkest illustration of the divide, but it is not the whole picture. By March 2026, YCharts reported large-cap value ETFs had taken in roughly $14 billion over the trailing year, with multi-cap value pulling in $32 billion (flagged as unverified). ETFDb noted roughly $6 billion of net new assets flowed into VTV year-to-date through August 2026 (flagged as unverified).
Yet growth demand has not vanished. ETFTrends observed on 29 July 2026 that the 10 largest growth ETFs were gathering about 30% more assets than their 10 largest value counterparts, and J.P. Morgan noted flows into large-growth and large-value segments have been nearly equal in 2026 (both flagged as unverified).
Read that pattern correctly. Institutions are not making a binary growth-or-value call; they are quietly hedging their growth exposure. The risk-reward in pure-growth positioning is narrowing, even if it has not reversed. Here are the three triggers that would signal a genuine regime change:
- An earnings miss or capex rollback in the AI-linked megacaps
- A further step-up in real yields beyond current levels
- A sustained acceleration in value ETF inflows, not a single strong month
Any one of those, on its own, would warrant reassessing a growth-tilted allocation.
Making a calibrated call in a high-yield, high-growth environment
Two signals are pulling in opposite directions, and both are real. Real yields near 2.6% are high enough to matter for valuation. AI-linked earnings growth is, for now, offsetting that discount rate headwind at the index level. Neither cancels the other; they coexist in tension.
That tension is watchable and testable, quarter by quarter. Rather than asking whether to be in growth or value, the sharper question is what specific conditions would make you reduce growth exposure. Three variables give you that framework:
- Real yield threshold: a further leg higher above current levels raises the hurdle rate that today’s earnings are barely clearing
- Earnings delivery: Nvidia’s roughly 106% revenue growth and Alphabet Cloud’s 82% are the numbers holding the thesis together; a miss cycle in the hyperscalers removes the offset
- Value inflow trend: a sustained shift in ETF flows, distinct from a single record month, would confirm rotation rather than hedging
Large institutional capital has not yet shifted its structural view. BlackRock has maintained an overweight on US equities and technology, citing AI earnings as sufficient to offset higher rates, and Wellington Management (managing about $1.3 trillion) categorises hyperscalers as core holdings (both flagged as unverified). The 44%/42% split on the Magnificent Seven confirms the picture: caution and conviction in near-equal measure.
The mental model to leave with is simple. Growth holds as long as AI earnings keep beating estimates and real yields do not make a further leg higher. A growth tilt is defensible today, but the margin of safety is narrower than it was 12 months ago, and adding some value exposure as a hedge does not require committing to a full rotation thesis.
This article is for informational purposes only and should not be considered financial advice. Investors should conduct their own research and consult with financial professionals before making investment decisions.
Past performance does not guarantee future results. Financial projections are subject to market conditions and various risk factors. Several data points referenced above are flagged as unverified and should be independently confirmed before acting on them.