A 5% yield on a 10-year Treasury sounds like the best deal fixed income investors have seen in nearly two decades. Then you subtract 3.4% inflation, and what looked like a generous return quietly shrinks to something closer to 1.6%. The number on paper and the number in your pocket are not the same thing, and right now the gap between them matters more than usual.
That gap is the whole story of September 2026. Headline CPI is running at 3.4% year-over-year, oil has pushed back above $100 per barrel, and Federal Reserve rate cut expectations have been shoved out to mid-2027 or later. The risk here is not simply that your bonds underperform. It is that the assets you assumed were the safe part of your portfolio are steadily losing purchasing power while the yield figure reassures you nothing is wrong.
This piece gives you the tools to read the current environment correctly. You will learn how to calculate what your bonds actually earn after inflation, what the short and long ends of the yield curve are each telling you, where the real risks sit in a fixed income portfolio today, and how to decide whether bonds still belong in yours.
Why 3.4% inflation hits bond investors harder than the headline suggests
Start with the arithmetic you can do in your head. A bond pays you a nominal yield, the number printed on the coupon. Inflation eats into that number. What is left over is your real return, the actual increase in what your money can buy.
Economists approximate this with the Fisher equation: nominal yield minus expected inflation gives you roughly your real return. So a 4% coupon in a 3.4% inflation environment leaves you with about 60 basis points of genuine gain. That is the entire reward for locking up your capital.
A nominal yield only becomes a real return after you subtract what inflation takes. Right now, that subtraction matters more than usual.
Here is where it gets uncomfortable. That 0.6% buffer is razor-thin, which means the risk is asymmetric. If inflation surprises even modestly to the upside, your real return can flip negative without the nominal yield on your bond changing by a single basis point.
The two inflation measures tell different stories, and you need to know which one applies to you. Headline CPI, released by the Bureau of Labor Statistics on 11 September 2026, rose 3.4% year-over-year and 0.4% month-over-month. Core CPI, which strips out food and energy, rose just 2.4% year-over-year and 0.3% month-over-month.
- Headline CPI: 3.4% — includes volatile energy and food; gasoline jumped 3.9% month-over-month
- Core CPI: 2.4% — the underlying trend once energy noise is removed
That divergence is not a technicality. It tells you energy is doing the heavy lifting in the headline number right now, with Brent crude near $105-$108 per barrel and WTI near $101-$103 amid escalating geopolitical tensions. If oil stays elevated or climbs further, your bond’s real return could compress toward the headline figure rather than the gentler core one.
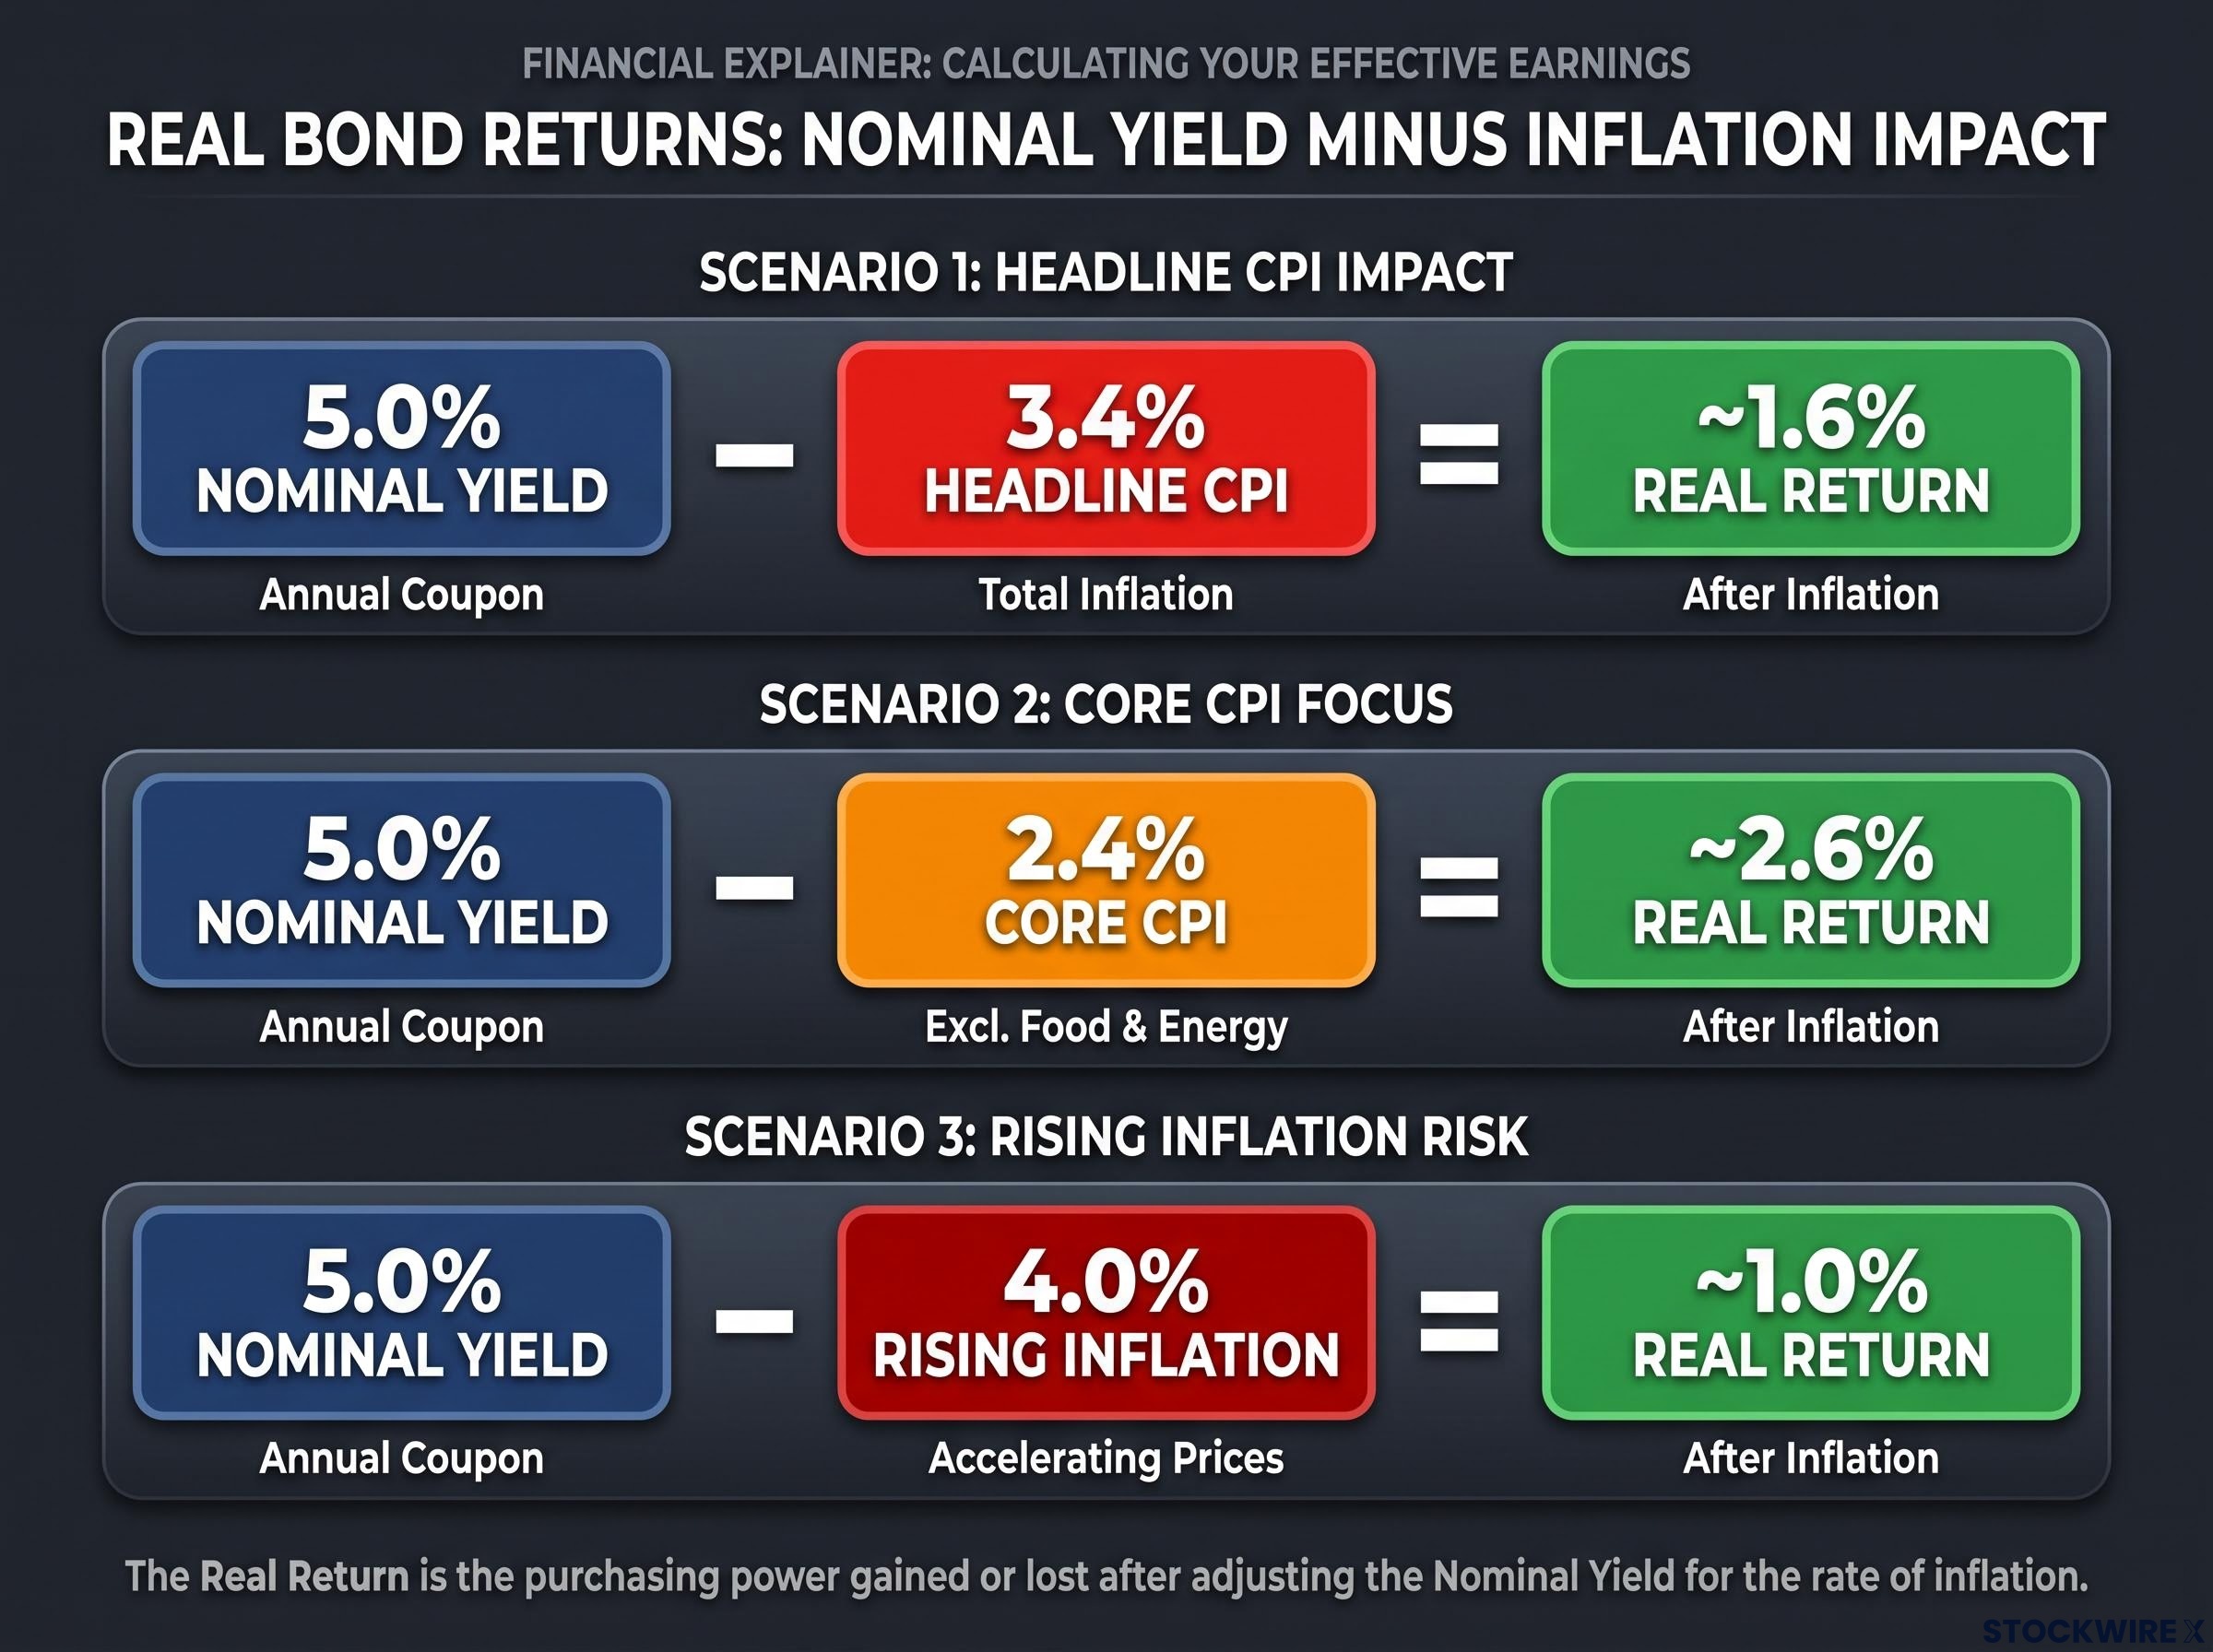
| Scenario | Nominal Yield | Inflation Measure | Approx. Real Return |
|---|---|---|---|
| Against headline CPI | 5.0% | 3.4% | ~1.6% |
| Against core CPI | 5.0% | 2.4% | ~2.6% |
| If inflation rises to 4.0% | 5.0% | 4.0% | ~1.0% |
Most investors anchor on the nominal yield and stop there. Once you run the real return calculation, that anchor moves, and every bond in your portfolio looks different.
Bruegel data shows roughly 80% of the rise in US long-term rates since September 2024 is attributable to the real yield component rather than inflation expectations, classifying the move as a discount-rate shock and reinforcing why the gap between nominal and real returns has become the central variable for fixed income positioning.
When big ASX news breaks, our subscribers know first
What the yield curve is actually telling you right now
The yield curve is not one signal. It is a diagnostic instrument, and its two ends are moving for entirely different reasons.
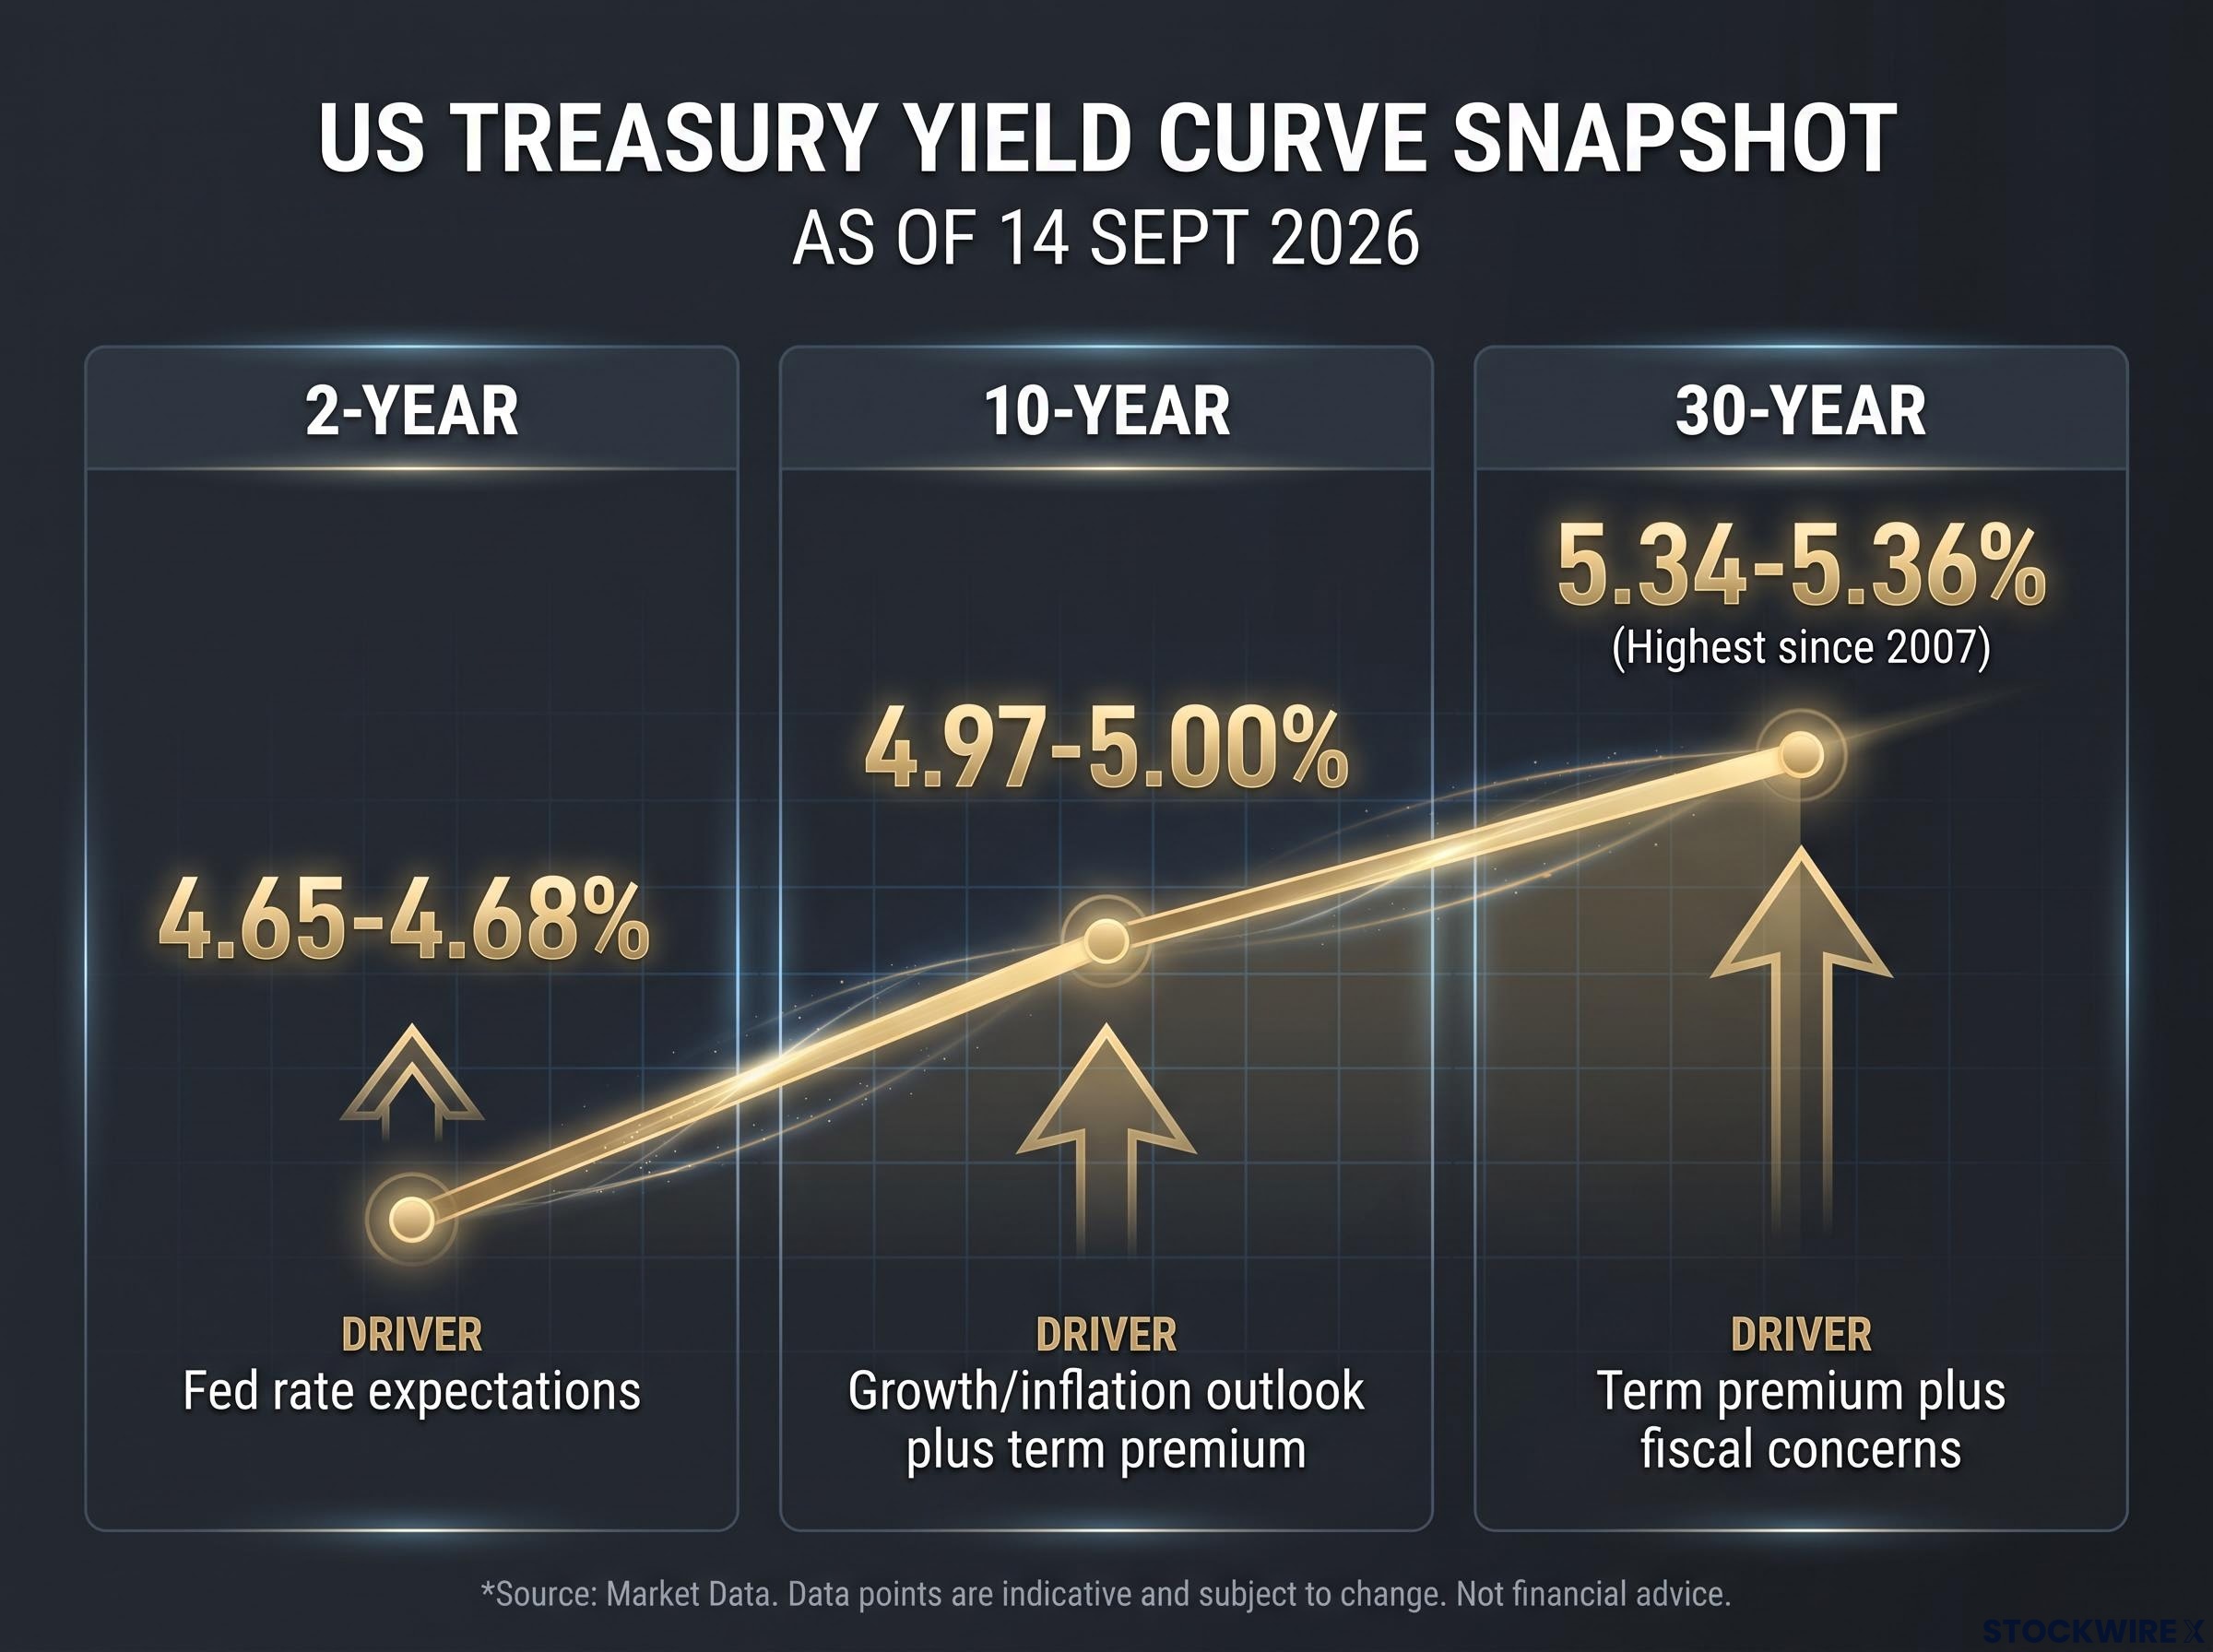
As of 14 September 2026, the 2-year Treasury yields 4.65-4.68%, the 10-year sits at 4.97-5.00%, and the 30-year has climbed to 5.34-5.36%, its highest level since 2007. The 2s10s spread, the gap between two- and ten-year yields, remains narrow and positive.
| Maturity | Current Yield (14 Sept 2026) | Primary Driver |
|---|---|---|
| 2-year | 4.65-4.68% | Fed rate expectations |
| 10-year | 4.97-5.00% | Growth/inflation outlook plus term premium |
| 30-year | 5.34-5.36% | Term premium plus fiscal concerns |
That the 30-year is at its highest since 2007 is not a number to note in passing. It signals that markets now demand a meaningful premium to lend to the US government for a generation, and that repricing flows straight through to every long-duration bond you hold.
Why the short end is stuck high
The short end tracks what the Fed is expected to do. Through 2026, that expectation has moved sharply in one direction: later and fewer cuts.
A March 2026 poll found most economists expecting the first cut by June 2026. By late June 2026, over three-quarters of polled economists expected the Fed to hold steady at 3.50-3.75% through the end of the year, with rate cuts now not anticipated until mid-2027 or beyond. The short end is high because the market has given up on near-term relief.
Rate futures currently assign a high probability to a September 2026 hike, but the Fed rate path implied by professional consensus diverges sharply from that market pricing, with Reuters polling and BofA Global Research both expecting the Fed to hold through end-2026 and cut only gradually from mid-2027.
Why the long end is rising for different reasons
The long end answers a different question. It reflects the term premium, the extra compensation investors demand for the uncertainty of holding a long-dated bond.
The extra yield on a 30-year bond versus a 2-year isn’t just about time, it’s the price markets charge for fiscal and geopolitical uncertainty.
That premium currently sits around 50-80 basis points, elevated from late 2025 levels. Large fiscal deficits, heavy bond issuance, and the loss of the United States’ final AAA credit rating have all pushed investors to charge more for lending long. The practical consequence for you is blunt: a rising term premium means long-duration bond prices have further to fall even if the Fed never hikes again.
The specific risks bearing down on bond portfolios today
Diagnosis is one thing. Exposure is another. Here are the three risks bearing down on your holdings right now, in order of how directly they hit you.
- Duration risk. Longer-maturity bonds fall harder when yields rise. With the 30-year at 5.35%, anyone holding long-duration bond funds or ETFs has already absorbed meaningful mark-to-market losses. When yields rise, existing bond prices fall, and if you sell before maturity, you crystallise that loss rather than waiting for the bond to repay at par.
- Stealth inflation risk. This is the quiet one. A bond yielding 4% against 3.4% inflation has just a 0.6% real buffer. If inflation climbs to 4.5%, that bond is losing purchasing power in real terms, even though the coupon has not changed and nothing on your statement looks broken.
- Credit and refinancing risk. Higher yields widen credit spreads and raise borrowing costs. Both corporate and sovereign issuers must refinance maturing debt at these higher rates, which pressures credit quality over time. Ongoing fiscal deficits and heavy issuance keep supply-side pressure on yields, compounding the problem.
The most underappreciated bond risk today isn’t a crash: it’s the slow erosion of real returns in a portfolio that looks fine on paper.
Duration is the lever that determines how much of this environment you have already absorbed. Working out where you sit on that lever, short, intermediate, or long, is the first practical step you need to take before doing anything else.
Bond duration is the lever that converts a yield move into a dollar loss: a fund with duration of 17 loses roughly 17% when rates rise one percentage point, while a duration-6 fund loses only 6%, even though both carry the label ‘bond fund.’
Where bonds still work, and how to position for this environment
Now the other side of the ledger. Bonds are not broken. In fact, they are offering something they have withheld for most of the post-2008 era: a positive real yield.
With core CPI at 2.4% and the 10-year near 5.0%, Treasuries are handing you a real return of roughly 2.6% on a core-inflation basis. That is the most attractive real yield environment for US government debt in over fifteen years, and it changes the calculus for anyone deciding whether to add, hold, or trim fixed income right now.
High starting yields also create a buffer. The income itself offsets a portion of any future price decline, which is why periods of elevated starting yields have historically produced favourable forward returns for investors who held through the volatility. The coupon does the cushioning work.
Bonds also keep their traditional role as a shock absorber. If economic growth deteriorates and equities sell off, high-quality bonds still tend to hold up, giving your portfolio a counterweight even in a high-rate world.
The instruments and durations that belong in a portfolio have shifted, though. Here is how the three main strategies compare.
| Strategy | Instruments | Key Benefit | Key Caveat |
|---|---|---|---|
| Short duration | T-bills, short-term bond ETFs | Limited rate sensitivity | Lower yield than the long end |
| Inflation protection | TIPS, I-bonds | Direct CPI linkage | Can underperform if inflation falls faster than expected |
| Income focus | High-yield bonds, diversified bond funds | Higher income | Requires credit quality awareness |
Treasury Inflation-Protected Securities (TIPS) deserve a specific mention. These are US government bonds whose principal adjusts with CPI, so they protect purchasing power mechanically rather than relying on a favourable gap between yield and inflation.
Bonds make strategic sense right now under three conditions:
- You want a positive real yield, which Treasuries currently deliver on a core-inflation basis
- You want diversification against equity risk if growth deteriorates
- You have a hold-to-maturity orientation and can ignore mark-to-market noise along the way
If those describe your situation, the asset class is working for you. If they do not, the problem is likely your duration or instrument choice, not bonds themselves.
Making a considered call in a high-yield, high-inflation environment
Pull the threads together and the tension resolves into a single insight. Nominal yields are historically attractive, real yields are genuinely positive, but duration risk and inflation uncertainty mean the type of bond you own matters as much as the decision to own bonds at all.
That is why the practical takeaway is not “buy bonds” or “avoid bonds.” It is that owning bonds right now is inseparable from choosing which bonds and at what duration, because the spread between getting that right and getting it wrong has rarely been this wide.
Before you make any move, you should be able to answer three questions about your own portfolio:
- What is my effective duration exposure, and how much of the current rate move have I already absorbed?
- What is my real yield after adjusting for the inflation measure most relevant to my time horizon, headline or core?
- Am I holding to maturity, or am I exposed to mark-to-market volatility if I need to sell early?
With rate cuts now a 2027 story at the earliest, fixed income investors are making decisions inside a structurally different regime, not a temporary spike.
For readers who want a decision framework built around their specific time horizon, our dedicated guide to bond investing strategy covers whether to sell, shorten duration, or stay the course, using a bond ladder structure as the core tool for income-focused investors navigating elevated yields.
This is not a brief interruption. With Fed cuts pushed to mid-2027 or beyond, higher-for-longer is your operating context for at least the next 12-18 months, and with Brent near $105-$108, headline inflation could stay elevated and compress real returns further.
This article is for informational purposes only and should not be considered financial advice. Investors should conduct their own research and consult with financial professionals before making investment decisions. Past performance does not guarantee future results, and financial projections are subject to market conditions and various risk factors.