Every single day, around $9.6 trillion changes hands in the world’s currency markets, according to the April 2025 Bank for International Settlements (BIS) Triennial Survey. The US Dollar sits on one side of roughly 89% of those trades. So the obvious question is: what actually moves it?
Most explanations stop at a single sentence. The Federal Reserve raised rates, so the US Dollar went up. That shorthand is not wrong, but it is dangerously incomplete, and it tends to fail traders at exactly the wrong moments: when a rate hike does nothing, or when the Fed floods the system with liquidity and the Dollar climbs anyway.
The reader who understands the transmission mechanism, not just the headline rule, is the one who can interpret a market move rather than be blindsided by it.
Here is the framework that makes Fed week legible. This piece walks through how each Fed policy tool feeds into currency markets, what the CME FedWatch tool is genuinely measuring and where it misleads, and what technical indicators such as EMA and RSI actually reveal about near-term Dollar momentum.
Why the Dollar sits at the centre of every currency market
Start with the number, because the number frames everything else.
$9.6 trillion in daily FX turnover That is the average daily volume across all foreign-exchange instruments in April 2025, per the BIS Triennial Central Bank Survey. The US Dollar features in approximately 89% of it.
To put that share in perspective: nearly nine out of every ten currency trades on the planet touch the Dollar in some way. When the Fed shifts policy, the shockwave does not stay inside America’s borders. It travels through the overwhelming majority of global currency trading, which is why this mechanism matters even to someone who never holds a USD pair directly.
The BIS 2025 Triennial Central Bank Survey, the authoritative benchmark for global FX market structure, recorded that $9.6 trillion in average daily turnover and confirmed the US Dollar’s presence in approximately 89% of all currency trades, making it the definitive source for the volume figures that frame any discussion of Dollar dominance.
That dominance is not an accident, and it is not new. After World War II, the US Dollar displaced the British Pound as the world’s leading reserve currency, and although the Dollar was anchored to gold for decades, that link ended under the Bretton Woods framework in 1971. What replaced the gold anchor was something sturdier: structural entrenchment.
Three pillars hold that position in place:
- Deep, liquid Treasury markets that let central banks and reserve managers park enormous sums in safe assets they can move in and out of easily.
- Trade invoicing and commodity pricing network effects, where oil, metals, and much of global trade are priced in Dollars, creating constant demand regardless of what the Fed does in any given week.
- US institutional stability, a predictable legal framework, and open capital markets that make Dollar assets attractive for long-term holding.
Reserve managers reflect this. IMF data continue to show the US Dollar as the largest component of official global reserves, though its share has drifted lower in a slow, gradual decline from its early-2000s peaks.
What this means for you is straightforward. The Dollar carries a baseline of demand that exists independently of monetary policy. Fed decisions move the Dollar at the margin, but they move it on top of an enormous structural foundation. That is the scale of what the next mechanism is actually pushing against.
When big ASX news breaks, our subscribers know first
How Fed rate decisions transmit into the Dollar’s value
The received wisdom is “higher rates, stronger Dollar.” True enough, but knowing why it works is what lets you spot when it will not.
The core mechanism is about rate differentials and where money flows to find yield. When US interest rates rise relative to other major economies, Dollar-denominated assets such as Treasuries and deposits start offering more attractive returns. Foreign investors want that yield, and to buy those assets they first have to buy Dollars.
The yield differential logic that drives Dollar flows sits inside a broader set of central bank rate mechanics that simultaneously reprice bonds, equities, gold, and currency exposure the moment a policy committee speaks, which is why a single Fed decision reverberates well beyond the FX market.
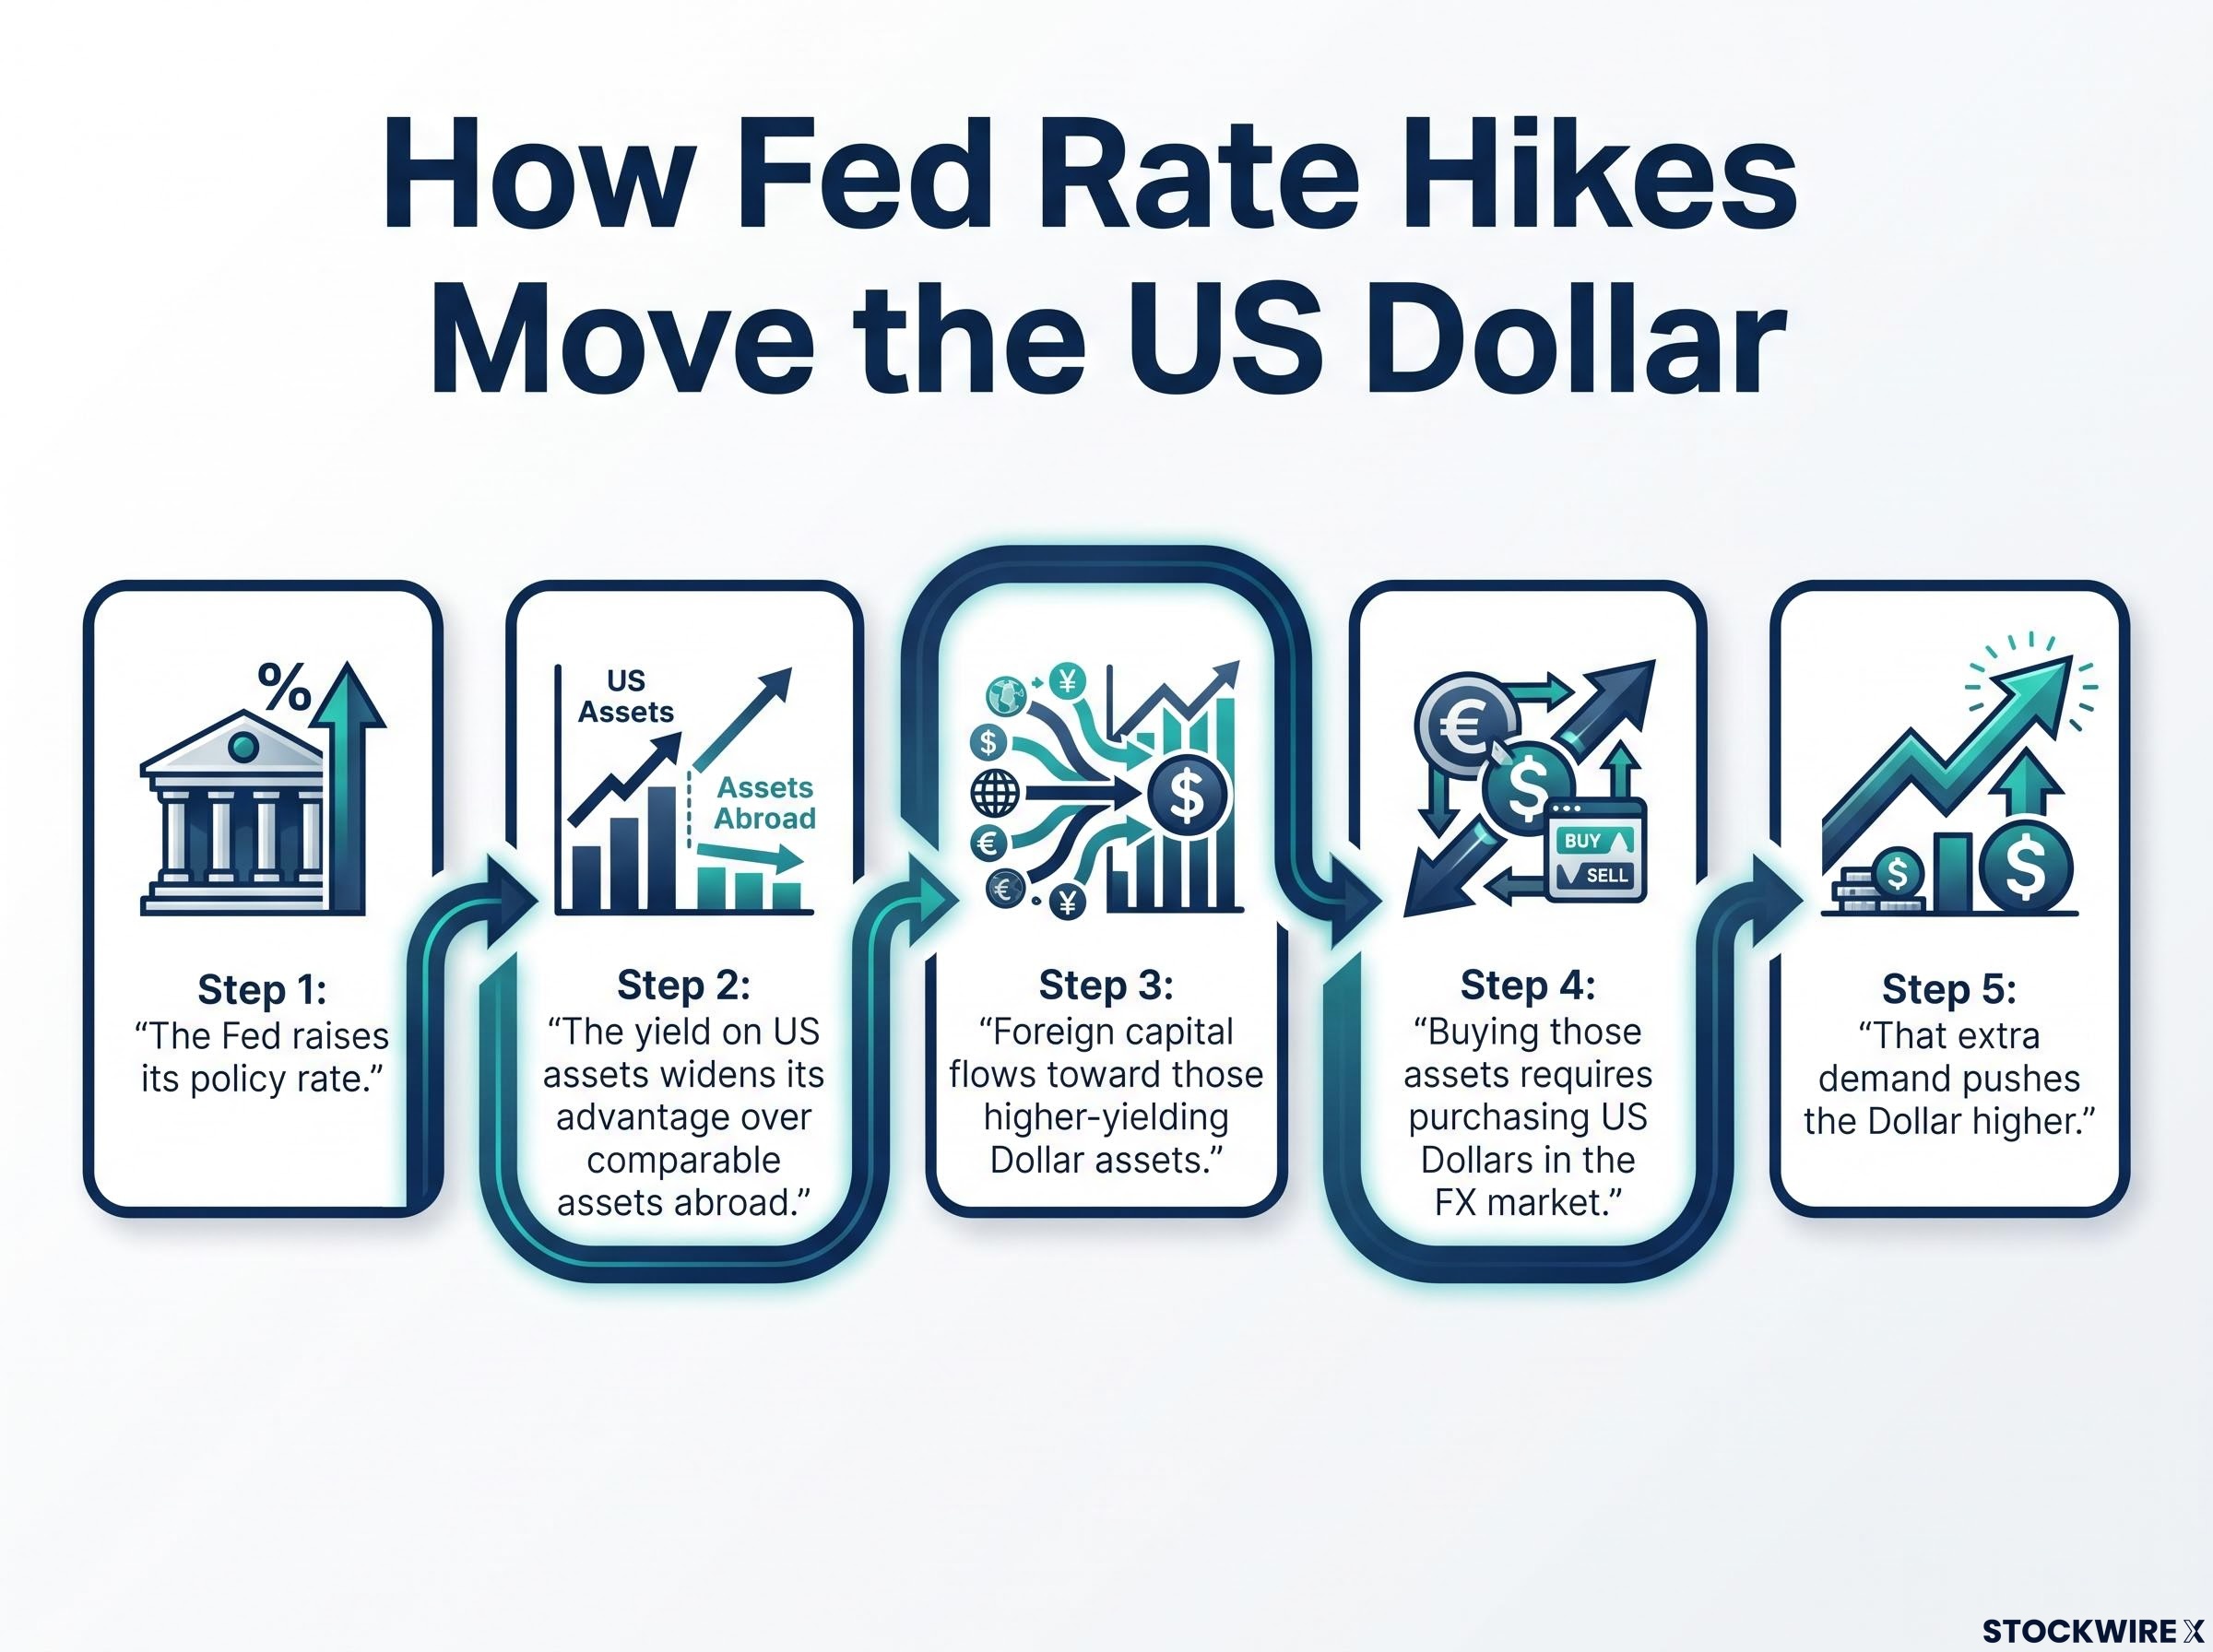
Here is the chain, link by link:
- The Fed raises its policy rate.
- The yield on US assets widens its advantage over comparable assets abroad.
- Foreign capital flows toward those higher-yielding Dollar assets.
- Buying those assets requires purchasing US Dollars in the FX market.
- That extra demand pushes the Dollar higher.
There is a reinforcing layer on top. Carry trades add fuel: investors borrow in low-yield currencies such as the Japanese yen or the euro, then park the proceeds in higher-yielding US assets. That behaviour piles further buying pressure onto the Dollar, and Fed officials have acknowledged that a tighter stance can strengthen the Dollar and tighten financial conditions globally, particularly for emerging markets that borrow in USD.
Now the complication. Rate hikes do not always lift the Dollar, and the exceptions are where most traders get caught:
- The hike is already priced in. If the market fully expects a hike, the decision itself can be a non-event, or even trigger a “buy the rumour, sell the fact” reaction where the Dollar softens once the news is confirmed.
- The hike reads as a policy error. If investors interpret tightening as a response to deteriorating conditions, or a mistake that raises recession risk, they may move away from US assets rather than toward them.
- Growth elsewhere dominates. Parts of the 2017-2018 hiking cycle saw the Dollar stall or weaken even as the Fed raised rates, because improving growth outside the US overwhelmed the rate differential.
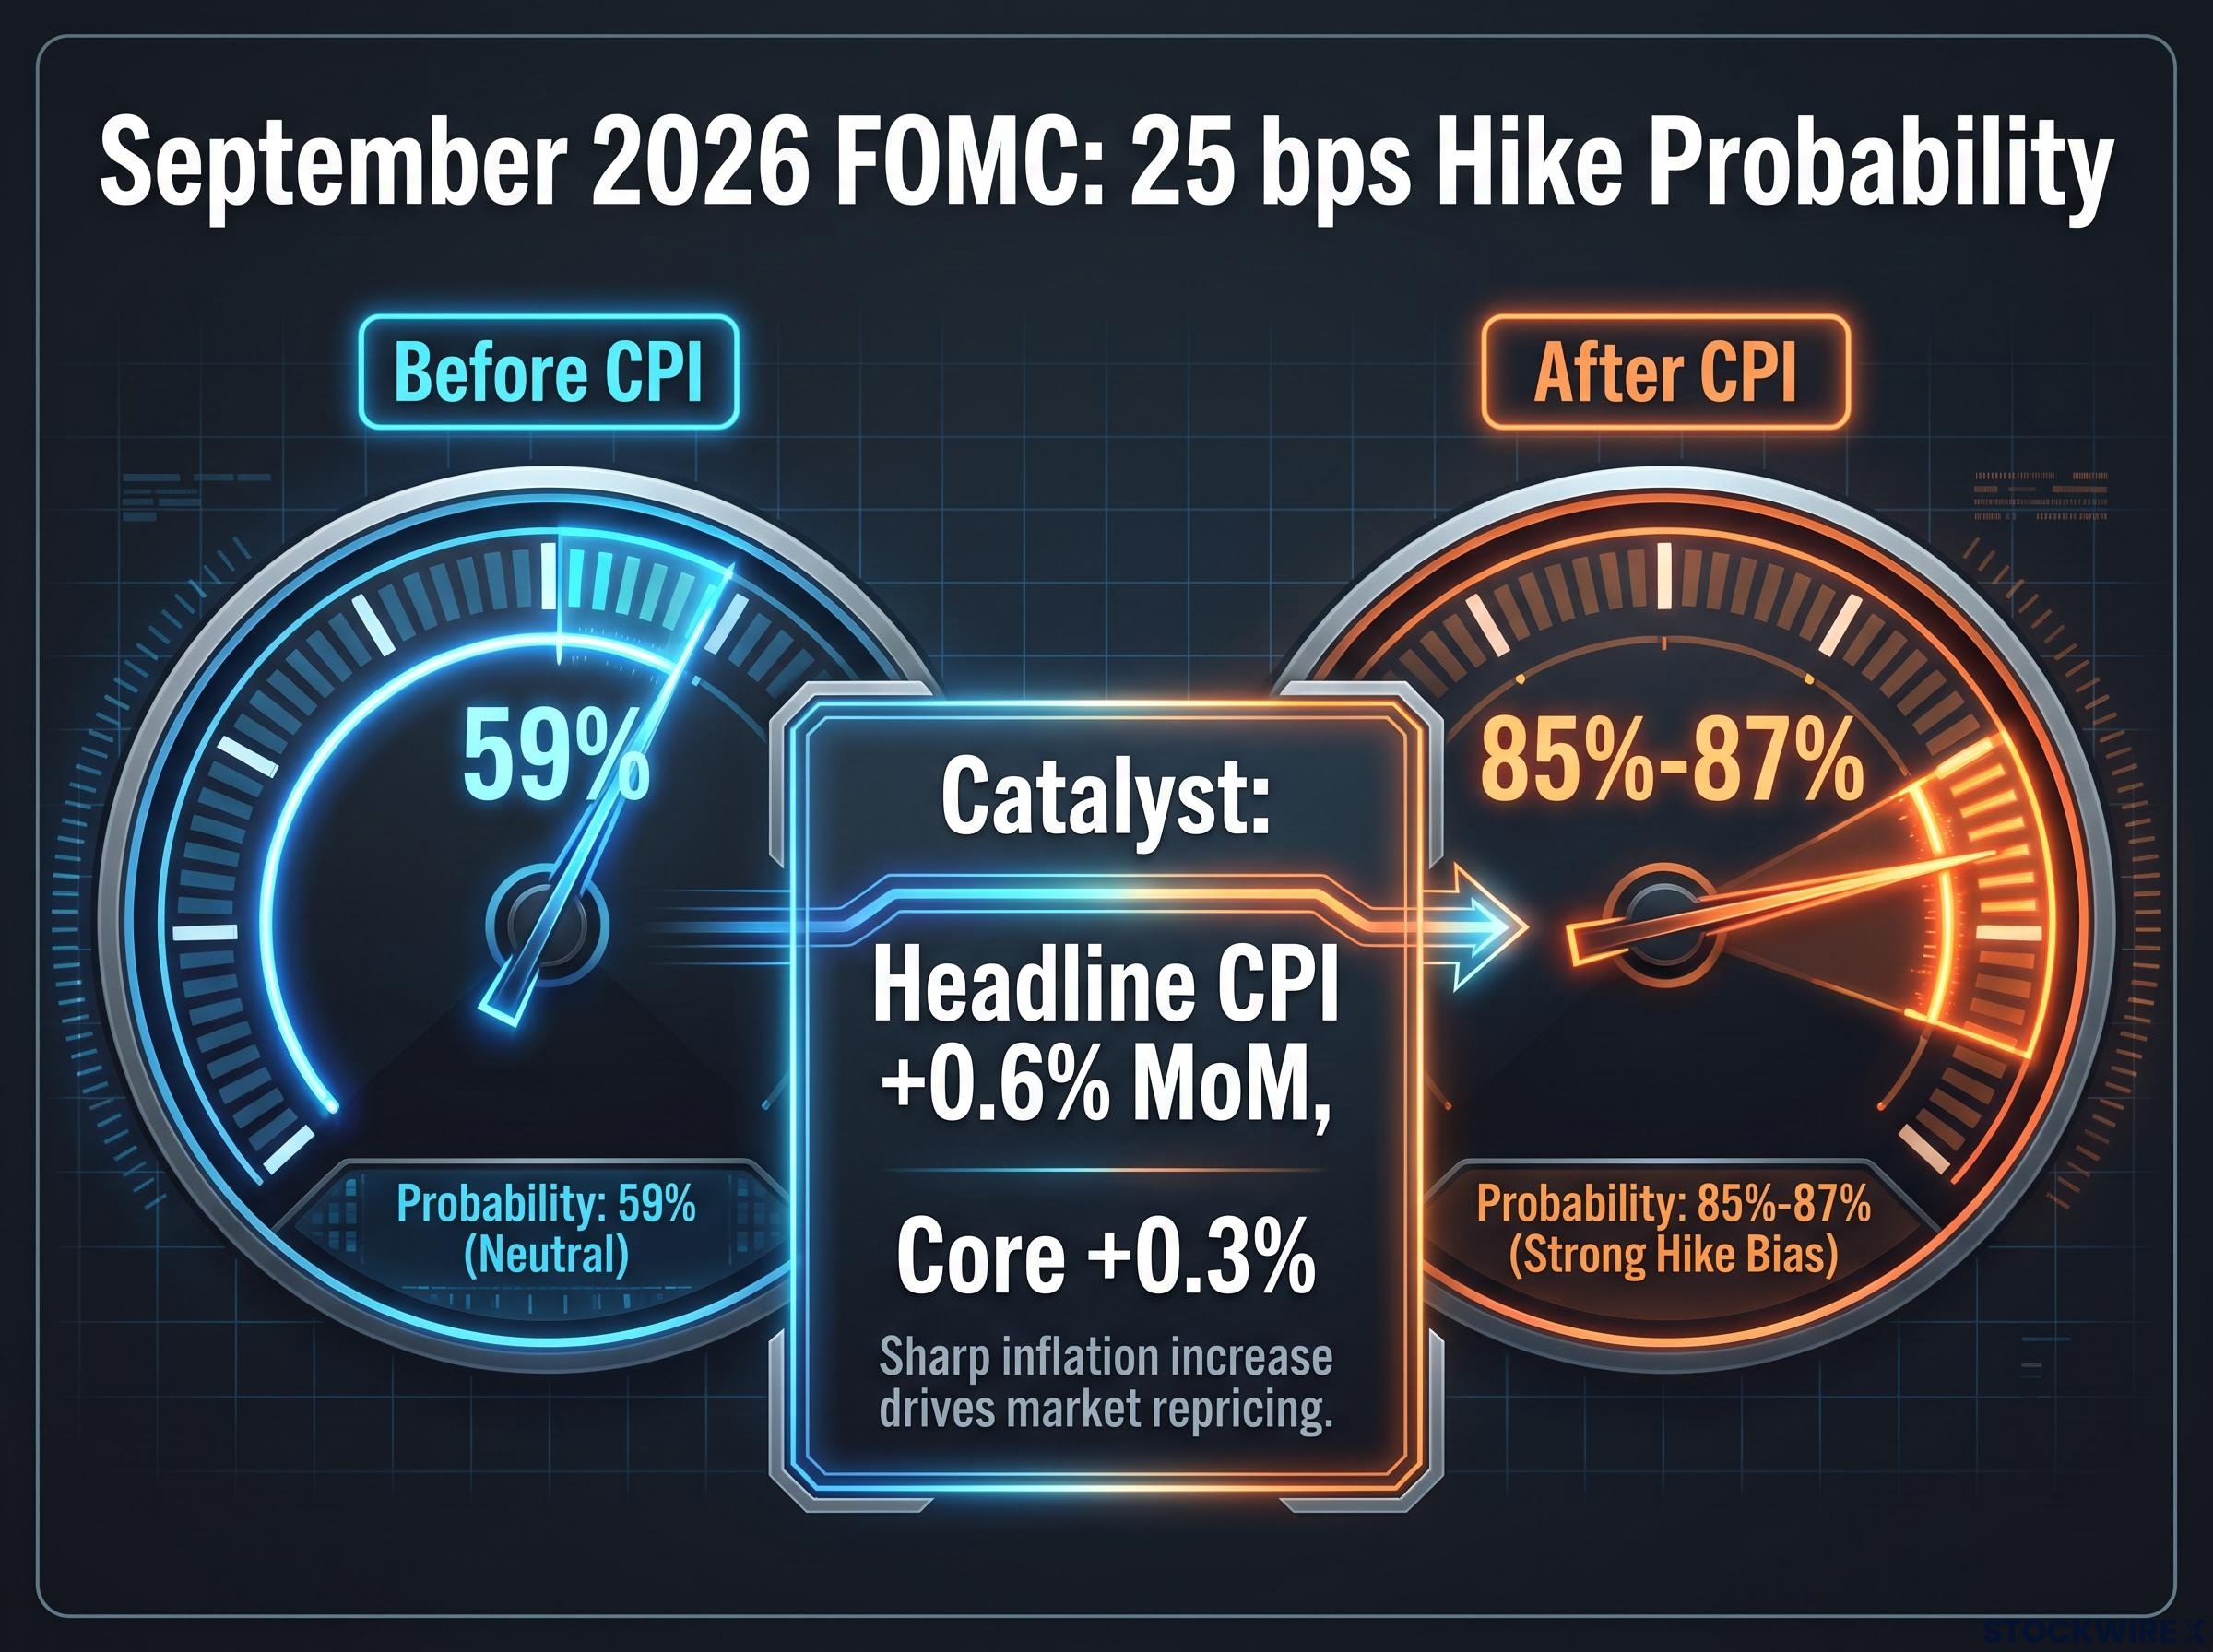
The live example makes this concrete. Heading into the September 2026 FOMC meeting, the funds target sits at 3.50%-3.75%, and CME FedWatch has shown roughly 85%-87% probability of a 25 basis point hike after August inflation came in warm (headline CPI +0.6% month-on-month, core CPI +0.3%, both at or above consensus).
What is striking is the speed. That probability jumped from 59% to around 85%-87% in a single week following the CPI release. That tells you macro data and Fed communications can reprice the Dollar faster than any chart pattern, which means watching the economic calendar is not optional for anyone holding USD exposure.
QE and QT: how the Federal Reserve’s balance sheet moves the US Dollar
Rates are only one lever. The other is the size of the Fed’s balance sheet, and it works through a different channel.
Quantitative easing (QE) is when the Fed buys long-term Treasury and agency securities, expanding its balance sheet. This pushes down longer-term yields and nudges investors toward riskier or foreign assets in search of return. The standard effect is Dollar-negative: by shrinking the yield advantage of USD assets and lifting global risk appetite, QE tends to weigh on the Dollar.
Quantitative tightening (QT) is the reverse. The Fed stops reinvesting maturing holdings, or sells securities outright, shrinking the balance sheet. Dollar funding becomes scarcer, yields rise, and USD assets look more appealing. 2022 is the clearest recent illustration: aggressive hiking combined with balance-sheet runoff coincided with significant Dollar appreciation against the euro, the yen, and many emerging-market currencies. Strategists at Morgan Stanley and Goldman Sachs have argued this dynamic is strongest when QT runs alongside rate hikes, as it did through 2022-2023.
One important caveat: the size, pace, and communication of these programmes matter enormously. A well-telegraphed change may already be baked into prices, while an unexpected move can produce a sharp FX reaction.
| Policy Tool | Mechanism | Typical Dollar Impact | Key Exception |
|---|---|---|---|
| QE (standard) | Bond buying lowers long-term yields, pushes capital toward risk | Dollar-negative | Reverses in a crisis (see below) |
| QE (crisis) | Safe-haven demand for USD liquidity overwhelms yield effect | Dollar-positive | 2008-2009, early 2020 |
| QT (standard) | Balance-sheet runoff tightens dollar funding, lifts yields | Dollar-positive | 2022 appreciation |
| QT (pivot risk) | Markets read tightening as precursor to earlier easing | Dollar-neutral to negative | If QT triggers turbulence forcing a pivot |
When the standard rules reverse
The tidy “QE weakens, QT strengthens” rule breaks down at the moments that matter most.
During the acute stress of 2008-2009 and early 2020, the Fed launched aggressive QE, yet the Dollar strengthened. The reason: in a genuine crisis, investors scramble for USD liquidity and the safety of Treasuries, and that safe-haven demand overwhelms the yield-reduction logic entirely. The same tool produced the opposite outcome because the market regime changed.
QT can flip too. If markets read tightening as a sign the Fed will soon have to normalise toward lower rates, or if the runoff itself sparks turbulence that forces a pivot back to easing, QT can turn Dollar-neutral or even Dollar-negative.
The lesson for you is a conditional one, not a rule. The Dollar’s safe-haven function can override the standard yield mechanics whenever the market shifts from calm to crisis, so always ask which regime you are in before applying either rule.
Reading CME FedWatch: what the probability gauge tells you and what it hides
If you follow FX commentary, you have seen the CME FedWatch tool cited constantly, usually as though its percentages were a scoreboard. They are not. They are a real-time reading of sentiment, and treating them as certainty is a trap.
Mechanically, FedWatch derives its numbers from 30-Day Fed Funds futures prices. It translates where those futures are trading into discrete probabilities for each possible rate outcome at each upcoming FOMC meeting. When futures pricing moves, the probabilities move with it.
The September 2026 repricing shows the tool doing exactly what it is built to do. After August CPI surprised to the upside (headline +0.6% month-on-month, core +0.3%, above the prior 0.2% reading and consensus), the implied probability of a 25 basis point hike leapt from 59% to roughly 85%-87% in a week.
From 59% to 85%-87% in one week A single hotter-than-expected inflation print reset the market’s entire view of the September meeting. That is the tool’s responsiveness, and also its warning label.
Compare that to just a few months earlier. As of mid-June 2026, FedWatch showed approximately 97.1% probability of no change at the 17 June 2026 meeting. In two to three months, the probability landscape went from near-certain hold to near-certain hike. Anyone treating June’s 97.1% as a fixed truth would have been badly wrong-footed.
The limitations are worth holding onto:
FedWatch futures probabilities and the Fed’s own dot plot vs market pricing can diverge sharply at exactly the moments that matter most; the June 2026 SEP showed a near-even split among FOMC participants on further hikes, while futures simultaneously priced a 72.6% probability of rates rising above the current range by mid-2027.
- Hedging and liquidity distortions. Fed Funds futures prices can be nudged by hedging flows and term-premia effects, so the implied probabilities can overstate genuine confidence in an outcome.
- Overconfidence at high readings. A 95%-plus probability invites complacency. Traders can take heavy losses when the small residual outcome lands.
- Meeting-by-meeting blind spots. The tool gives probabilities one meeting at a time, which can obscure path-dependent scenarios such as a run of rapid cuts later in the cycle.
- History humbles it. The residual 13%-15% has materialised at critical moments, as around the 2019 mid-cycle adjustment and various emergency crisis cuts.
The read you should take is this: FedWatch is a sentiment gauge, not a forecast. A high reading tells you where the crowd is positioned, and crowded positioning is exactly what unwinds sharply when the next data point surprises.
For readers wanting to understand how the current communication regime differs from prior Fed cycles, our full explainer on Warsh’s forward guidance overhaul covers the specific institutional changes, including the withheld dot plot and five internal task forces, that have made every FOMC meeting genuinely live for currency and rate markets.
What DXY technical indicators reveal about near-term Dollar momentum
Macro tells you the direction. Technicals tell you whether the market has actually committed to it yet. That is why they work as a second layer of evidence rather than a standalone system.
The standard gauge here is the DXY, the Dollar Index, which measures the Dollar against a basket of major currencies. Traders use it as a proxy for broad Dollar direction rather than tracking a dozen individual pairs.
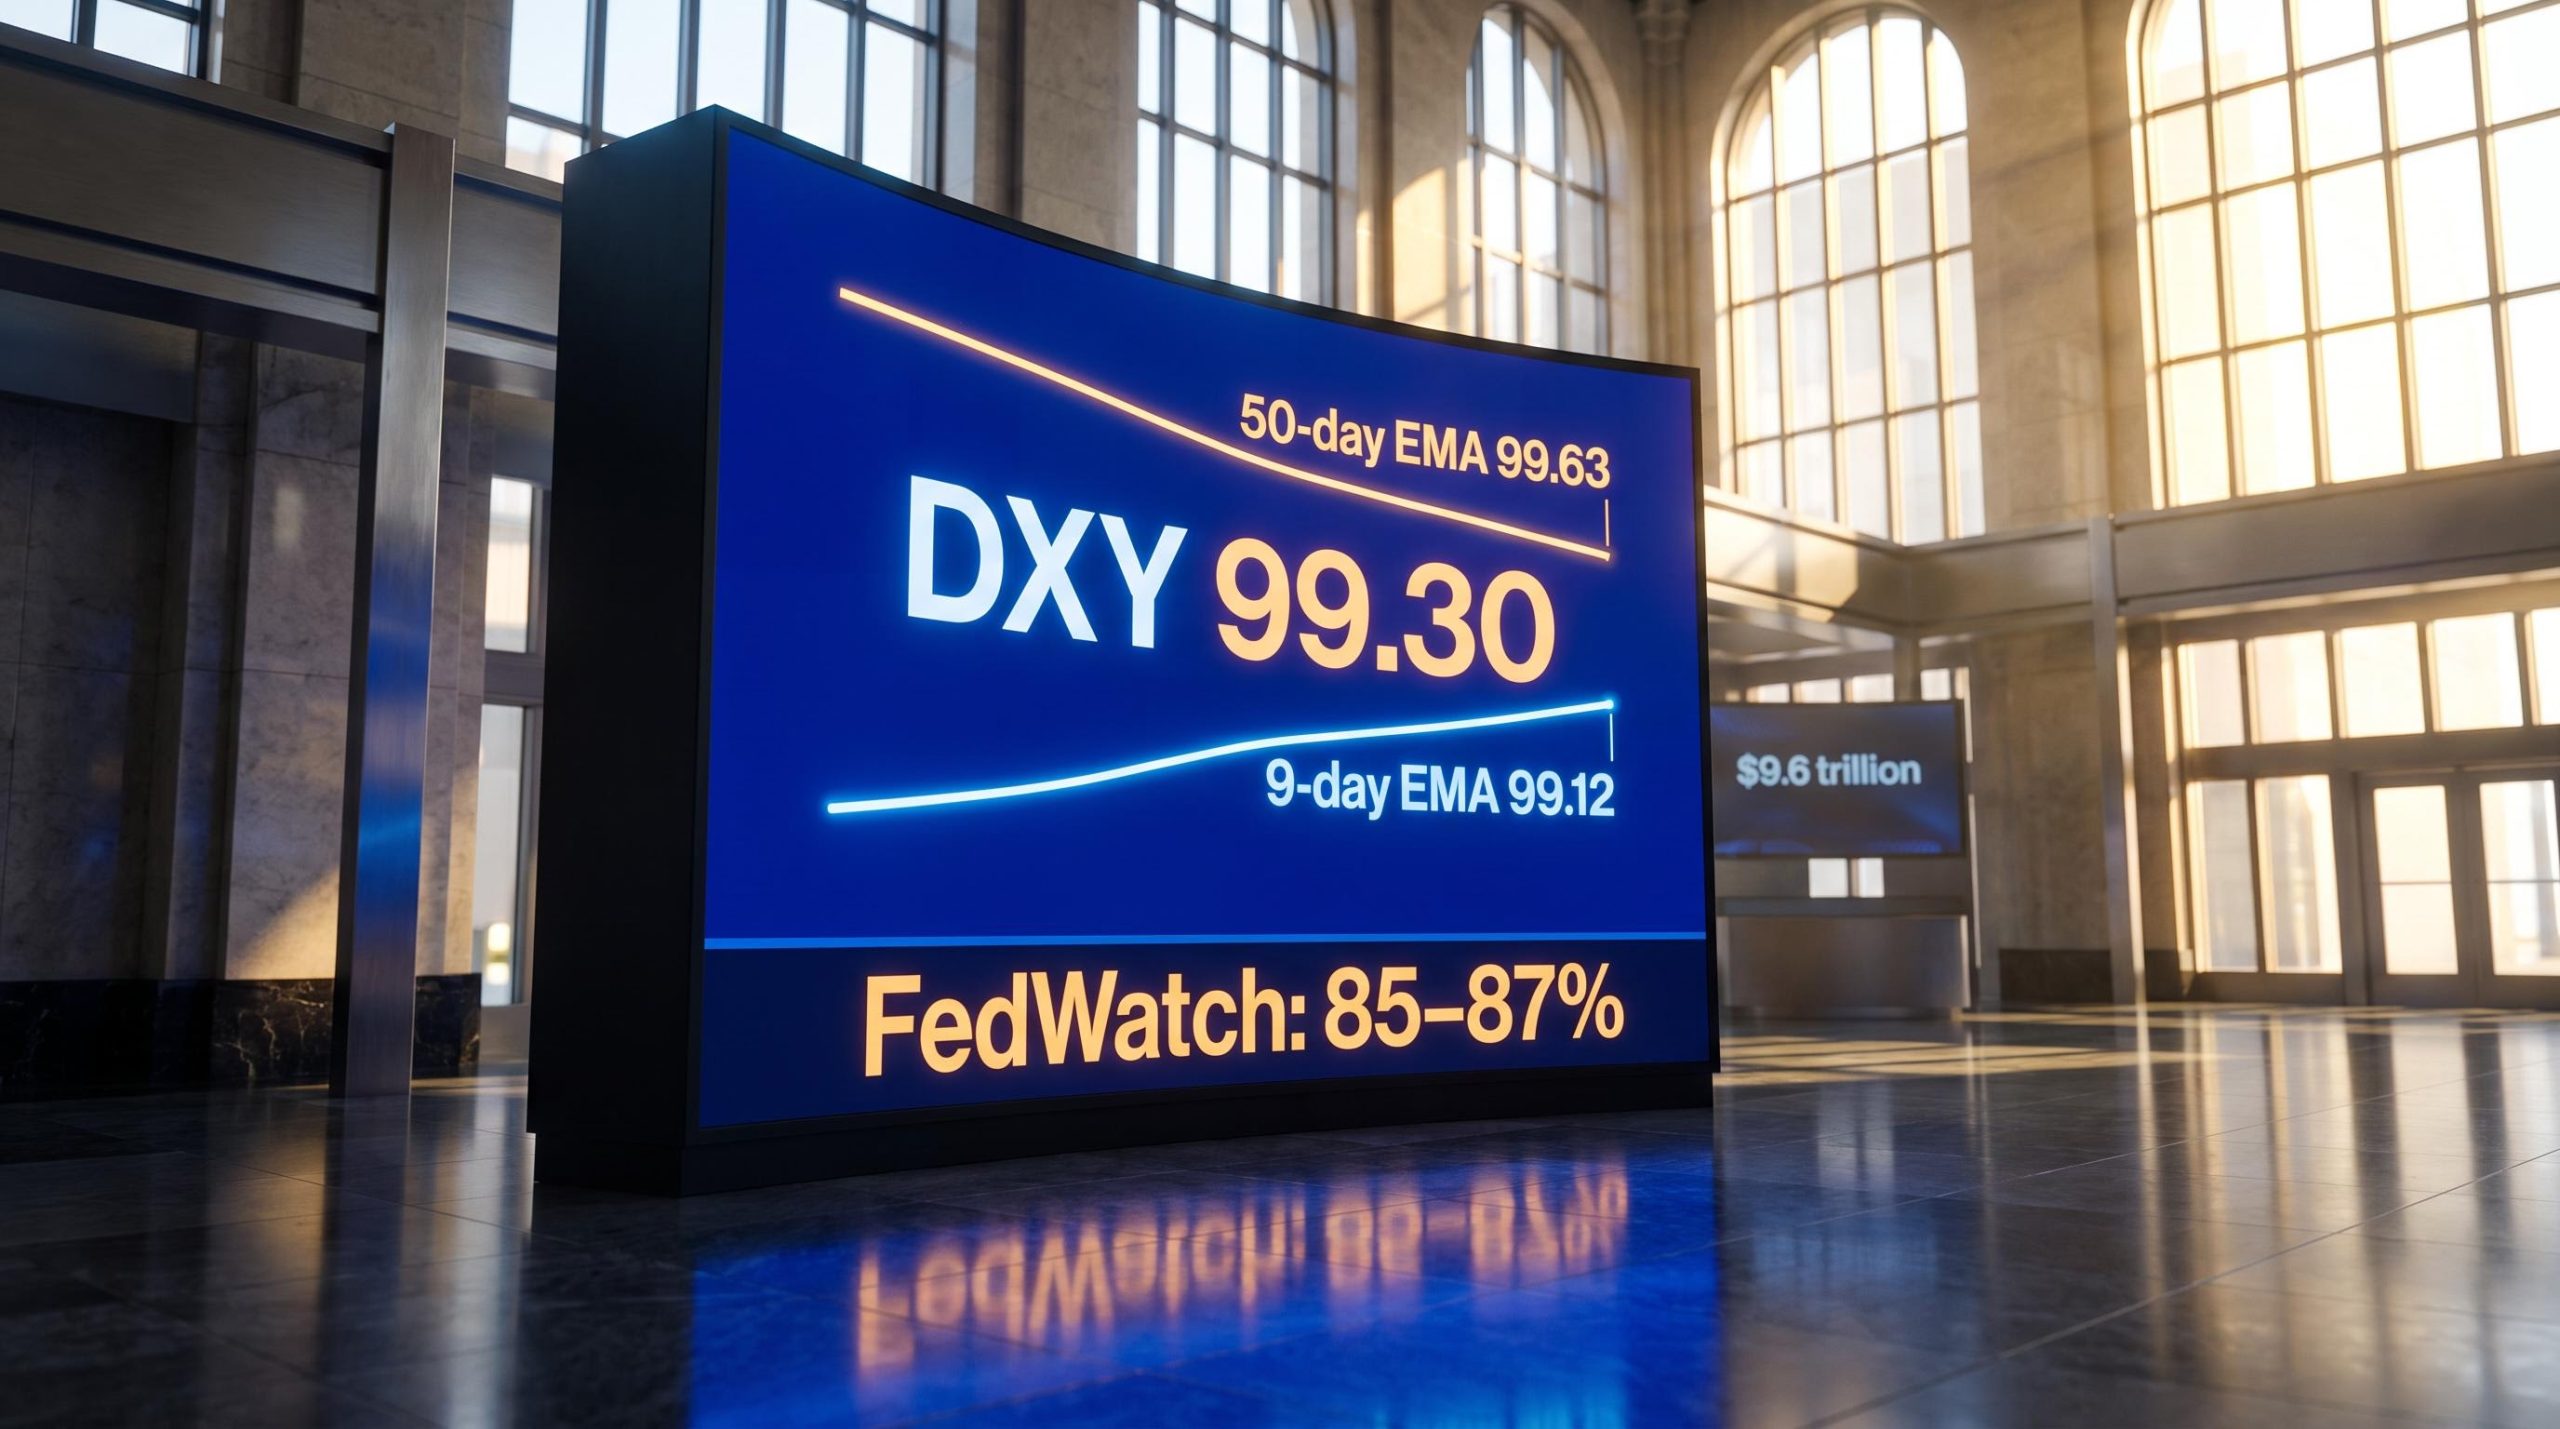
In mid-September 2026, the picture was one of indecision. According to FXStreet technical analysis (disclosed as AI-assisted), the DXY was trading near 99.30 during Asian hours, sitting below its 50-day exponential moving average (EMA) of 99.63 and above its 9-day EMA of 99.12. The 14-day relative strength index (RSI), a momentum gauge that runs from 0 to 100 with 50 as the neutral midpoint, read 48.04, just under neutral.
| Indicator | Current Reading | Signal Interpretation |
|---|---|---|
| DXY Spot | 99.30 | Neutral zone, between key EMAs |
| 50-day EMA | 99.63 | Overhead resistance; a sustained break above lifts the downward bias |
| 9-day EMA | 99.12 | Near-term support; a daily close below reinforces bearish momentum |
| 14-day RSI | 48.04 | Muted momentum, just below the neutral 50 line |
Before you act on any of this, understand where these tools reliably mislead:
- EMAs lag. They are trend-following by design, so they whipsaw traders in choppy, range-bound markets and can fail when fresh news snaps the trend around.
- RSI overstays its welcome. In a strong trend, RSI can sit overbought or oversold for weeks, so selling purely because a threshold is breached has historically meant missing sustained rallies.
- Signals conflict. A bullish moving-average structure can sit alongside a bearish RSI divergence, leaving the trader no clean answer.
- Regime matters. Tools calibrated in low-volatility, QE-dominated conditions often perform poorly in high-volatility, QT-driven markets.
What the readings tell you here is telling in its restraint. With the DXY below its 50-day EMA and RSI at 48.04, the Dollar sat in a technically undecided zone, which is precisely when the macro catalyst, the Fed decision, matters far more than any crossover. Technicals are context, not the call.
DXY resistance clusters at levels such as the 20-EMA and key Fibonacci retracements carry a structural logic that single data beats cannot displace; the September 2026 PPI episode, where DXY stalled at 99.27 despite a hotter-than-expected print, illustrates precisely why price confirmation at resistance matters more than the macro headline alone.
Putting it together: how to read a Fed decision week as a Dollar trader
You now have five moving parts. The value comes from running them in sequence, not in isolation. Here is the framework to apply the next time an FOMC meeting approaches.
- Assess the rate differential and the FedWatch shift. What is the market pricing, how far has the probability moved, and what data drove the move? This sets the directional bias.
- Identify the balance-sheet regime. Are you in QE or QT, and is the market calm or in crisis? This tells you whether the standard rules apply or whether the safe-haven exception is in play.
- Check the DXY technical positioning. Where is the index relative to its key EMAs, and what is RSI signalling about momentum versus conviction? This confirms or complicates the macro read.
Each layer answers a different question. Macro policy sets the bias, FedWatch quantifies how confident the crowd is in that bias, and technicals show where short-term traders sit and whether momentum has committed.
Run the September 2026 week through the framework and the tension becomes visible. The macro case for a hike had strengthened fast (FedWatch 59% to 85%-87%), yet the DXY at 99.30 remained below its 50-day EMA of 99.63, with RSI at 48.04 signalling the market had not yet committed to a breakout. Tailwinds building, confirmation lacking, a market watchful but not decided. A good framework surfaces that tension rather than flattening it into a binary call.
A thinking tool, not a formula Economist Barry Eichengreen cautions against assuming a mechanical, one-directional link between rate hikes and Dollar appreciation. Treat this framework as a way to think, not a switch to flip.
One final point of scale. Because the Dollar underpins nearly nine-tenths of global FX trading, a Fed decision reaches far beyond the USD pairs on your screen, into commodity prices, emerging-market debt servicing costs, and global financial conditions at large.
This article is for informational purposes only and should not be considered financial advice. Investors should conduct their own research and consult with financial professionals before making investment decisions. Past performance does not guarantee future results, and financial projections are subject to market conditions and various risk factors.