Here is the paradox at the centre of the dollar’s current predicament: the military spending meant to project American power abroad is financed by the very debt that quietly erodes the currency’s global standing.
Two pressures are converging as of September 2026. The federal debt load has crossed roughly $40 trillion, while a six-month-old US-Iran conflict has already outlived one failed ceasefire and slid back into active strikes. The 30-year Treasury yield is climbing toward 5.3%, and bond markets rarely reach that level without pricing in something they see coming.
These are not two separate stories. They compound, and understanding how requires more than a bullish or bearish verdict on the dollar. What follows here is a framework for reading the signals that matter, and what the historical record says about how slowly reserve currency status actually shifts. The tools matter more than the prediction.
The debt math that bond markets are starting to price in
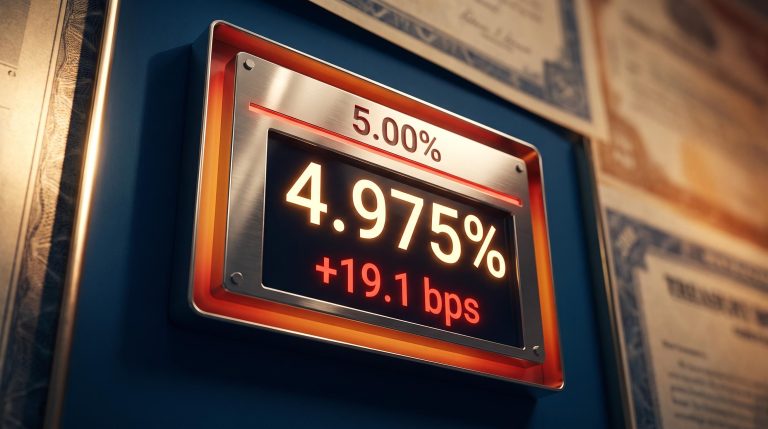
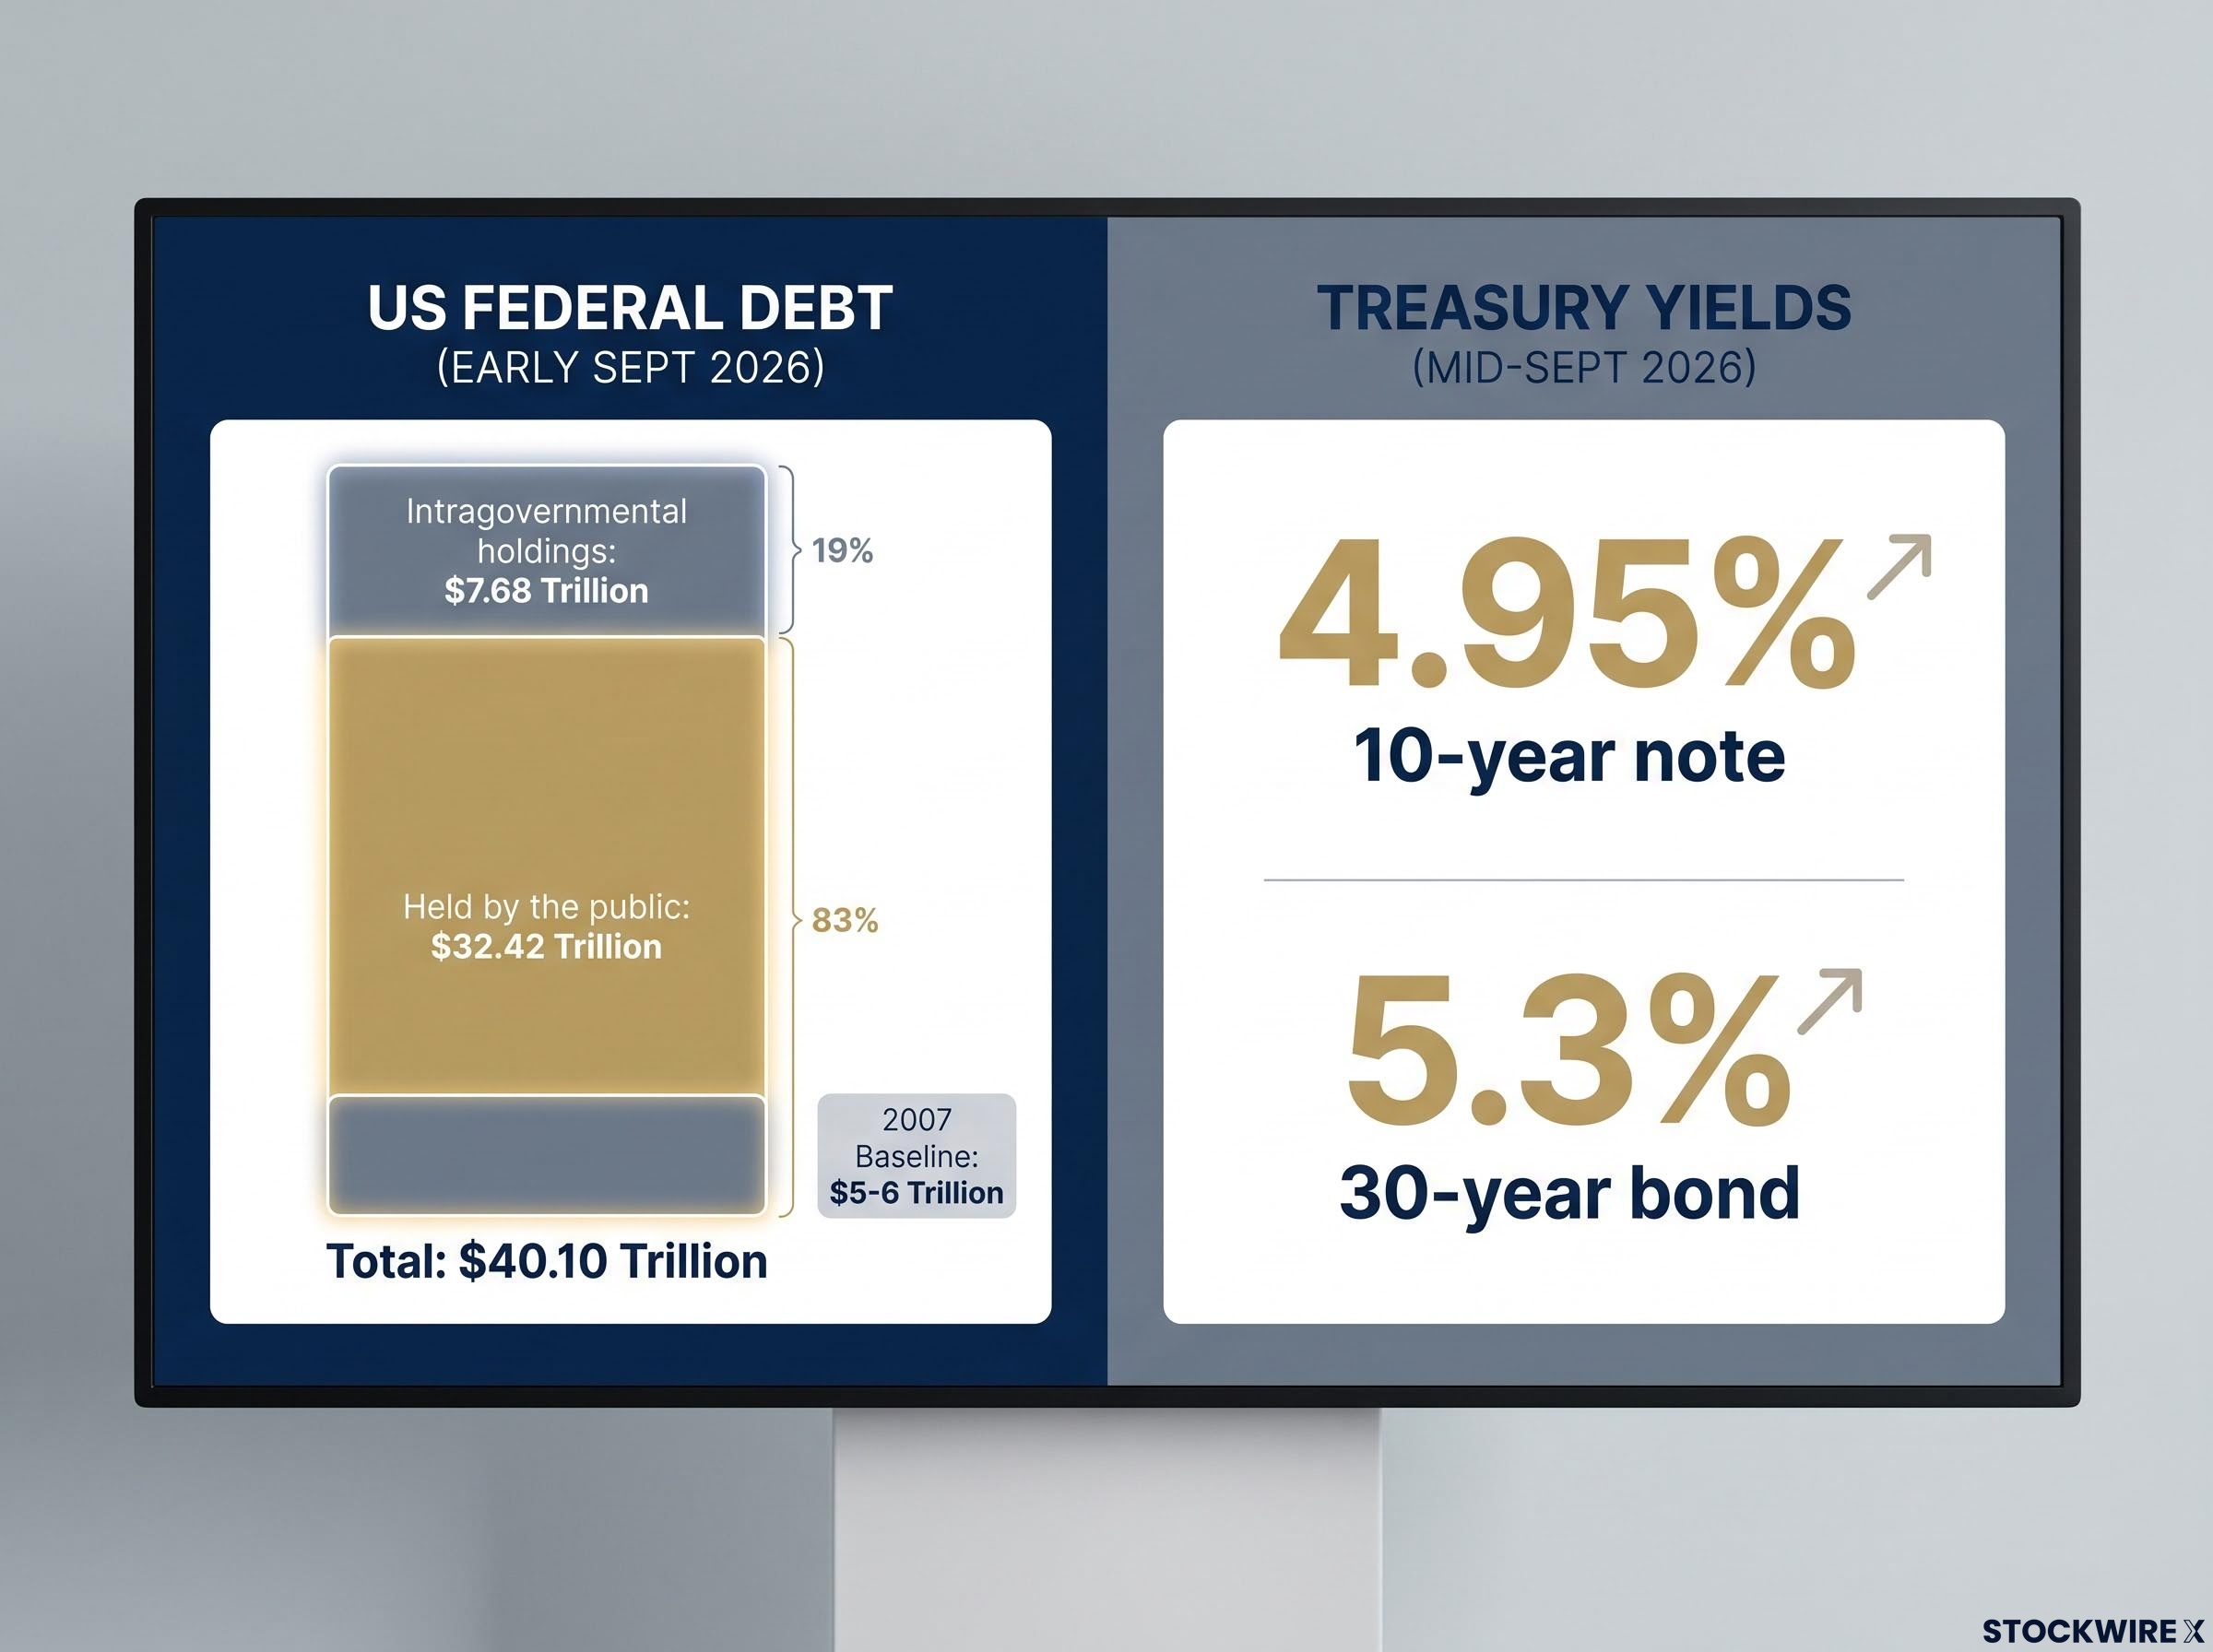
Treasury yields are doing the arguing that the political debate has not yet caught up to. The 10-year note sits near 4.95% and the 30-year bond around 5.3% as of mid-September 2026. Those are not abstract statistics. They are a market verdict on how much compensation lenders now demand to hold US government debt.
The debt they are pricing has scaled to a level that reshapes the risk calculation entirely.
- Total federal debt: approximately $40.10 trillion as of early September 2026 (drawn from Treasury tracking data, not independently confirmed)
- Held by the public: $32.42 trillion
- Intragovernmental holdings: $7.68 trillion
That total stands against a baseline of roughly $5-6 trillion in 2007. When a borrower carries this much, lenders behave predictably: they charge more.
The $40 trillion gross figure earns the headline, but publicly held debt of approximately $32.3 trillion is the number bond markets actually trade against, because only that portion requires ongoing external demand and carries direct rollover risk at auction.
What rising yields actually signal about fiscal credibility
The mechanism is straightforward. Heavier debt loads have historically produced higher yield demands, because the lender is compensating for elevated risk. The clearest evidence of this dynamic came with the Treasury’s recent move to expand its long-end buyback programme to about $6 billion.
Peter Schiff describes that figure as negligible against a $40 trillion total, reading it as the government signalling its priorities rather than deleveraging in any real sense. The bond market’s response was more telling than the stated rationale: yields rose immediately after the announcement.
Schiff projects the trajectory could run considerably further.
Schiff argues the 10-year Treasury yield could eventually reach 6%, 7%, or even 8% as fiscal and geopolitical stresses mount.
Here is what that would mean for you as a reader assessing US exposure. Interest costs are already surpassing or matching defence outlays. When servicing the debt costs more than defending the country, the fiscal room for everything else, including the military projection that underpins reserve status, begins to close. The yield curve is not noise. It is structural repricing in motion.
When big ASX news breaks, our subscribers know first
How the Iran conflict became a fiscal accelerant, not a strategic shield
There is a credible case that the war protects the dollar. Some market commentators argue US military projection in the Middle East is designed to preserve petrodollar infrastructure and reinforce the dollar’s safe-haven status. Academic research supports part of this: a credible US security umbrella can lift global demand for dollar assets, meaning geopolitical stress may raise yields and strengthen the dollar simultaneously during a crisis.
The fiscal arithmetic complicates that case considerably.
| Dimension | Strategic case | Fiscal counter-case |
|---|---|---|
| Dollar demand | Security umbrella supports safe-haven flows into dollar assets | War outlays widen deficits, raising the risk premium on those same assets |
| Petrodollar | Military presence preserves dollar-based oil pricing infrastructure | Indecisive outcome erodes the credibility the petrodollar rests on |
| Yields | Crisis demand can pull safe-haven yields lower | War-funding expectations have driven long-bond selling and higher yields |
The numbers behind the counter-case are substantial. Reports from March 2026 indicated the Pentagon was seeking more than $200 billion in supplemental funding for the Iran conflict, on top of a roughly $900 billion FY2026 defence bill.
Projections suggest that adding large war outlays could push the US deficit toward 8% of GDP or higher.
The conflict itself has not delivered the strategic payoff that might justify the cost. It began on 28 February 2026 with US and Israeli strikes on Iranian nuclear and military infrastructure. A Pakistan-mediated ceasefire in June 2026 produced a 60-day cessation and reopened the Strait of Hormuz, but the truce was effectively over by mid-July. The US resumed strikes and a naval blockade, Iran retaliated against US bases, and no formal peace talks are underway as of early September 2026.
Schiff’s core argument follows from this. Military spending adds directly to deficits, and a conflict this indecisive undermines credibility without buying the security benefit that would stabilise dollar demand.
For you, the relevant question is not whether the war was justified. It is whether the fiscal cost of an unresolved conflict is being priced into Treasury markets faster than any security benefit can offset it. Right now, the yields suggest it is.
What de-dollarization actually looks like in the data (and what it does not)
The honest reading sits between catastrophe and complacency. The dollar’s share of global foreign exchange (FX) reserves has drifted down to around 59%, according to the International Monetary Fund (IMF). That is a gradual decline driven by active diversification, partly into the renminbi and smaller nontraditional currencies, not a collapse.
Exchange-rate valuation effects account for a portion of the measured decline in dollar reserve share, meaning part of the movement from roughly 72% to 59% reflects the mechanical rise in non-dollar asset values rather than active portfolio decisions by central banks.
The payment infrastructure tells the same measured story.
| Indicator | Current figure | Directional trend |
|---|---|---|
| Global FX reserve share | ~59% | Gradual decline |
| SWIFT payment share | ~50.5% (December 2025) | Broadly stable |
| Petrodollar pricing | Dollar-based system dominant | Highly resilient |
The dollar still handled about 50.5% of SWIFT payment messages in December 2025. Yuan-based oil settlements are growing, but analysts conclude the dollar-based oil pricing and recycling system remains highly resilient, and a full de-dollarization of the oil trade looks unlikely in the near term.
History adds a further caution. Research from the Bank for International Settlements (BIS) and the Centre for Economic Policy Research (CEPR) describes recurring “dollarisation waves,” noting the dollar’s reserve share fell to roughly 43% in 2008 before rebounding. Any single downcycle, on its own, is a weak basis for declaring structural decline.
The de-dollarization research from City University documents how dollar reserve share erosion tends to follow fiscal credibility shocks rather than precede them, a sequencing that matters when reading the current convergence of yield pressure and war spending as a combined signal rather than two separate concerns.
Why there is no ready substitute waiting in the wings
A reserve currency needs four things at once: scale, convertibility, deep and liquid markets, and legal protections on the assets held in it. That combination is rare, and it is why the dollar persists.
Economist Eswar Prasad, along with institutions including JPMorgan and State Street, emphasise that dollar dominance rests on exactly these structural advantages and the absence of a credible alternative. Neither the euro, the renminbi, nor any BRICS currency initiative currently clears all four thresholds.
So the read you should take is calibrated. De-dollarization is real, visible in the data, and slow enough to be a long-horizon risk rather than an imminent rupture. The 2008 precedent specifically warns against mistaking one cycle for the end of the story.
Central bank gold buying as a leading indicator, not a lagging hedge
Start with the volumes, because they earn the interpretation. The World Gold Council (WGC) estimates net central bank gold purchases reached 863 tonnes in 2025, with 230 tonnes bought in Q4. Buying then accelerated: 244 tonnes in Q1 2026 and a record 288.9 tonnes in Q2, a 62% year-on-year increase from Q2 2025.
Those flows have produced a milestone worth pausing on.
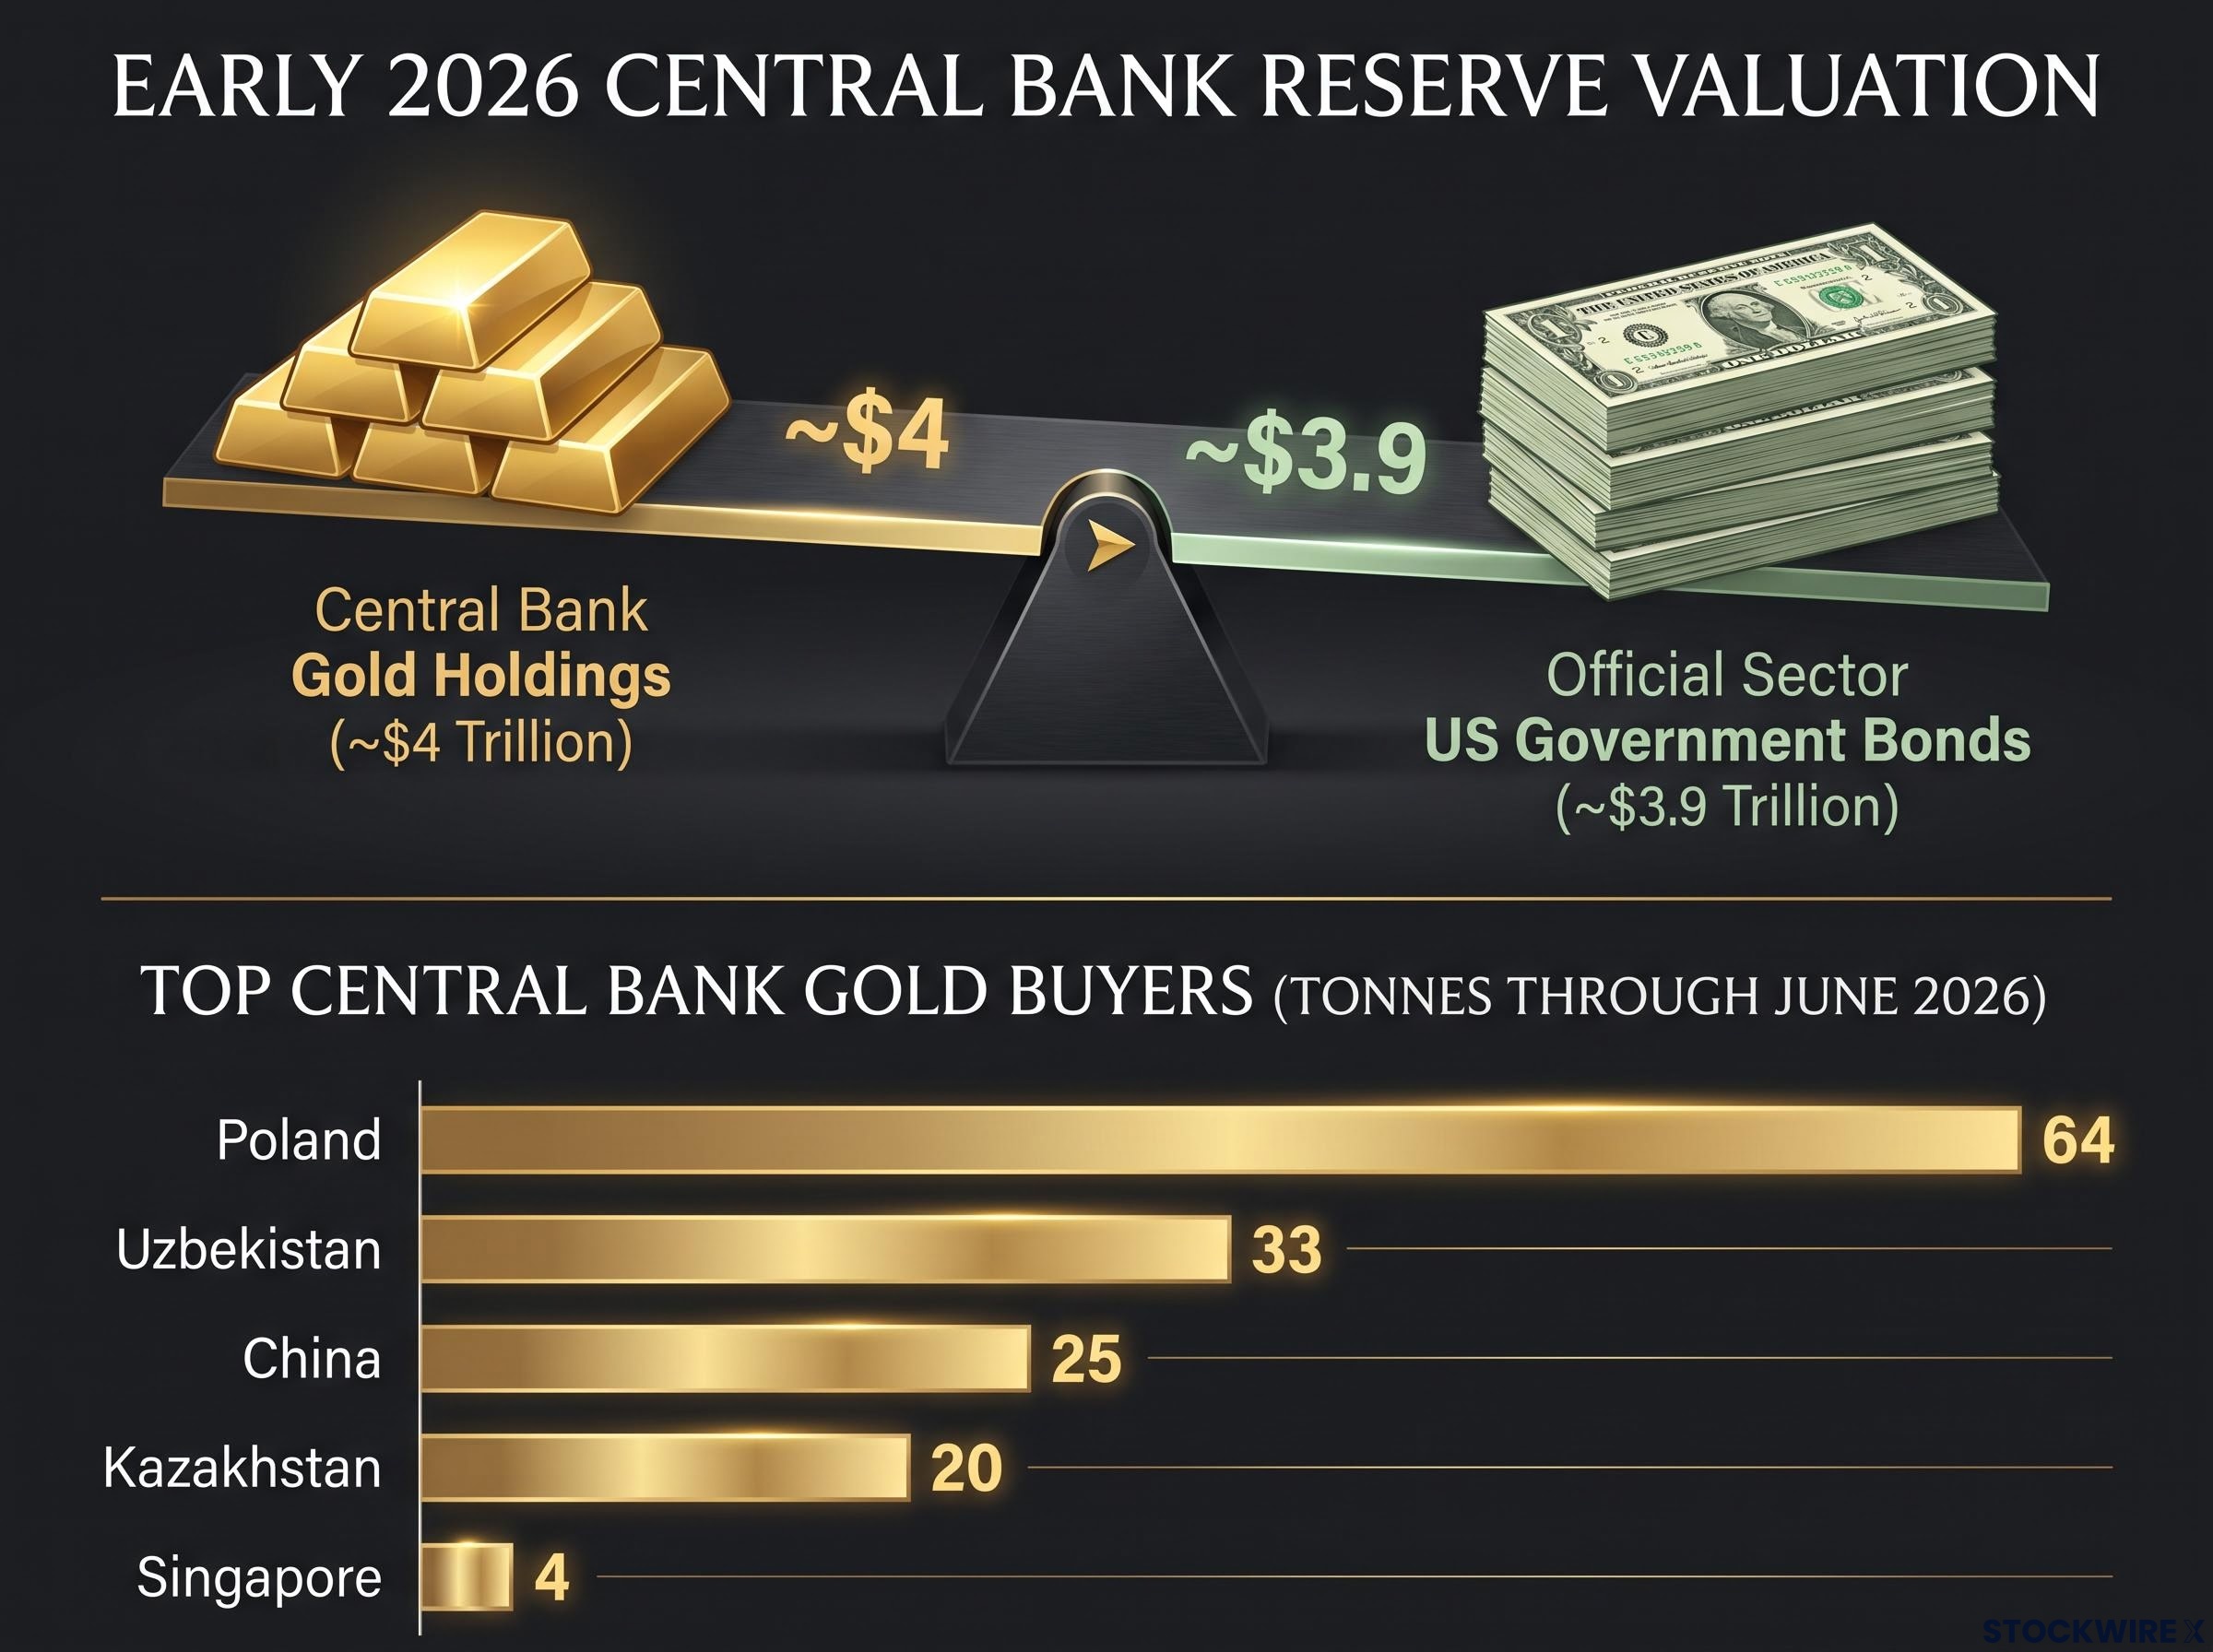
By early 2026, total central bank gold holdings were valued at around $4 trillion, slightly exceeding the roughly $3.9 trillion held by official sectors in US government bonds.
The buyers matter as much as the tonnage. The accumulation is concentrated outside the dollar bloc.
The primary motivation behind sovereign gold accumulation is jurisdictional safety, not price appreciation: physically vaulted gold cannot be frozen, sanctioned, or restricted by a foreign government’s political decisions, a risk that shifted from theoretical to demonstrated when approximately $300 billion in Russian reserves were frozen in 2022.
| Country | Tonnes (through June 2026) | Directional implication |
|---|---|---|
| Poland | 64 | Diversifying away from dollar assets |
| Uzbekistan | 33 | Reducing relative dollar exposure |
| China | 25 | Sustained reserve diversification |
| Kazakhstan | 20 | Building non-dollar reserves |
| Singapore | 4 | Modest diversification |
One caveat keeps the interpretation honest. No confirmed physical repatriation of gold reserves by China, Russia, or Gulf states has surfaced for 2025-2026, which limits how far the signal can be pushed. Schiff also observes that gold has not returned to its peak levels from when the war began, so this is not a straightforward price story.
Here is what the crossover means for you. When central bank gold holdings collectively exceed official holdings of US government bonds for the first time, that is institutional actors voting with their balance sheets, not merely expressing a theoretical preference. The durable signal is not the gold price. It is the allocation shift beneath it.
What the fall of sterling teaches us about how slowly reserve currency status actually moves
The historical record cools the pace of anxiety without dismissing the concern. The British pound lost its reserve status over the first half of the 20th century, worn down by high inflation, repeated devaluations, massive war costs, and the relative rise of the US economy. The dollar first overtook sterling as the leading reserve currency in the mid-1920s, yet sterling remained widely held for decades afterwards.
Historical surveys of the Bretton Woods system suggest transitions require three conditions to align.
- Domestic mismanagement of fiscal and monetary policy. The US arguably demonstrates this now, given the debt trajectory.
- The rise of a comparably large alternative. No current contender clears the bar, as the de-dollarization data shows.
- A major geopolitical shift that reorders global financial relationships. Not clearly present today.
The US currently meets the first condition but not obviously the second or third. That is the crucial distinction between early-phase signals and late-stage rupture.
The IMF notes that current movements toward gold and nontraditional currencies resemble the early phases of past reserve transitions.
The takeaway for your own timeframe is specific. The appropriate horizon for reserve currency risk is a decade or longer, and the present signals are worth monitoring precisely because they are early rather than terminal. Early phases are when course correction remains possible.
The compounding logic: what happens when fiscal and geopolitical pressure reinforce each other
Traced separately, the threads look manageable. Traced together, they form a single feedback loop. Higher yields raise borrowing costs, wider deficits require more bond issuance, and heavier issuance pressures yields further. War spending accelerates the deficits, and central bank gold buying is the institutional response to the whole cycle.
None of these is a standalone concern. They reinforce one another, and that is what separates a gradual erosion from an accelerating one.
Treasury safe-haven risk and dollar reserve-currency risk are related but distinct exposures; investors who conflate the two risk being under-hedged on long-bond volatility while simultaneously over-positioned against outright dollar displacement scenarios that current structural data does not support.
Three variables that will define the next phase
Watch these three signals rather than any single verdict.
- The 30-year Treasury yield. A sustained move above 5.3% would confirm the market is pricing deeper fiscal stress, not a temporary spike.
- The US midterm elections. The outcome serves as a proxy for fiscal will. A result that signals continued deficit expansion would tell you the political appetite for consolidation remains absent.
- The Iran conflict. Movement toward formal peace talks would ease the war-spending trajectory; continued blockade and strikes, with no talks underway as of early September 2026, keeps the fiscal accelerant running.
The actionable read is that the dollar’s reserve status is not binary. It is a spectrum of credibility, and current conditions are moving that credibility in one direction. For you, that should show up in how you think about duration risk in US bond exposure, where longer maturities carry the sharpest sensitivity to this trajectory.
The dollar is not losing its throne, but the cost of sitting in it is rising
The dollar retains structural dominance. It still commands roughly 59% of global FX reserves and about half of SWIFT payments, and no rival combines the scale, convertibility, and legal protections needed to replace it. That foundation is intact.
What the evidence now shows is that the fiscal and geopolitical pressures documented here are measurably raising the cost of that dominance, in yield terms and in credibility terms. The paradox the article opened with is no longer theoretical: spending meant to project dollar power is funded by the debt that most directly threatens it, and the market signals confirm it.
What changes the trajectory is fiscal consolidation, a decisive resolution to the Iran conflict, or the emergence of a genuine alternative. What preserves it is the dollar’s structural depth. Hold both in mind. The throne is secure, but the rent is going up.
This article is for informational purposes only and should not be considered financial advice. Investors should conduct their own research and consult with financial professionals before making investment decisions. Past performance does not guarantee future results. Financial projections are subject to market conditions and various risk factors, and forward-looking statements are speculative and subject to change based on market developments.