
Visa is one of the rare businesses that gets more valuable the more people use it. Every additional cardholder makes the network more useful to merchants, and every additional merchant makes it more useful to cardholders. Yet for investors holding it today, the biggest risk is not that this machine stops working. It is that the price already assumes it will keep working perfectly.
That distinction is the one most investors miss. Visa is not a consumer brand or a bank. It is the infrastructure layer sitting underneath global commerce, which makes it structurally different from almost every other equity you can buy.
The share price rose roughly 10% in the 12 months leading up to mid-2026. Over the same window, forward price-to-earnings (P/E) multiples compressed into the low 21x-22x range, below a five-year forward average of around 27x. That gap between a business getting stronger and a multiple getting cheaper is the tension worth resolving.
This piece gives you a working framework for deciding whether Visa is a position to hold, a stock to buy on dips, or a holding to trim, based on the specific signals that actually move the decision rather than the headline ones that do not.
Why Visa’s network is nearly impossible to replicate
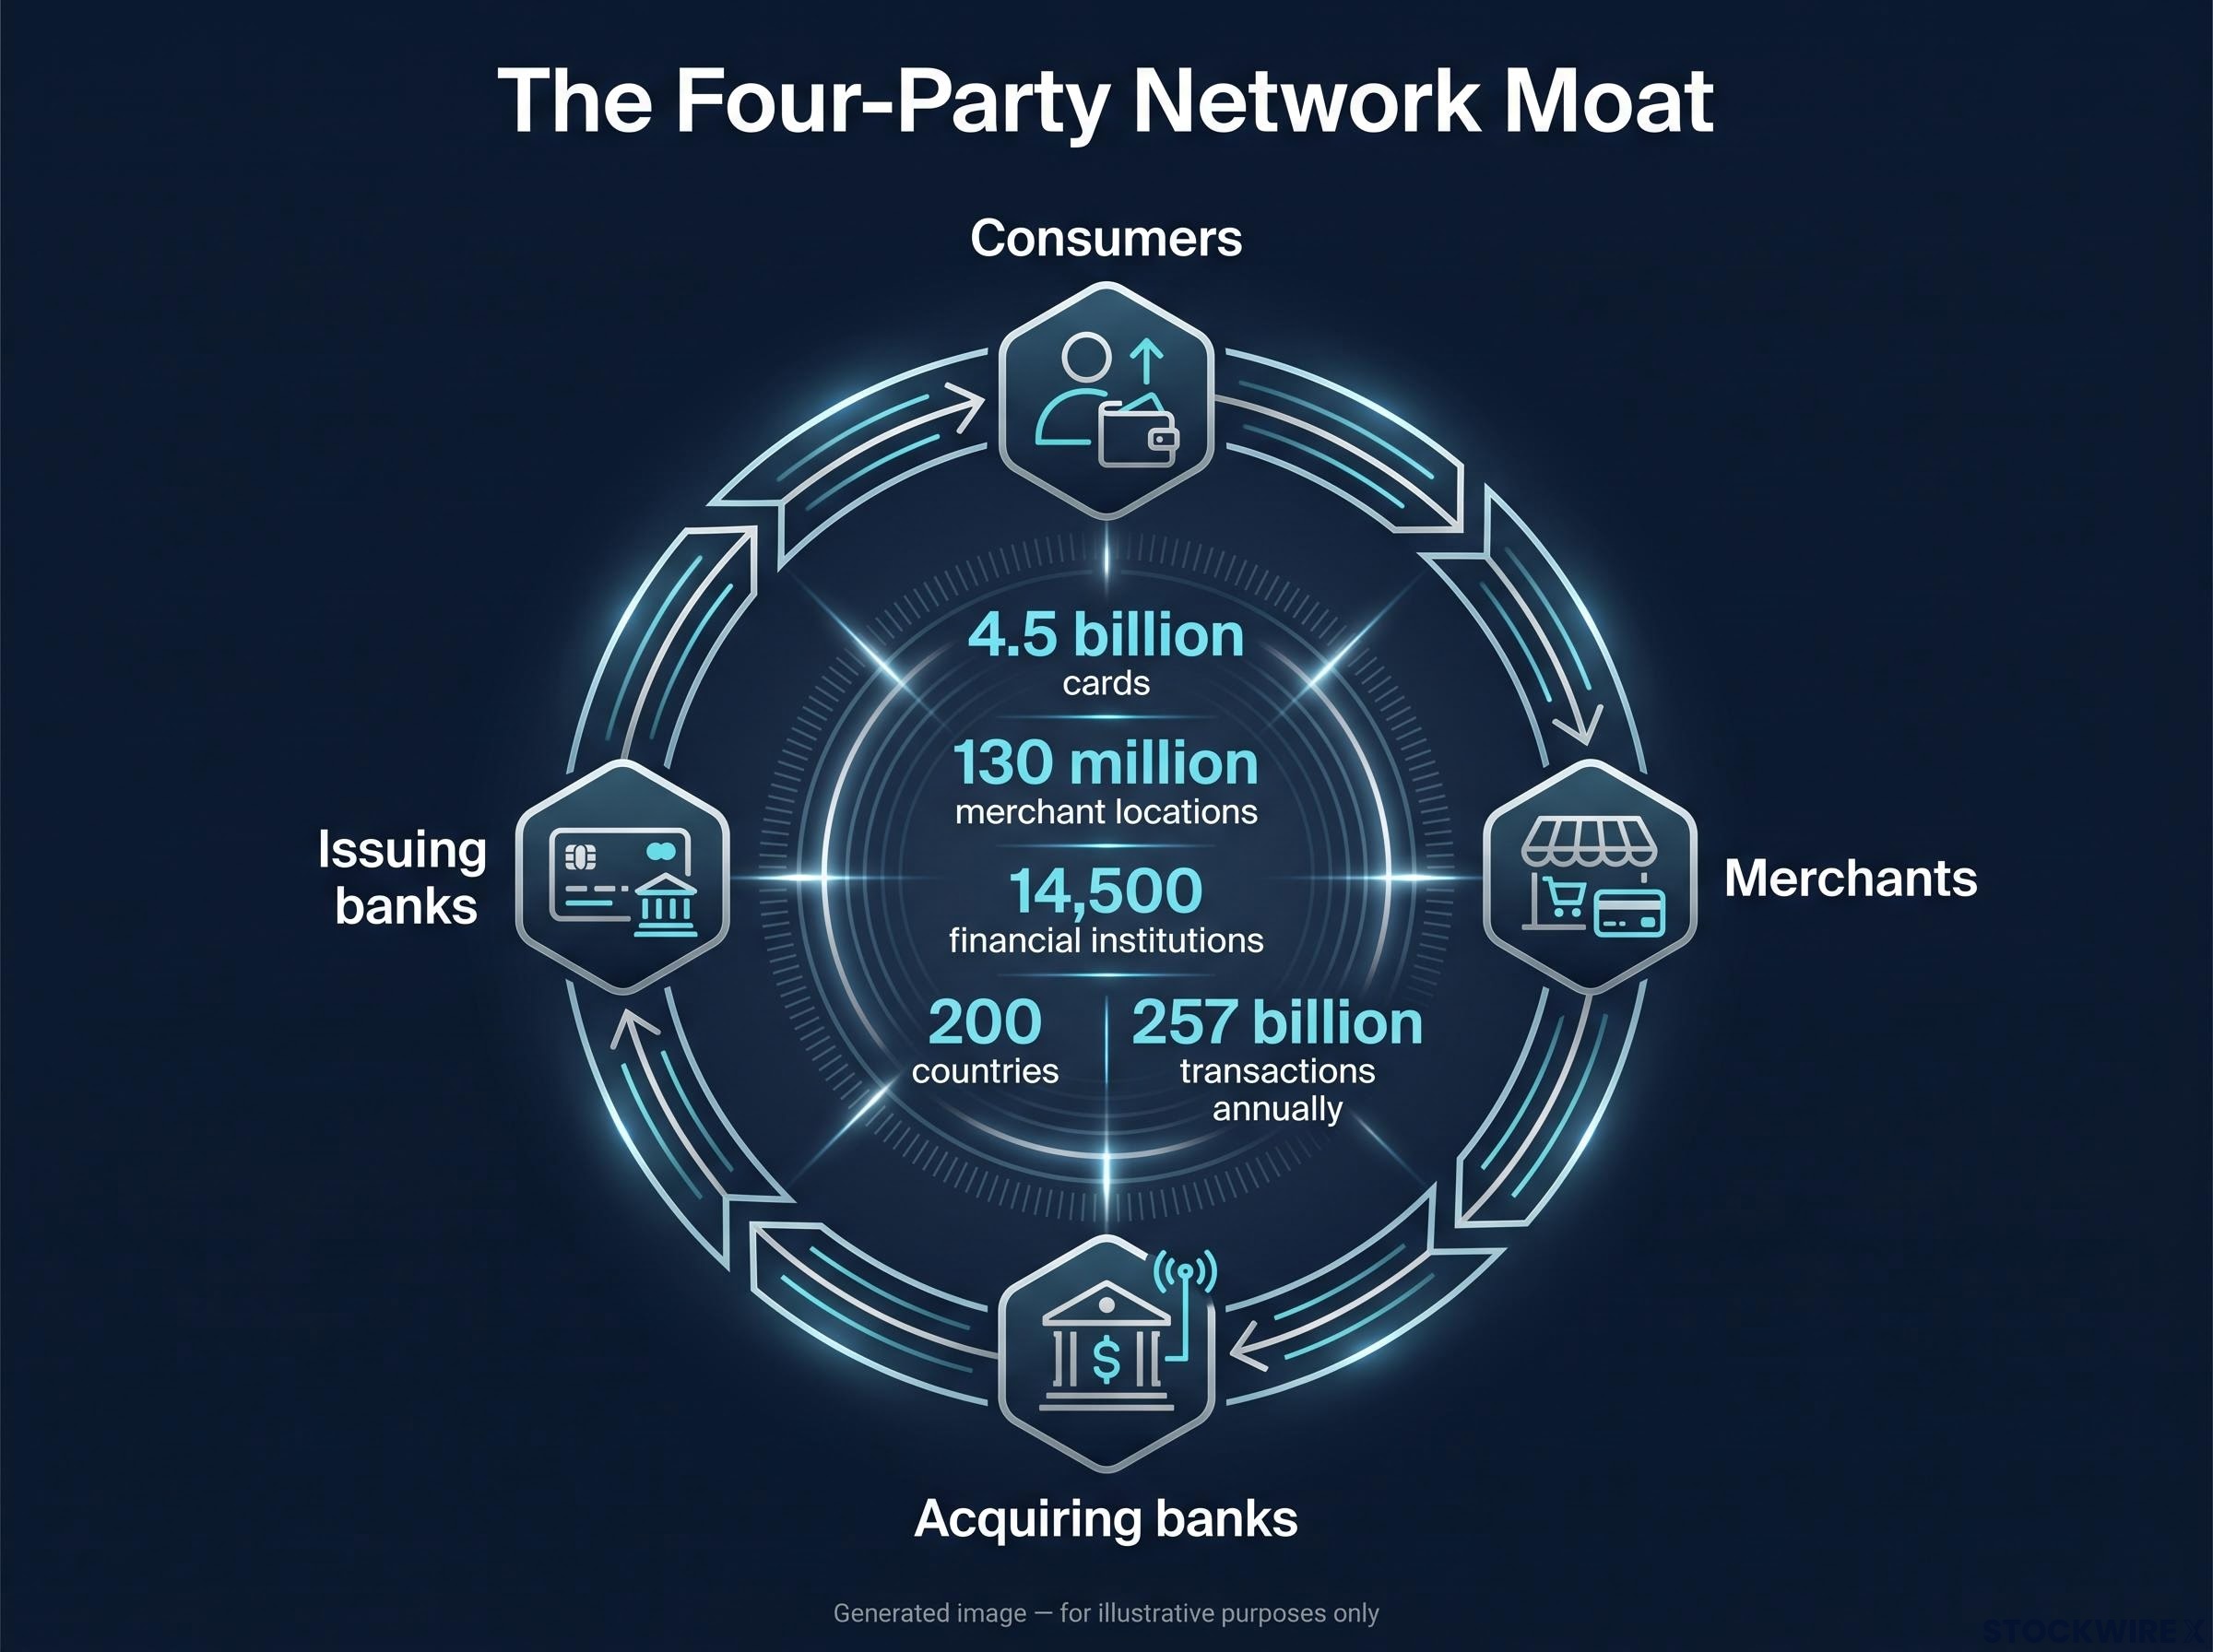
Start with how the network is wired, because everything else follows from it. Visa runs a four-party system, and each party depends on the other three being present.
- Consumers get a card accepted almost everywhere, which makes carrying it worthwhile.
- Merchants get access to billions of spenders, which makes accepting it worthwhile.
- Issuing banks (the banks that give customers their cards) earn fees and win customers by plugging into a network that already works everywhere.
- Acquiring banks (the banks that connect merchants to the network) earn fees by giving merchants access to that same universal acceptance.
Add one participant to any corner of that square and every other corner becomes more valuable. More cardholders pull in more merchants. More merchants pull in more cardholders. Banks on both sides benefit from the traffic. That self-reinforcing loop is why analysts consistently describe the structure as close to impossible for a new entrant to copy.
Network effects as a moat source sit at the top of Morningstar’s five-category framework precisely because they produce the self-reinforcing compounding that makes a moat widen rather than simply hold, and Visa’s four-party system is a textbook illustration of why scale begets scale.
Scale makes the loop concrete. Visa runs more than 4.5 billion cards, over 130 million merchant locations, and connects roughly 14,500 financial institutions across more than 200 countries. The network processes upwards of 257 billion transactions annually.
The durability comes from something less obvious: Visa is technology-agnostic. It does not depend on any single way of paying. The network has already survived paper imprinters, magnetic stripe, chip-and-PIN, contactless, and mobile payments, and the moat did not weaken through any of those shifts.
| Era | Payment method | Visa’s response |
|---|---|---|
| 1950s-1970s | Paper cards and physical imprinters | Built the four-party network foundation |
| 1970s-1990s | Magnetic stripe | Electronic authorisation at scale |
| 1990s-2000s | Chip-and-PIN | Embedded security into the same rails |
| 2010s | Contactless | Tap-to-pay layered onto existing acceptance |
| 2010s-present | Mobile and digital wallets | Integrated wallets as a front-end to the network |
Nearly 70 years of operating history across five payment generations tells you the moat is not tied to a technology that could become obsolete. It is tied to the network itself.
The data moat that compounds alongside the network
There is a second barrier stacked on top of the first. Those 257 billion transactions a year generate a proprietary dataset on fraud patterns and consumer behaviour that no challenger can build without first owning the network.
A competitor cannot buy this data or licence it. It only exists as a by-product of running global payment volume at scale, which means it compounds in value every year the network grows.
Here is where the marginal cost point becomes decisive. At Visa’s current scale, processing one more transaction costs almost nothing. Any new entrant faces the opposite problem: it must spend enormous capital to build global infrastructure before it can generate the volumes that would make that infrastructure economical.
That sequencing is what makes the moat self-perpetuating rather than a matter of brand recognition. Understanding why the network is durable, not simply that it is, is the foundation for every valuation and risk judgement that follows.
When big ASX news breaks, our subscribers know first
Structural tailwinds and the underappreciated VAS engine
The network’s durability is one thing. Its runway is another, and the runway is longer than the maturity of the business suggests.
Cash is still being displaced by digital payments, slowly and steadily. According to McKinsey’s 2025 Global Payments Report, cash accounted for 46% of worldwide payments in 2025, down from 50% in 2023. It is declining at roughly 4% per year.
The scale of the remaining runway An estimated $26 trillion of payments are still made in cash globally each year. That is the pool digital rails are converting from, and at current rates it lasts well beyond another decade.
This is a quantity argument, not a growth-rate story. Even as the percentage shrinks, the absolute dollars still sitting in cash mean the conversion opportunity persists for years, particularly across developing markets where digital penetration remains low.
The part of the story most coverage underweights is Value-Added Services (VAS). This is the segment of products Visa sells on top of moving money: issuing solutions, acceptance tools, risk and security products, and advisory services. It carries higher margins than core transaction processing and it is growing considerably faster.
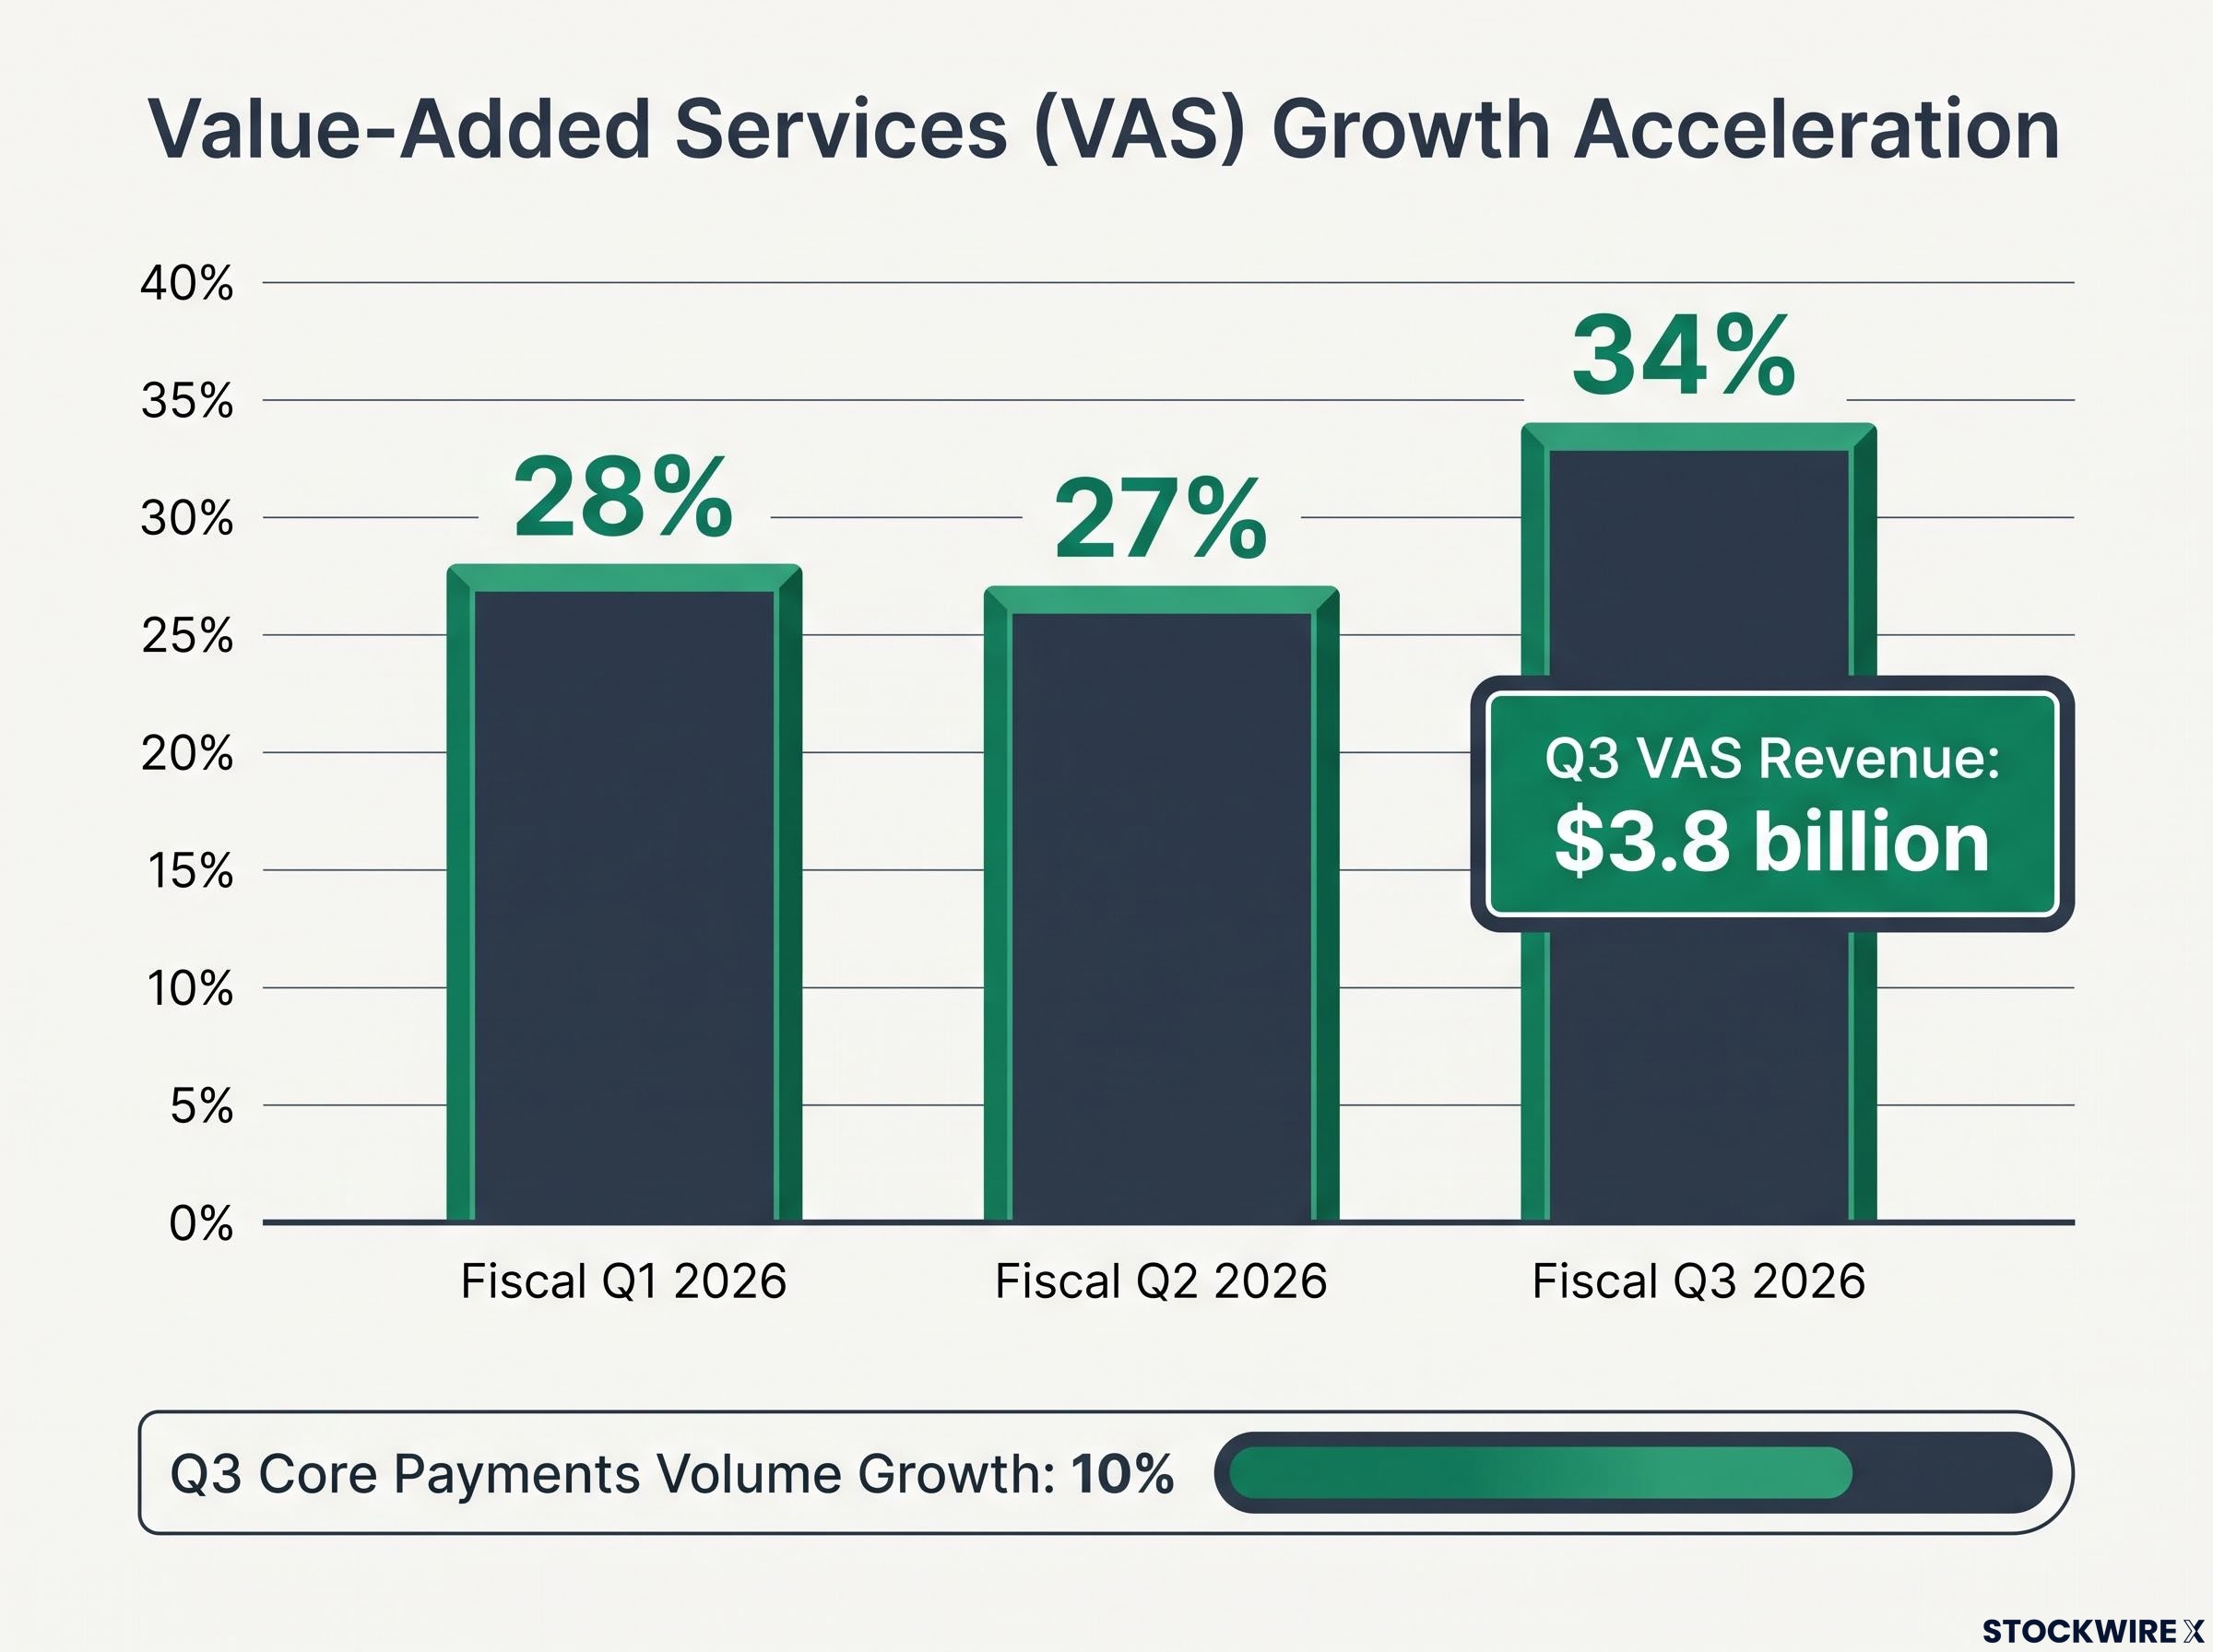
VAS has compounded at more than 20% annually since fiscal 2021. By fiscal 2025 it reached roughly $10.9-11 billion in revenue, accounting for somewhere between 24% and 30% of total net revenue. The recent quarterly pattern shows acceleration, not maturity:
- Fiscal Q1 2026: VAS revenue grew an estimated 28% year-over-year in constant dollars (unverified figure, treat as directional).
- Fiscal Q2 2026: growth of an estimated 27% year-over-year in constant dollars (unverified figure, treat as directional).
- Fiscal Q3 2026: growth of 34% year-over-year in constant dollars, reaching $3.8 billion.
A 34% growth rate in the most recent quarter tells you the segment is speeding up, not levelling off. If you are pricing Visa purely on payments volume, which grew a more sedate 10% in constant dollars in the same quarter, you are likely watching the wrong growth driver for the next five years.
Cross-border activity supports the same conclusion. Excluding intra-Europe traffic, cross-border volume grew 12% in constant dollars in fiscal Q3 2026, a higher-margin revenue stream than domestic processing.
What VAS revenue means for margin trajectory
Because VAS products carry higher margins than core payment processing at scale, their rapid growth should expand Visa’s operating margins over time rather than dilute them.
That has a direct consequence for how you model the business. If VAS keeps taking a larger share of revenue, free cash flow can grow faster than headline payments volume would imply, which is precisely the effect consensus models anchored to volume tend to miss.
Reading the valuation signals without getting lost in the noise
Here the picture gets genuinely complicated, and it is worth sitting with the contradictions before reaching for a resolution.
Depending on which metric you look at, Visa appears either mildly expensive or noticeably cheap relative to its own history. Trailing P/E readings run above five-year averages by some measures. Forward P/E multiples look compressed. Discounted cash flow (DCF) models, which estimate a fair value by projecting future cash and discounting it back to today, range from close-to-fair to significantly overvalued depending on the assumptions plugged in.
| Metric | Figure | Source | 5-year average | Interpretation |
|---|---|---|---|---|
| Trailing P/E | 36.0x (Sep 2026) | VCPSCanner | 31.1x | Modestly above history |
| Trailing P/E | 27.7x (Jun 2026) | TickerLeague (unverified) | 31.3x | Below history |
| Forward P/E | 21x-22x (mid-2026) | Intellectia AI | ~27x | Compressed |
| DCF fair value | $364 (2026) | AnalystScope (unverified) | n/a | Near fair value |
| DCF fair value | $166.94 (Jun 2025) | Acquirers Multiple (unverified) | n/a | Overvalued |
Look at the spread between the DCF estimates. Nearly $200 per share separates the lowest from the highest. That tells you Visa’s valuation is not a number to look up but a judgement to form, and the right question is not “what is it worth” but “what assumptions are embedded in the price I am being asked to pay.”
The nearly $200 spread between the two DCF estimates is a reminder that an intrinsic value judgement is an output of assumptions, not a fact to retrieve, and the P/E, free cash flow yield, and discount rate inputs each pull the result in a different direction depending on what growth trajectory the modeller believes.
The forward multiple is the signal that cuts through the noise most cleanly.
The most actionable number in the piece Forward P/E of 21x-22x sits well below the five-year forward average of roughly 27x. On the metric that reflects expected future earnings, Visa is trading at a discount to its own recent history.
Institutional behaviour offers a useful precedent for how discipline gets applied in practice, using Visa’s near-twin Mastercard as the example. Valuation trimming is a response to relative stretch, not a permanent verdict:
- Fund manager GCQ trimmed its Mastercard position in early 2025 after the stock held up better than peers seen as vulnerable to AI disruption, making its relative valuation less attractive.
- Investor Guy Spier reportedly reduced his Mastercard holding by roughly 39% in Q4 2025 (unverified figure).
The framework to carry forward is straightforward. The question is not whether Visa deserves a premium, because a business with this moat and this growth clearly does. The question is whether the current premium fairly reflects the growth already embedded in VAS and cross-border tailwinds. Some long-term models suggest that if Visa sustains 11% EPS growth and holds a 30x multiple, shares could approach $550-600 by 2030, though that figure is unverified and purely illustrative.
The risks worth watching and the ones that are mostly noise
Not every risk deserves equal attention, and the most credible threat to Visa is also the most frequently misread.
The genuine structural risk is regulatory pressure on interchange, the fees merchants pay each time a card is used. Regulators across multiple jurisdictions are now actively capping or reducing those fees.
| Jurisdiction | Date | Action | Nature | Reader implication |
|---|---|---|---|---|
| United States | Nov 2025 | Swipe-fee settlement | Gradual interchange reductions | Fee compression on existing volume |
| European Union | Ongoing | Interchange Fee Regulation | Credit capped at 30bps, debit at 20bps | Structural ceiling on EU economics |
| United Kingdom | Jun 2025 | Competition Appeal Tribunal ruling | Found interchange fees breached competition law | Precedent for further caps |
| New Zealand | Jul 2025 | Commerce Commission caps | New interchange limits | Incremental regional pressure |
| Switzerland | Jul 2025 | ComCo proceedings | Ongoing cap proposals | Incremental regional pressure |
Read that map carefully, because the shape of the risk matters more than its breadth. Every one of these actions compresses the fee Visa earns on volumes it already processes. None of them displaces the network or reduces the number of transactions flowing through it.
Interchange fee caps are now moving from proposal to implementation in multiple jurisdictions simultaneously: Australia’s October 2026 reforms cut consumer credit interchange from 0.8% to 0.3%, a concrete data point for sizing the earnings impact of regulatory compression in a mid-sized but well-documented market.
That is a very different investment problem from network obsolescence. It is margin compression in specific jurisdictions, which you size and monitor as an earnings headwind, not treat as an existential threat.
Mastercard’s margin trajectory offers the clearest peer benchmark for how a network business absorbs regulatory fee pressure without structural degradation, with fiscal year 2025 operating margins reaching 57.63% even as the GENIUS Act formalised stablecoin rails as a concrete alternative infrastructure.
Alternative rails and digital wallets: displacement or coexistence?
Account-to-account (A2A) payments, which move money directly between bank accounts, and digital wallets are capturing incremental digital volume, especially in emerging markets like India, Brazil, and Nigeria. The specific share figures floating around the research are flagged as unverified, so treat them as directional rather than precise.
The relevant frame is the technology-agnostic architecture from the first section. Visa’s historical pattern has been to integrate with new payment modalities rather than fight them, layering wallets on top of its own rails as a front-end. Whether coexistence holds depends on how durable that pattern proves, but the network has absorbed every prior shift rather than being displaced by it.
The disruption story that deserves the least weight is crypto:
- Stablecoins and on-chain money movement remain a medium-term narrative that has not translated into material transaction volumes.
- In January 2026, Visa and Mastercard executives publicly voiced cautious views on stablecoins for everyday payments, noting consumer interest has not yet become network volume.
Conflating regulatory fee pressure with existential network risk leads to systematically wrong decisions about position sizing and sell triggers. Keeping the two separate is the single most useful thing this section gives you.
Holding Visa, trimming Visa, or waiting for a better entry
Put the business quality and the valuation discipline side by side, and the decision resolves into three positions rather than one verdict.
The business case is intact. Fiscal Q3 2026 net revenue reached $11.6 billion, up 14% year-over-year, with VAS accelerating to 34% growth. Momentum is not the question.
The single condition that turns Visa from a hold into a sell is not the business breaking down. It is valuation stretching to a level where the price already assumes outcomes better than even Visa’s strong historical trajectory.
The number that frames the decision Forward P/E of 21x-22x against a five-year average of 27x means the stock is not currently sitting at the valuation extreme that would trigger trimming discipline.
For a reader already holding Visa, that compression is an argument for patience rather than for trimming. For a reader without a position, the same data suggests a current entry is not the extreme valuation risk the headline trailing multiples might imply.
Watch three variables from here:
- VAS revenue growth sustainability: the growth driver most models underweight. A slowdown below the low-20s percent range would be the signal that the acceleration thesis is fading.
- Regulatory interchange proceedings in the U.S. and UK: the credible earnings headwind. Watch the pace and depth of mandated fee reductions, not whether the network survives.
- Cross-border volume: whether it holds above 10% growth as post-pandemic travel normalisation matures. A drop below that line would flag a softening high-margin stream.
Some long-term models point to $550-600 by 2030 under sustained 11% EPS growth and a 30x multiple, though that scenario is unverified and illustrative only.
This article is for informational purposes only and should not be considered financial advice. Investors should conduct their own research and consult with financial professionals before making investment decisions. Past performance does not guarantee future results, and any projections are speculative and subject to change based on market conditions and company performance.