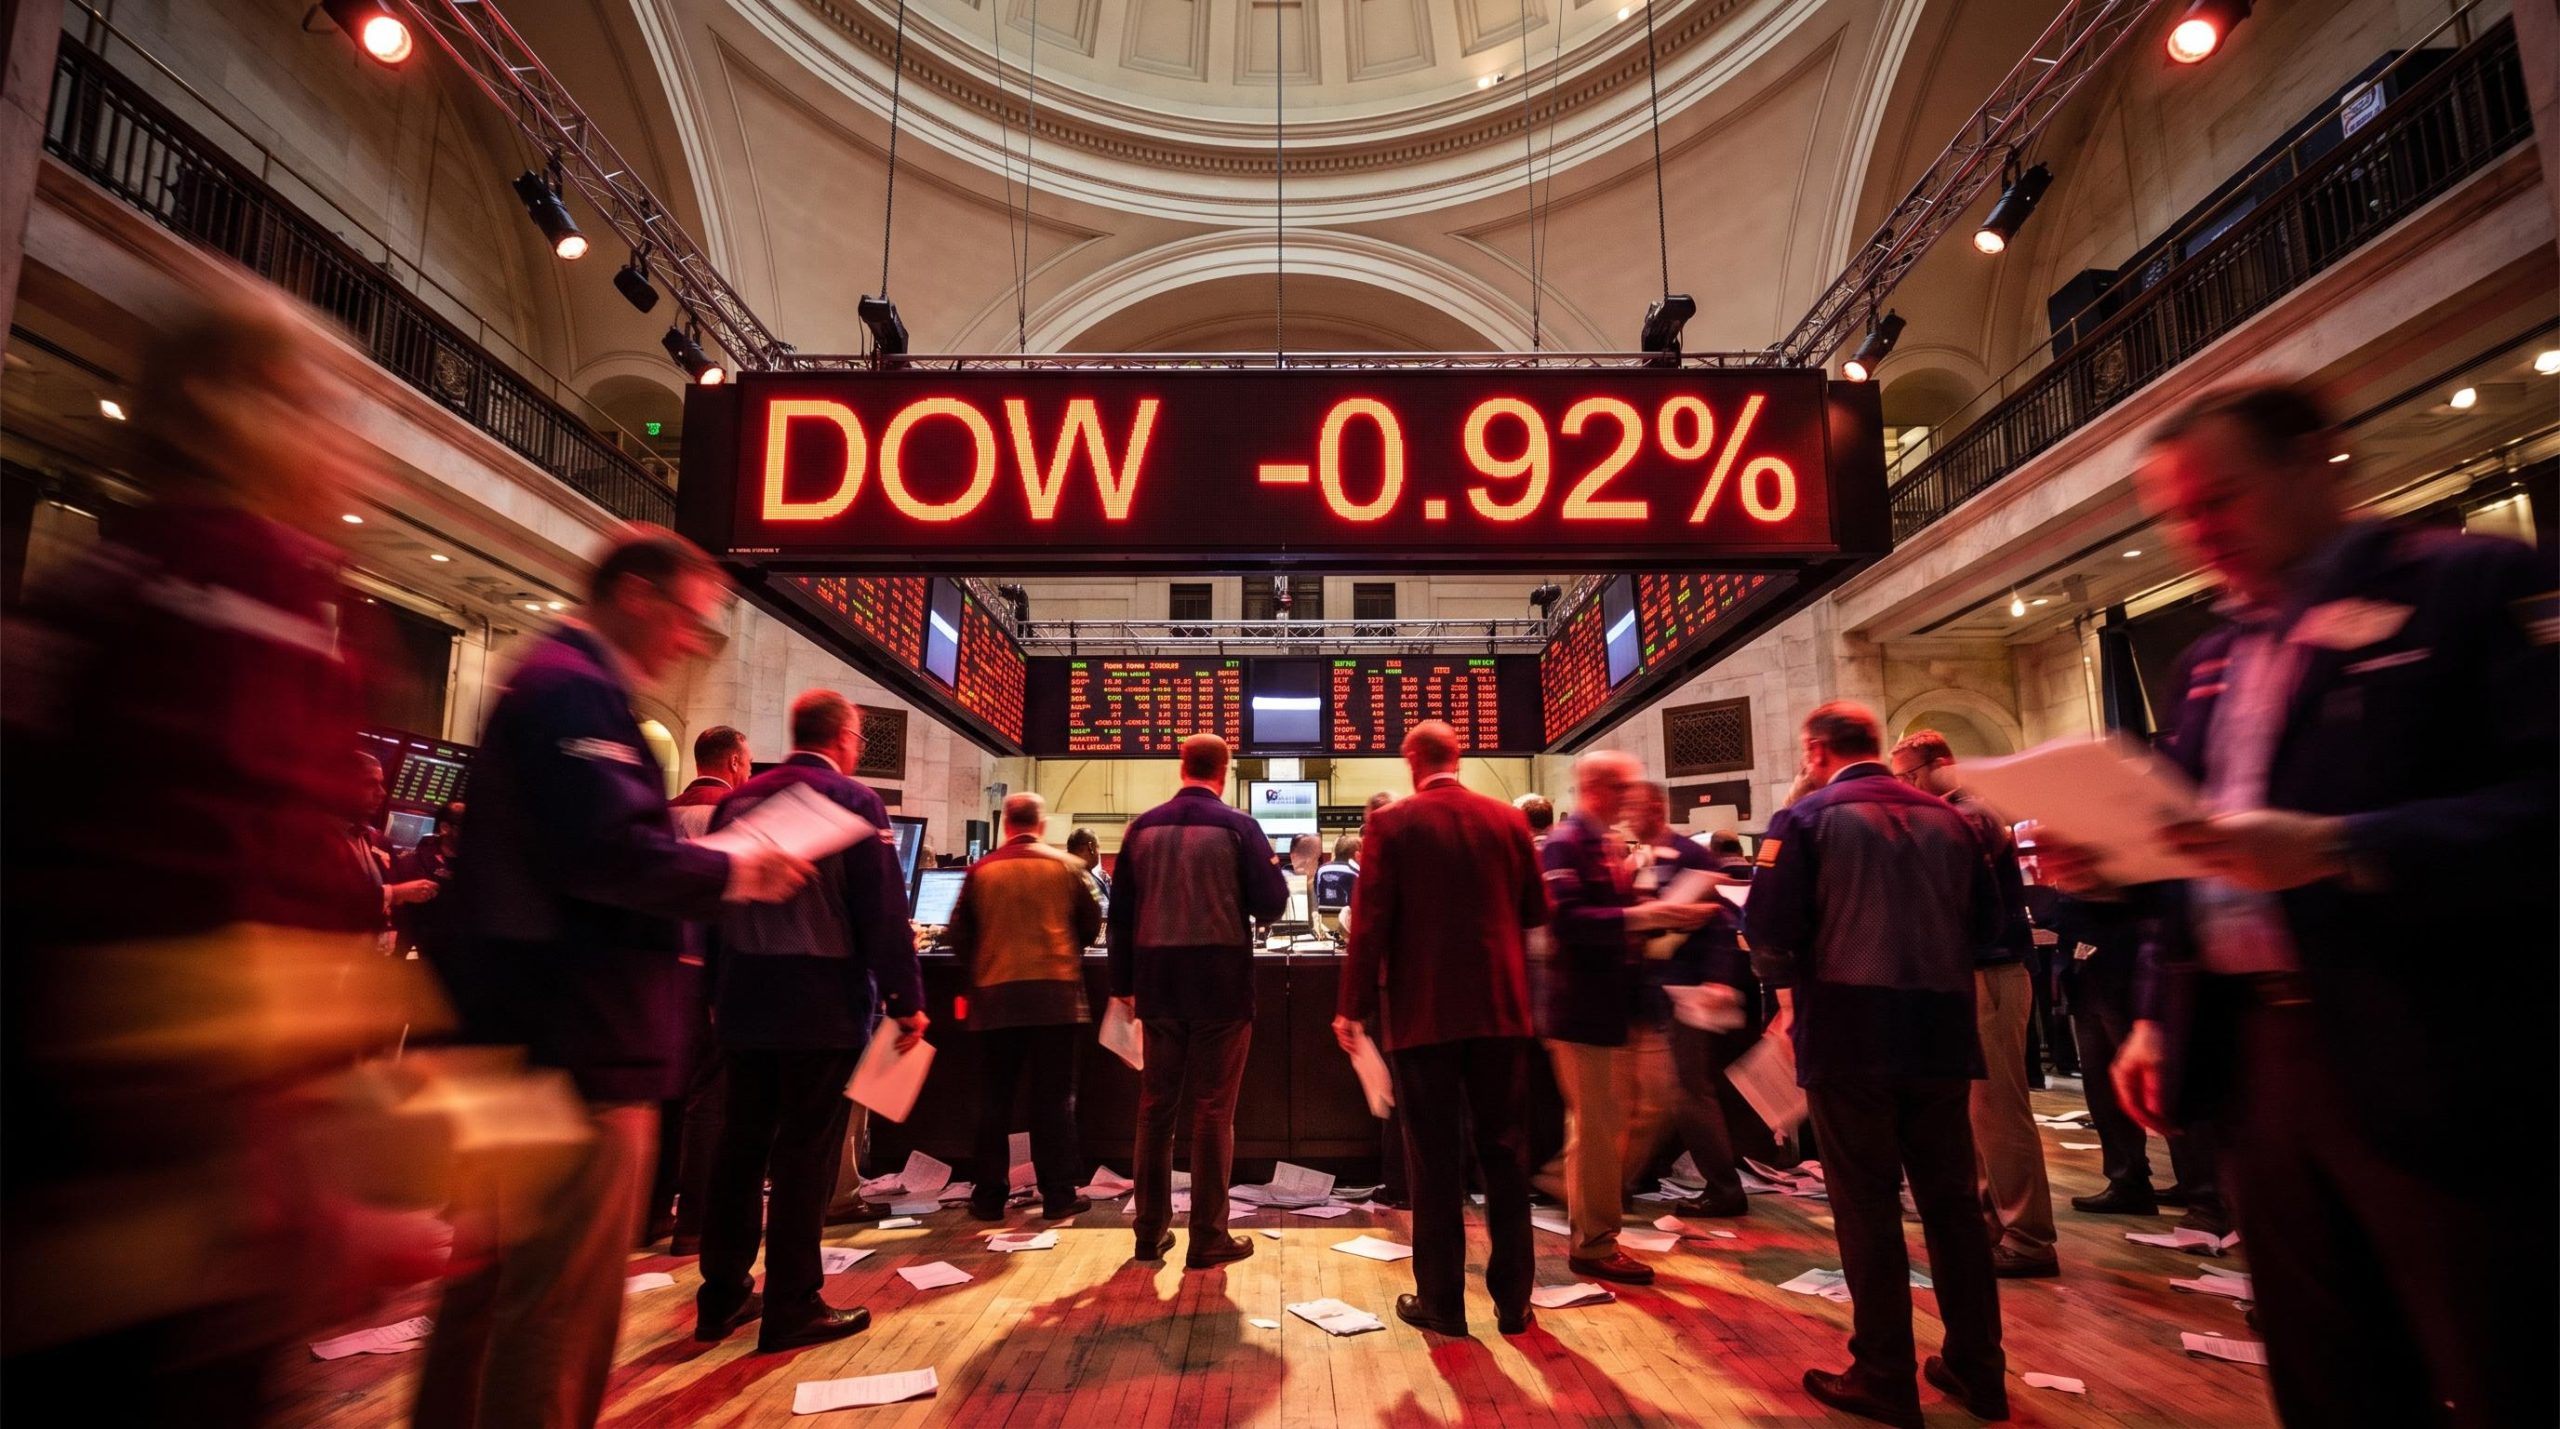
US equity futures are sliding across all three major indices this Tuesday morning, with Dow futures off nearly 1%, as three separate macro forces collide in a single session to test investor confidence at once.
This is not a market reacting to one bad number. It is a market absorbing three reinforcing pressures that arrived together: a jobs market running hotter than forecasts, a trade dispute with America’s largest trading partner shifting from rhetoric to enforcement, and energy markets pricing in a genuine geopolitical risk premium after a US-Iran military exchange.
Each of those forces feeds the same underlying worry. That inflation is not finished, and that the Federal Reserve may not be done raising rates.
Here is what each of these forces is doing to the market, why they are compounding rather than cancelling one another out, and which data releases in the days ahead will decide whether the pressure holds or eases.
A jobs report that should have been good news just made the Fed’s job harder
Strong employment data landed last week, and markets fell in response.
That looks like a contradiction, and it is worth sitting with for a moment before the logic unwinds. On 4 September 2026, the US Bureau of Labor Statistics reported that employers added 162,000 jobs in August, with the unemployment rate holding steady at 4.1%. The Associated Press described the result as “surprisingly strong.”
The number that spooked the market Employers added 162,000 jobs in August, a print the Associated Press called “surprisingly strong.” Under normal conditions, that reads as economic health. Right now, it reads as a reason for the Fed to keep tightening.
The mechanism connecting good jobs data to falling stocks runs through the Fed. A resilient labour market signals continued demand for workers and ongoing wage pressure. That resilience reduces the central bank’s incentive to ease, and instead supports keeping policy tight to push inflation lower.
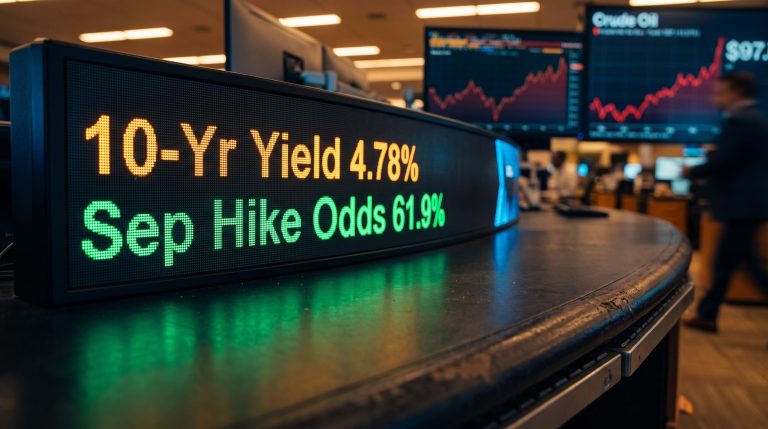
Traders responded by repricing the odds of a September rate hike, and the move was sharp. Sources differ on the exact figure, but the direction is unambiguous.
- Prior-day September hike odds: 49.4% (CME FedWatch, via Barron’s)
- Post-report estimate: approximately 58% (Barron’s, citing CME FedWatch)
- Post-report estimate: above 60% (FXStreet, citing BNY strategists)
That roughly 10-percentage-point jump in a single morning tells you the market is now treating a September increase as more likely than not. BNY strategists noted that remarks from Fed Governor Christopher Waller were viewed as too ambiguous to offset the signal from the jobs data, leaving the hawkish read intact.
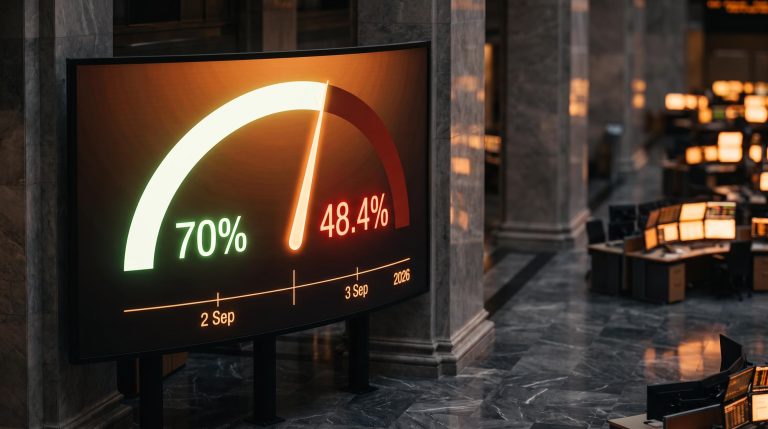
The September FOMC rate hike odds have been moving sharply with each new data release in 2026, swinging from nearly 70% to a coin flip within 48 hours in the days before this week’s jobs print landed, illustrating how quickly the market recalibrates when a single macro variable breaks from consensus.
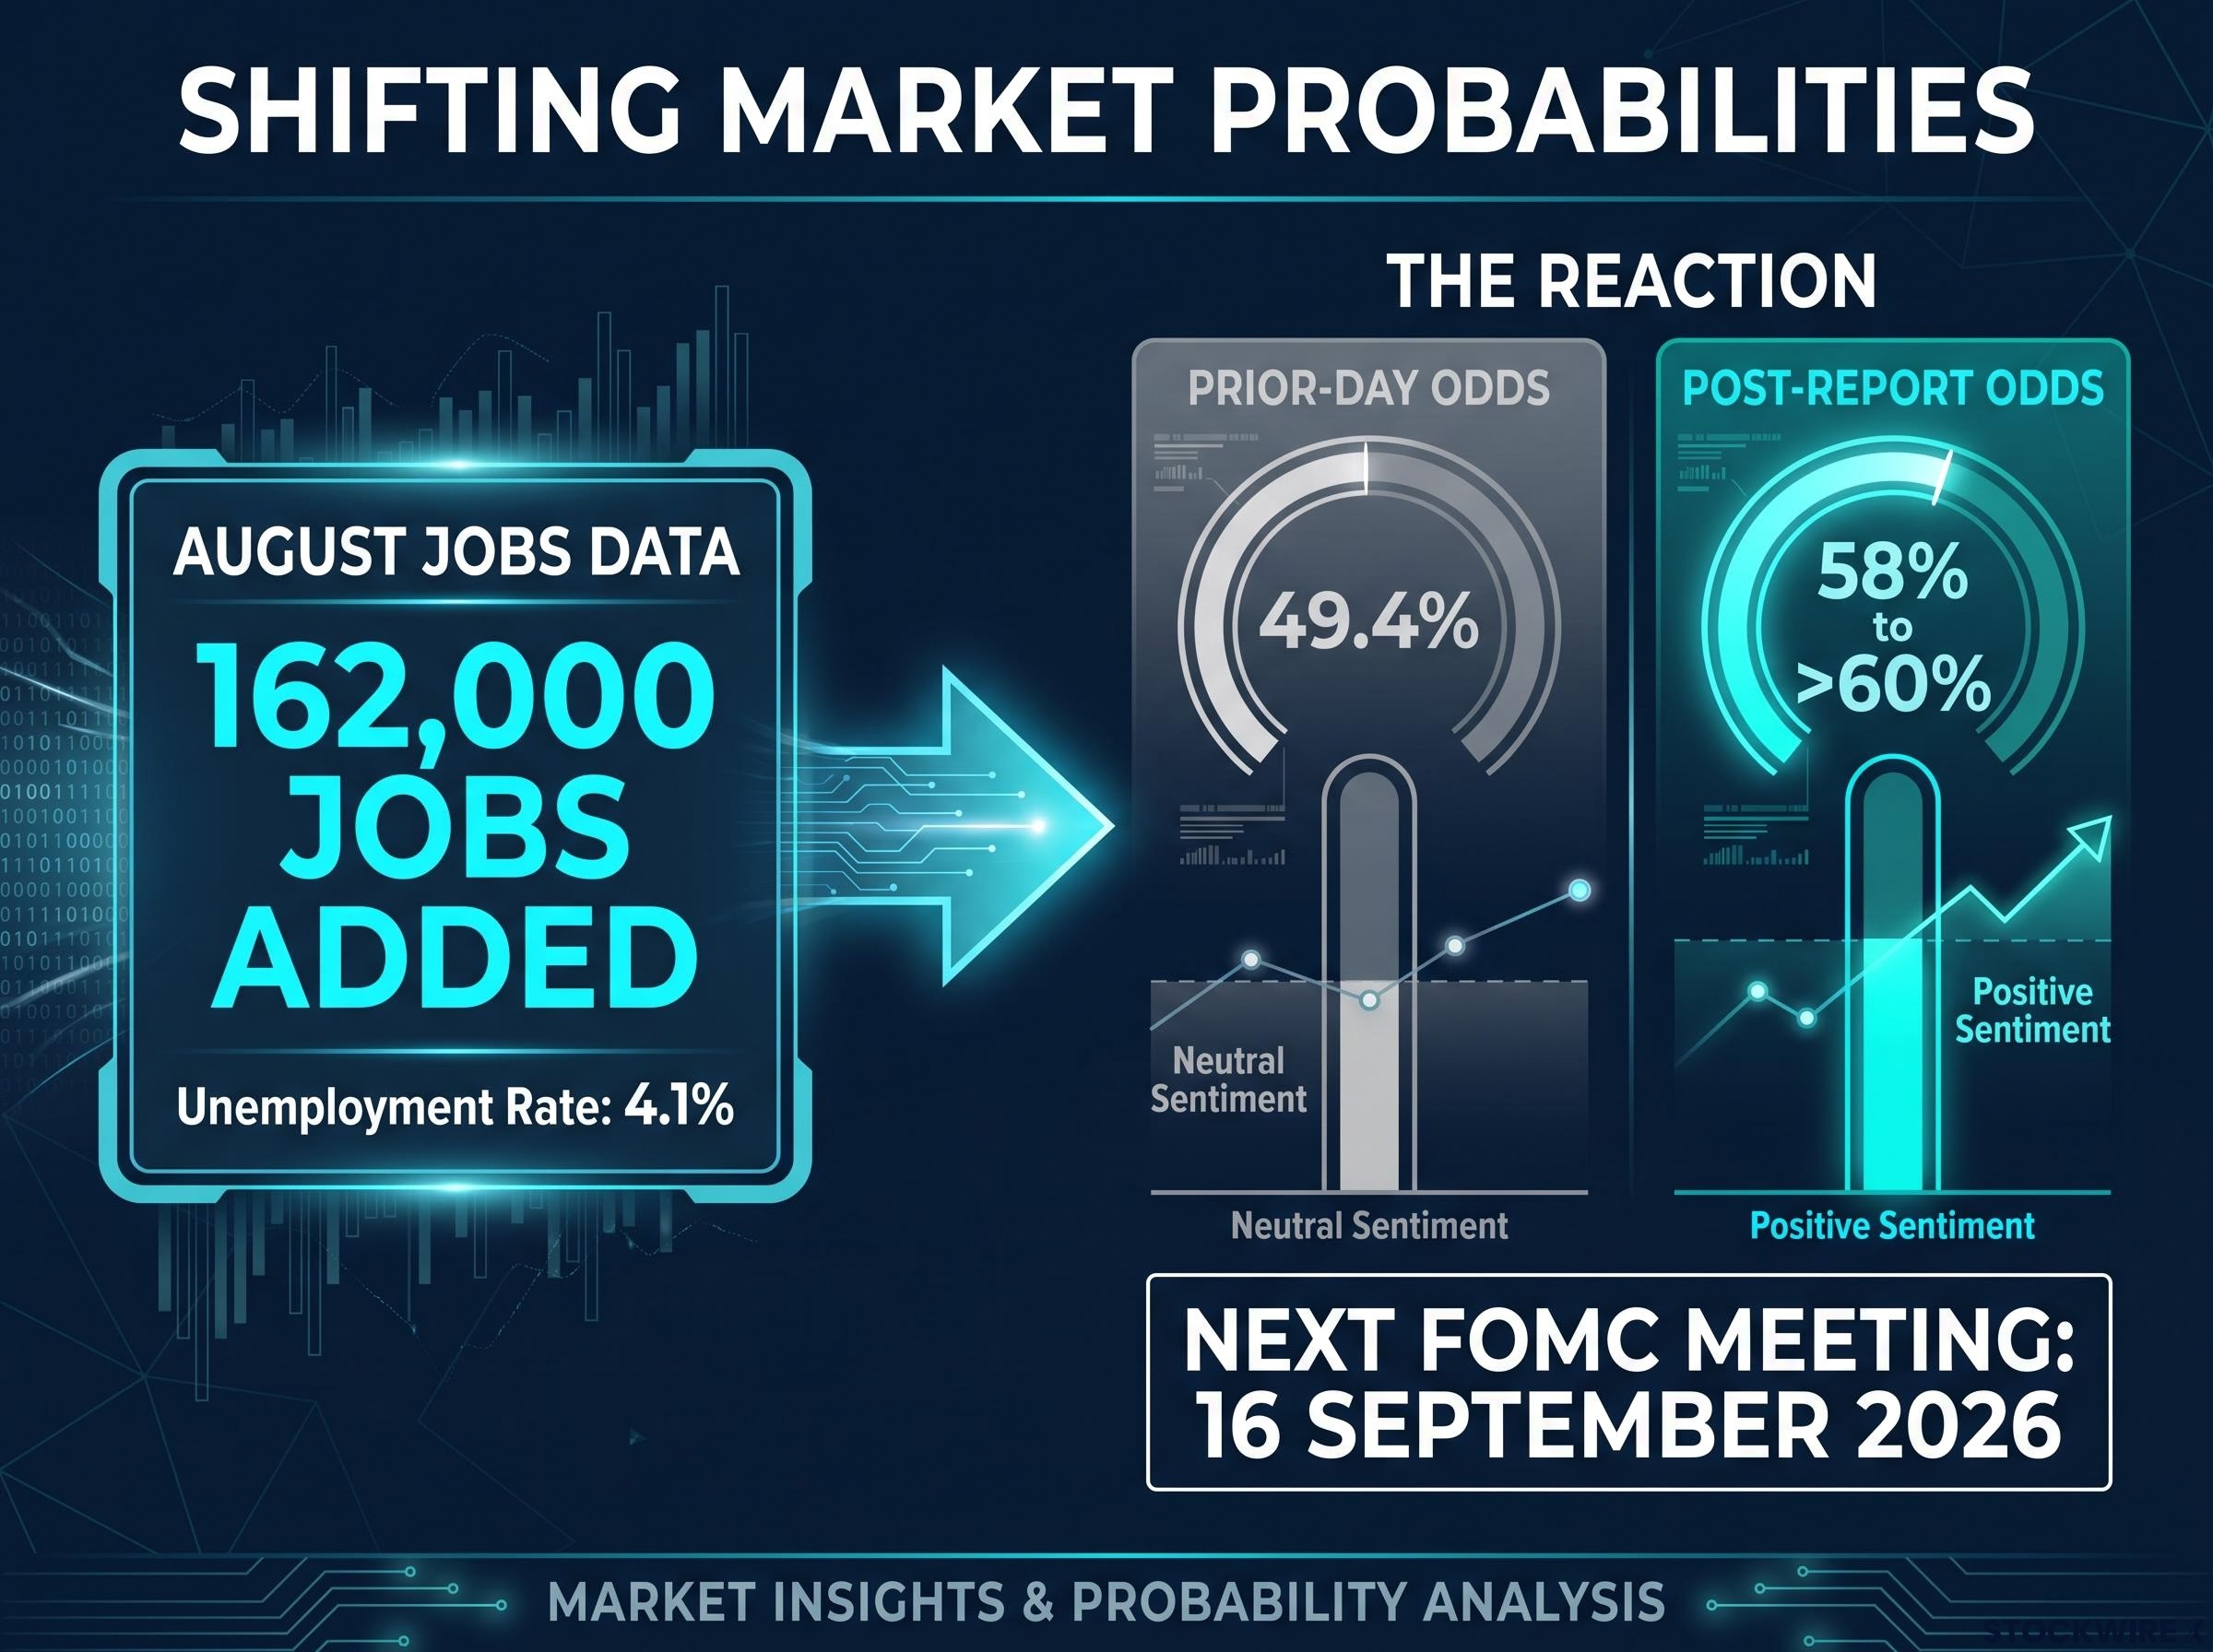
The Federal Open Market Committee meets on 16 September 2026. A hike at that meeting would raise borrowing costs for businesses and households at exactly the moment tariff-driven input costs and higher energy prices are already squeezing budgets, compressing corporate margins and consumer spending capacity together.
When big ASX news breaks, our subscribers know first
Canada’s retaliatory tariffs just moved from threat to reality, and markets felt it immediately
The trade dispute stopped being rhetoric this morning.
At 12:01 a.m. on 8 September 2026, Canada’s retaliatory tariffs on US goods took effect, confirmed by Canada’s Department of Finance, Reuters, and Al Jazeera. This is enforcement, not a negotiating position.
The scope is what gives it weight. The package covers approximately C$27.6 billion (around US$20 billion) in US imports, spanning roughly 700 product lines, and is framed as a dollar-for-dollar response to US tariffs on Canadian goods. Duties fall into three bands: 15%, 25%, and 50%.
Canada’s Department of Finance confirmed the scope of the countermeasures in an official release, detailing the three duty bands, the C$27.6 billion in affected US imports, and the product categories targeted, underscoring that this package was designed as a precise dollar-for-dollar response to existing US tariff levels.
The sharpest escalation sits in metals. Canada doubled its counter-tariffs on steel and aluminium from 25% to 50% to match US rates.
| Rate band | Sectors targeted | Notable escalation |
|---|---|---|
| 15% | Various US goods | Broad-based consumer exposure |
| 25% | Various US goods | Manufacturing and industrial inputs |
| 50% | Steel and aluminium | Doubled from 25% to match US rates |
The full list of affected categories underlines how wide the net is:
- Steel and aluminium
- Dairy
- Agricultural equipment
- Pulp and paper
- Plastics
- Electronics and household appliances
- Furniture
- Clothing and apparel
That breadth matters. This is not a niche supply-chain story confined to one industry. It cuts across manufacturing, agriculture, and consumer goods, which means potential cost pass-through to American producers and shoppers in categories that touch everyday spending.
Canada is the United States’ largest single trading partner. The shift from threatened retaliation to active enforcement raises the odds that further escalation follows, and that is precisely the risk markets are pricing into sentiment today.
Oil above the geopolitical flashpoint, and what the Strait of Hormuz risk means for inflation
The third force is geographic before it is economic, and the geography is the point.
The Strait of Hormuz is a narrow shipping channel between Iran and Oman, and it handles a significant share of global oil trade. Any threat to shipping through it does not stay a regional issue. It becomes a global supply problem, because there is no easy alternative route for the crude that passes through.
That is why the recent escalation moved prices. Reuters reported on 6 August 2026 that oil jumped more than $3 a barrel on concerns over US and Israeli access to the strait, with an Iranian parliament committee reviewing a bill to ban US and Israeli vessels from the waterway. A weekend military exchange of strikes involving the US and Iran in August 2026 added further fuel to those fears.
The Hormuz shipping crisis extends well beyond headline price moves: commercial transits through the strait collapsed to just 3-14 vessels per day against a pre-war baseline of 120-140, and war-risk insurance premiums running at roughly 30 times normal rates mean a diplomatic ceasefire declaration alone cannot restore oil flows.
The energy shock in one line Oil rose more than $3 a barrel on 6 August 2026, Reuters reported, driven by fears of disruption to the Strait of Hormuz, the chokepoint through which roughly a fifth of the world’s traded crude flows.
How oil feeds back into Fed thinking
The transmission chain from a chokepoint to your portfolio is short and direct. Hormuz risk pushes oil prices up. Higher oil prices feed into headline inflation, because energy costs ripple through transport, production, and consumer prices. Higher inflation, in turn, reduces the Fed’s room to pause or cut.
That is what makes this force so dangerous in combination with the jobs data. It reinforces the same conclusion from a different direction.
For anyone tracking their exposure, energy-driven inflation is the variable most likely to keep the Fed tightening regardless of any softness in other inflation readings. That makes oil’s path more relevant to rate expectations than it has been in months.
There is one more reason this force stands apart. Tariff effects play out over quarters as supply chains adjust, but oil moves tied to active geopolitical events can accelerate in days, giving this risk a far shorter feedback loop into equity prices and rate expectations than the other two pressures in play.
What investors are watching before the September 16 FOMC decision
The question now shifts from what has happened to what happens next, and two data releases hold most of the answer.
Investors are watching the upcoming Producer Price Index (PPI) and Consumer Price Index (CPI) reports, both expected later this week, in the same window as the jobs data. The PPI tracks price changes at the wholesale level, before goods reach consumers, while the CPI measures the prices households actually pay. Together they are the clearest read on whether inflation is cooling enough to let the Fed hold.
The logic splits cleanly in two directions:
- Above consensus: If core CPI or core PPI come in hotter than forecast, hike odds rise further, and the case for a September pause weakens.
- Below consensus: If either reading undershoots, it reopens the case for a pause and could relieve some of the pressure now weighing on equities.
- The energy wildcard: Even if underlying CPI softens, oil prices lifted by geopolitical risk could keep headline inflation sticky, narrowing the Fed’s scope for a dovish turn.
The market has already shown its sensitivity to this exact dynamic in 2026. A strong May jobs report earlier this year produced one of the worst equity sessions in months, as investors read robust hiring as evidence the economy was running too hot to justify steady rates.
The relationship between payrolls data and rate expectations has a consistent pattern in 2026: the April report also delivered a headline beat while underlying indicators including contracting ISM employment readings on both sides of the economy told a more cautious story, a split reading the market is now applying to the August print.
If both PPI and CPI print above consensus while oil stays elevated, the case for a September pause essentially collapses. A confirmed hike on 16 September would then likely extend the pressure on rate-sensitive stocks well beyond this single session.
The next 48 to 72 hours of data will tell you whether today’s selloff is a one-session recalibration or the start of a broader repricing of rate expectations heading into the final stretch of 2026.
Three forces, one direction, and the data that decides what comes next
The reason this session matters is not any single catalyst. It is that all three are pushing the same way at once.
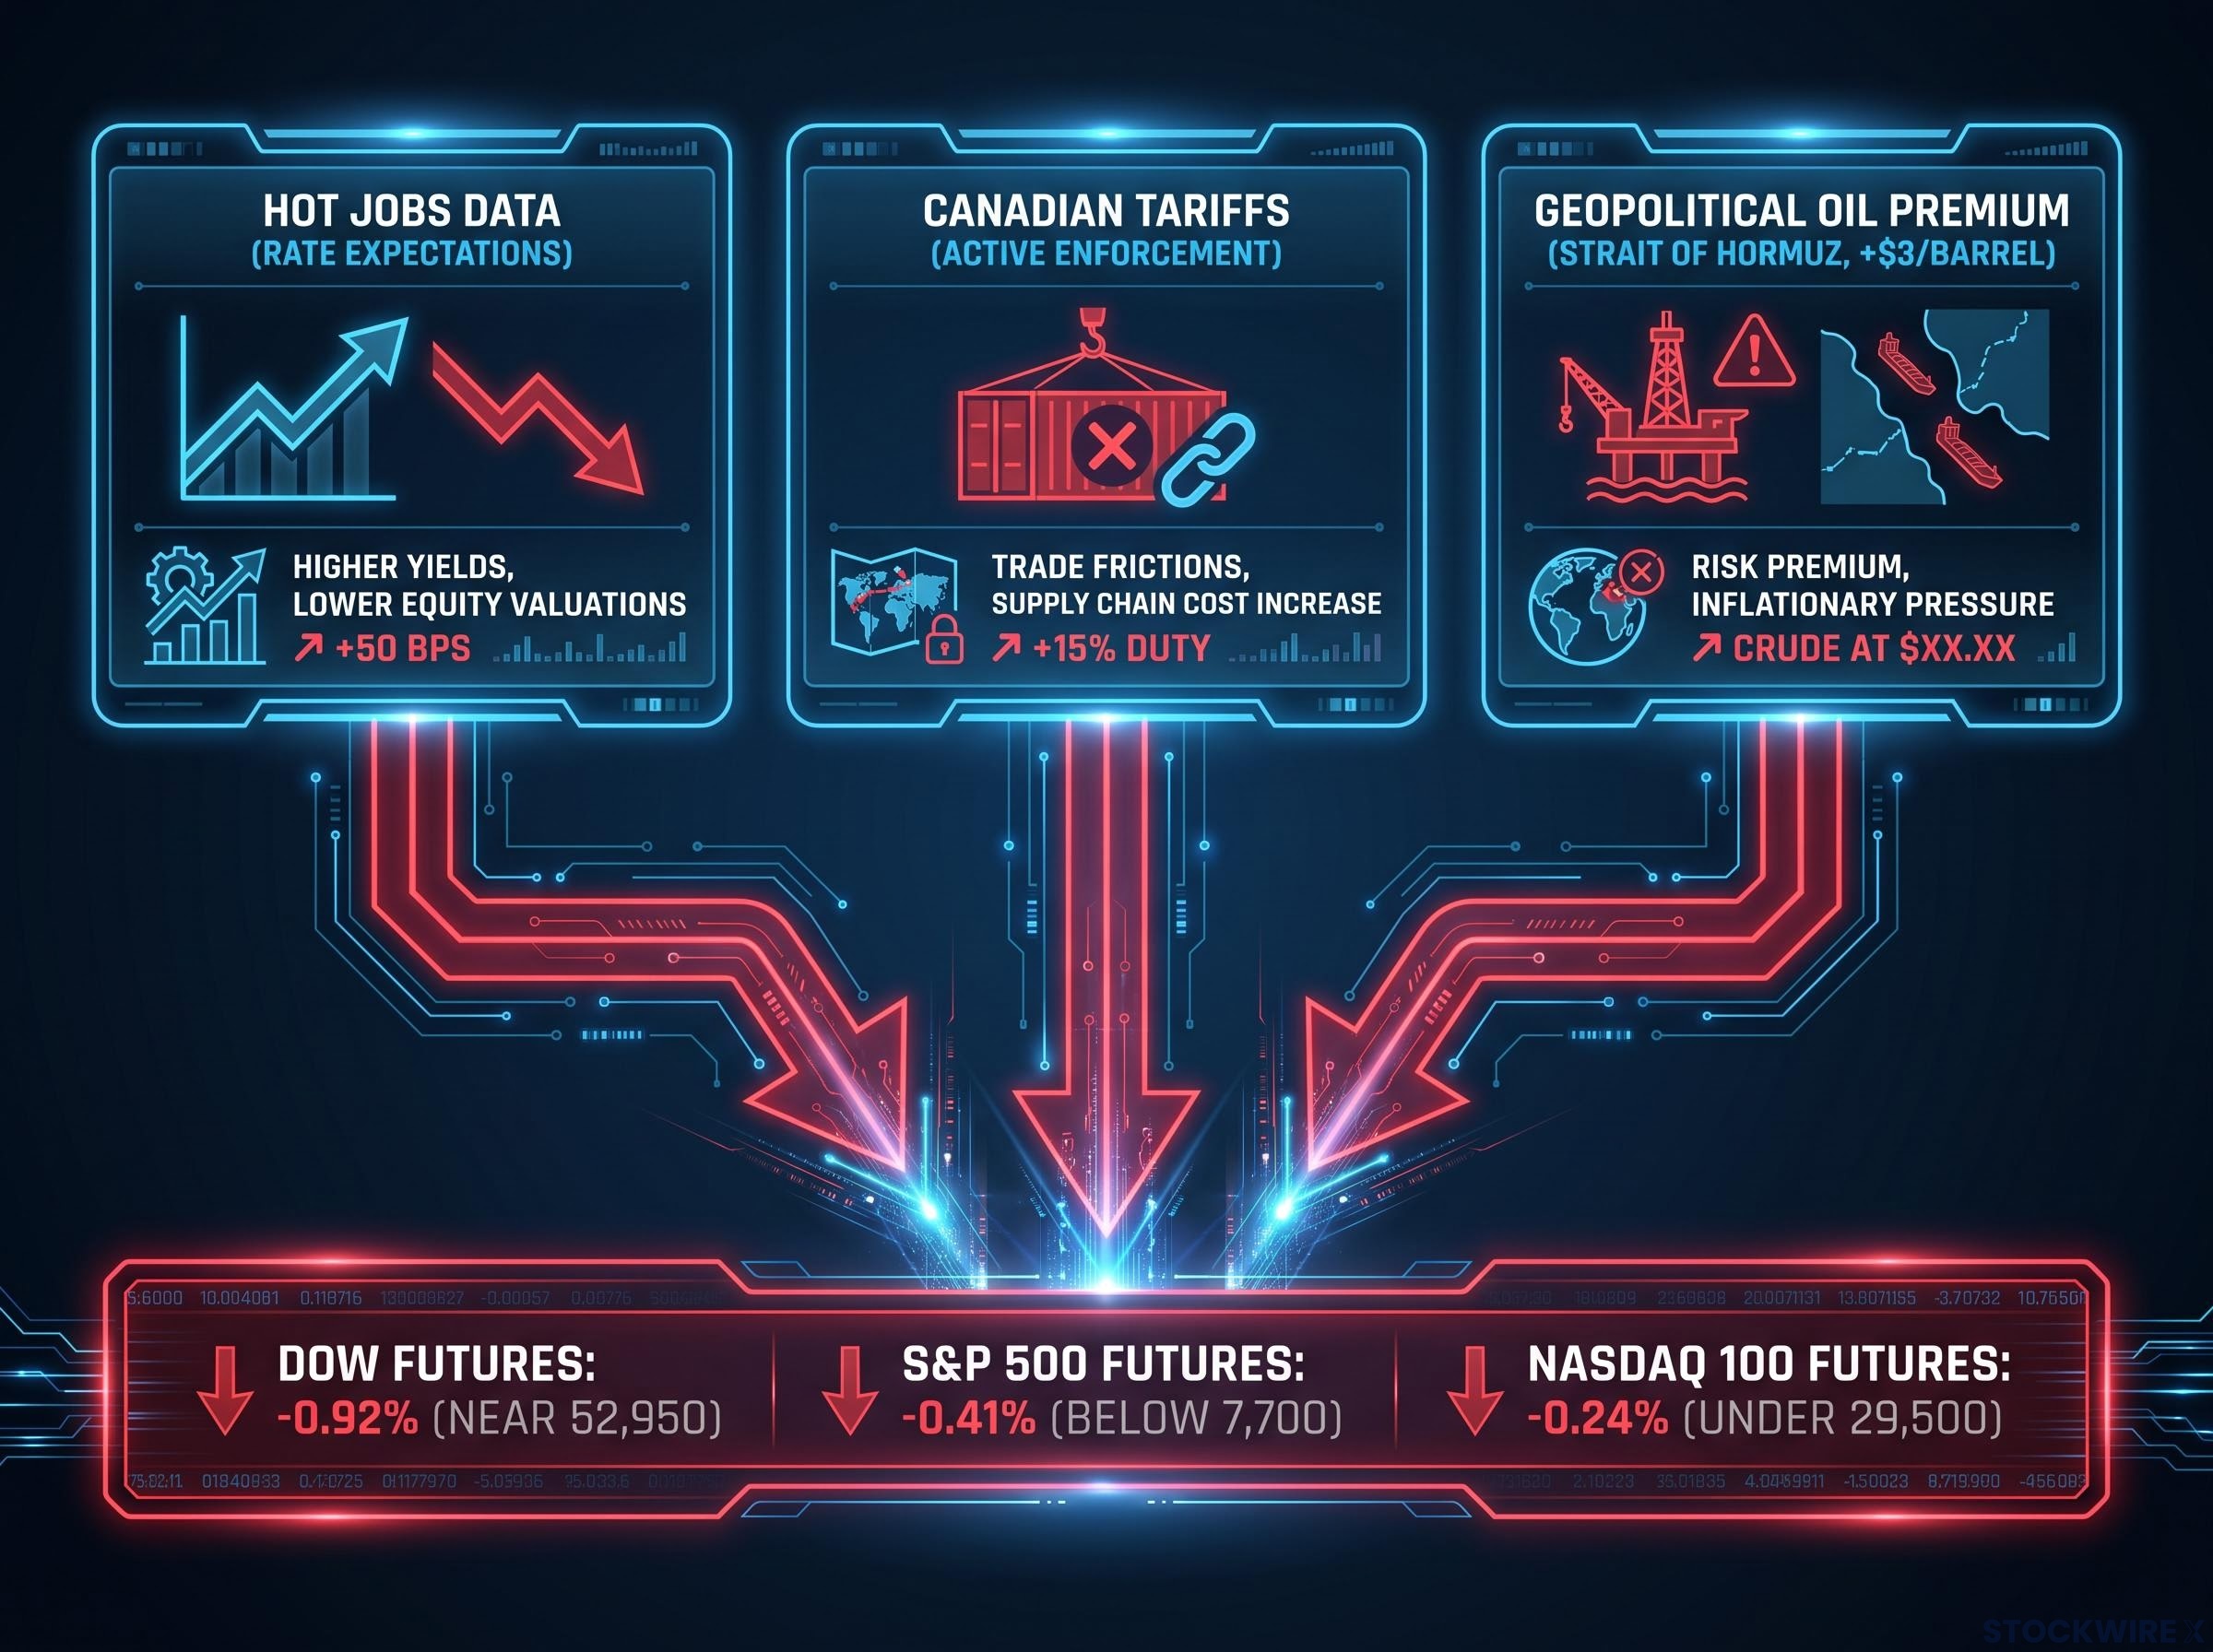
Jobs-driven rate expectations, active Canadian tariff enforcement, and energy geopolitics are reinforcing rather than offsetting one another today, which is what separates meaningful pressure from routine market noise. The futures board reflects that combined weight during European hours:
- Dow futures: down 0.92%, near 52,950
- S&P 500 futures: down 0.41%, below 7,700
- Nasdaq 100 futures: down 0.24%, under 29,500
The convergence in one sentence Three independent forces, a hot jobs print, live Canadian tariffs, and a geopolitical oil premium, are pointing in the same direction, and until fresh data breaks the pattern, the path of least resistance for equities is lower.
The nearest variables with the power to shift that narrative are the PPI and CPI releases due this week, both feeding directly into the 16 September FOMC decision. No single report resolves all three pressures at once, but an inflation reading that meaningfully undershoots consensus would give the market a real reason to reconsider whether that meeting delivers a hike or a hold.
Knowing which release carries the most weight puts you in a position to interpret market moves as they happen, rather than reacting to headlines after sentiment has already turned.
This article is for informational purposes only and should not be considered financial advice. Investors should conduct their own research and consult with financial professionals before making investment decisions. Past performance does not guarantee future results, and forward-looking statements are speculative and subject to change based on market developments.