NextDC spent A$9.2 billion building its data centre business across 15 years. It is planning to spend A$8.9 billion in just the next two.
That single comparison frames the decision every NextDC investor now faces. The company’s FY2027 guidance, anchored by a 55% revenue growth target and a A$5.5 billion capital expenditure programme, is not a continuation of the prior growth trajectory. It is a step-change in scale, funded by one of the most complex capital structures on the ASX, and underwritten by a bet that AI and hyperscale compute demand remains structurally elevated for years, not quarters.
The question is whether the growth story justifies the complexity underneath it. Here is a framework for deciding whether NextDC’s current discount to Morningstar’s fair value represents an entry point worth taking, or a fair reflection of the risks you are being asked to absorb.
What the FY2026 numbers actually tell you before the FY2027 excitement takes hold
Start with what is already in the books. NextDC delivered FY2026 net revenue of approximately A$405 million, up 16% year on year, and underlying EBITDA (earnings before interest, taxes, depreciation, and amortisation) of approximately A$248.8 million, up 15%. Both figures came in above prior guidance.
Solid, but not exceptional. A 16% revenue growth rate from a company valued as a high-growth infrastructure name is the launchpad, not the story. The story sits in the order book.
FY2026 was the largest contracting year in NextDC’s history: 495 MW of new contracts signed. That activity is what mechanically drives everything investors are now being asked to underwrite in FY2027.
| Metric | FY2026 value | Year-on-year change | Analyst significance |
|---|---|---|---|
| Net revenue | ~A$405 million | +16% | Above guidance; solid but not the headline |
| Underlying EBITDA | ~A$248.8 million | +15% | Margins stable; operating leverage not yet visible |
| Billing utilisation | 175 MW | N/A | Current revenue-generating capacity |
| Built capacity | ~288 MW | N/A | Infrastructure operational at period end |
| Contracted utilisation (pro forma) | ~740 MW | N/A | Sold capacity, including unbuilt |
| Forward order book | 565 MW | N/A | Revenue pipeline yet to convert to billing |
The pipeline gap: NextDC had ~740 MW of contracted utilisation at 30 June 2026 against just ~288 MW of built capacity. That gap is not a risk signal. It is the revenue pipeline, and understanding the distinction is the first step to evaluating whether the FY2027 guidance is credible.
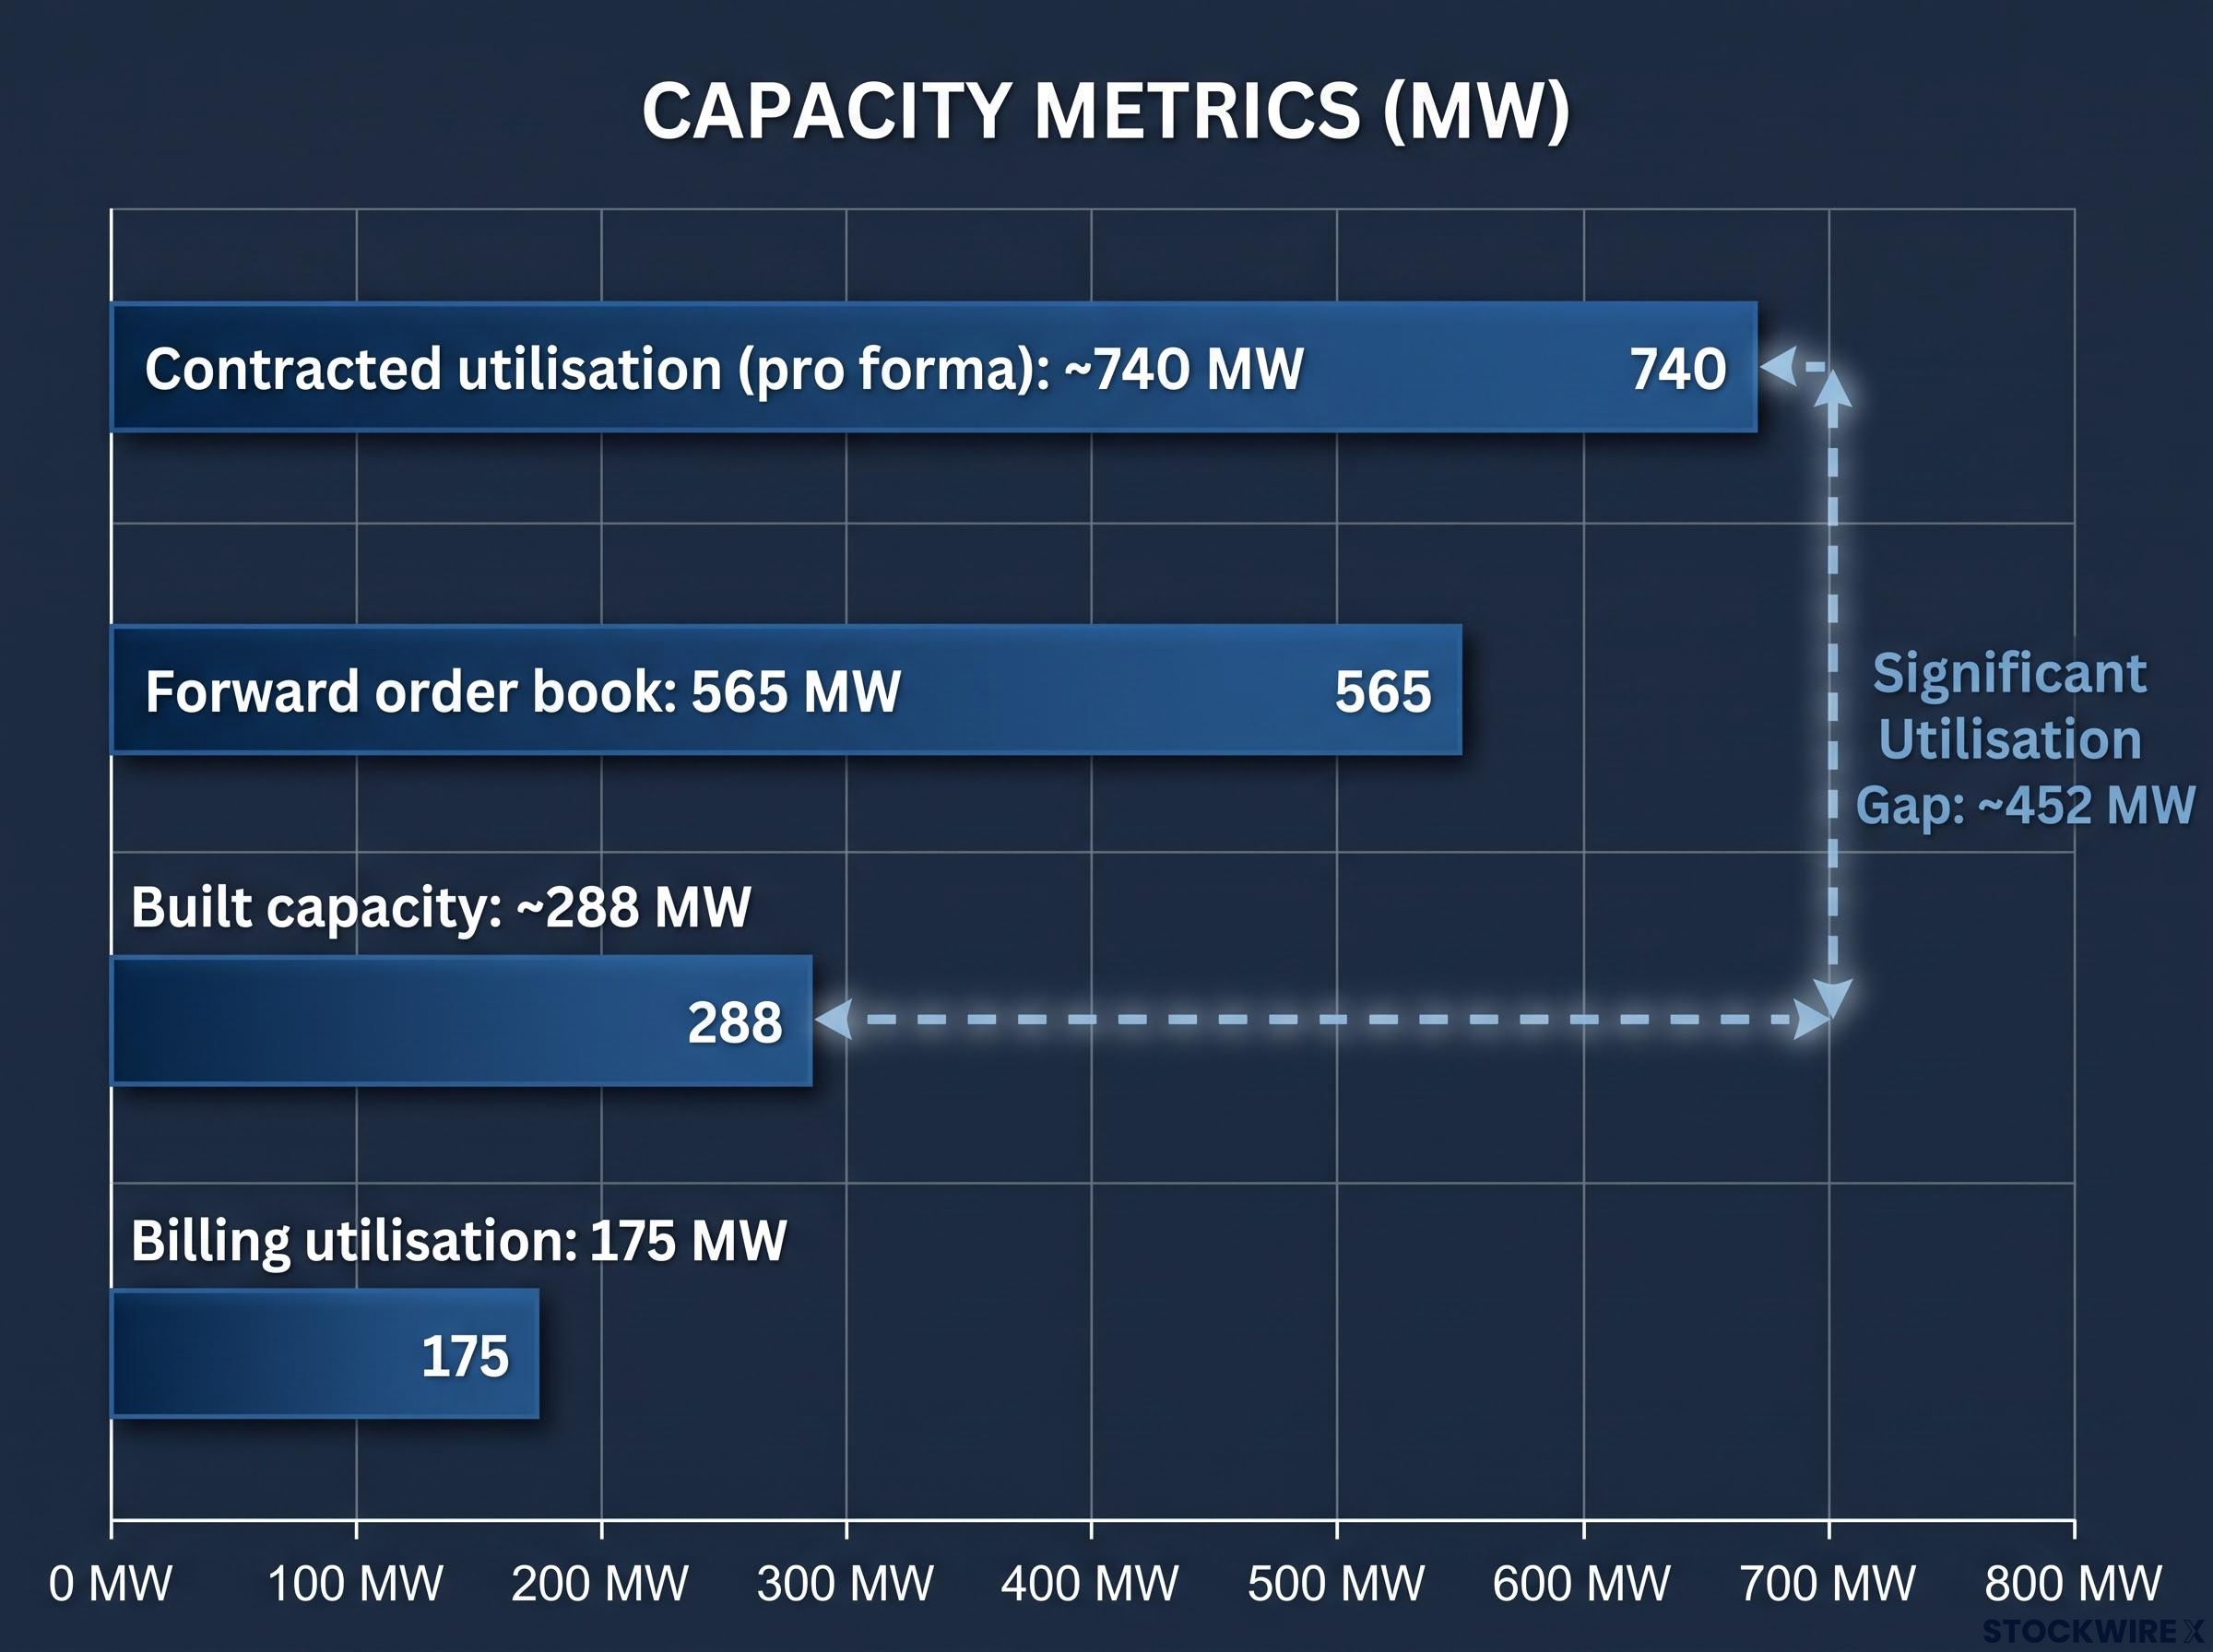
Investors who read FY2026 as a mediocre result are looking at the wrong line. The record contracting activity and the order book gap to built capacity are the actual analytical inputs.
When big ASX news breaks, our subscribers know first
Why FY2027 revenue is growing at 55% and whether that growth is real
FY2027 revenue guidance of over 50% growth, characterised by analyst coverage as approximately 55%, is a number large enough to invite scepticism. So is the projected ~60% EBITDA growth. The question is whether these figures represent aspiration or arithmetic.
The key drivers of the FY2027 revenue step-change are:
- Conversion of the existing 565 MW forward order book into billable revenue as contracted capacity comes online
- New data centre capacity reaching operational status within the fiscal year
- Operating leverage on a largely fixed-cost asset base, amplifying EBITDA growth relative to revenue
- Morningstar’s revenue forecasts for FY2027 onward were lifted by 6-7%, with the enlarged order book and stronger contracted utilisation underpinning the revision
The 565 MW order book is anticipated to shift predominantly into billable revenue across the two years that follow 30 June 2026. That makes the FY2027 step-change near-certain in character rather than aspirational. This is predominantly a monetisation exercise, not a speculative demand call.
Hyperscale demand at the scale NextDC is betting on has a measurable demand-side anchor: the four largest US hyperscalers collectively spent $130 billion on AI capital expenditure in Q1 2026 alone, with full-year 2026 combined guidance reaching approximately $725 billion and a $1 trillion annual run rate trajectory forming for 2027.
The operating leverage case: why EBITDA grows faster than revenue
Data centres are fixed-cost assets. Once a facility is built and powered, the incremental cost of filling contracted capacity with billable customers is marginal relative to the revenue it generates. When contracted capacity converts to billing on this kind of asset base, EBITDA grows disproportionately faster than revenue.
That is the source of analyst confidence in the ~60% EBITDA growth figure. It tells you more about the quality of the revenue growth than the 55% headline does. Operating leverage at this scale, on contracted capacity, is the signal that the growth is structural rather than promotional.
Understanding this distinction materially changes the risk profile. Contracted revenue converting to billing is a categorically different kind of growth from consensus-dependent revenue projections.
How to read NextDC’s capital structure without losing the thread
The growth story is visible. The capital structure is where the complexity lives. Across FY2026, NextDC assembled a total of A$9.75 billion in new capital, a remarkable sum for any company on the ASX.
| Instrument | Amount (A$ billion) | Structural note |
|---|---|---|
| Senior debt | $5.8 | Upsized; lowest cost of capital in the stack |
| Subordinated notes | $0.75 | Higher cost; introduces call-feature risk |
| Hybrid securities | $1.7 | Higher cost; call-feature risk; equity-like at the margin |
| Equity | $1.5 | Raised below prior fair value estimates |
The equity component is the detail that matters most for existing shareholders. It was raised at prices below prior valuation estimates, and that is the primary mechanical reason Morningstar reduced its fair value estimate from A$17.00 to A$15.60. Not a reduction in business confidence. A dilution adjustment.
The hybrid securities raise that triggered NextDC’s 21.6% share price surge in April 2026 is directly connected to the instrument complexity discussed here: that raise introduced A$1.7 billion in non-dilutive capital at a fixed coupon, preserving ordinary shareholder positions while adding a higher-cost layer to the stack.
FY2027 capex guidance sits at A$5.25-A$5.75 billion, with a midpoint of A$5.5 billion. Approximately A$500 million of that total relates to reimbursable customer fitout, which is economically distinct from NextDC’s net capital commitment. Prior estimates had pegged FY2027 capex at A$4.0 billion, so the revision represents a significant uplift.
The scale in context: Combined FY2026 actual capex and FY2027 midpoint guidance totals approximately A$8.9 billion in two years. From its founding in 2011 through to the end of the prior period, NextDC deployed a cumulative A$9.2 billion in capital to build the business it has today.
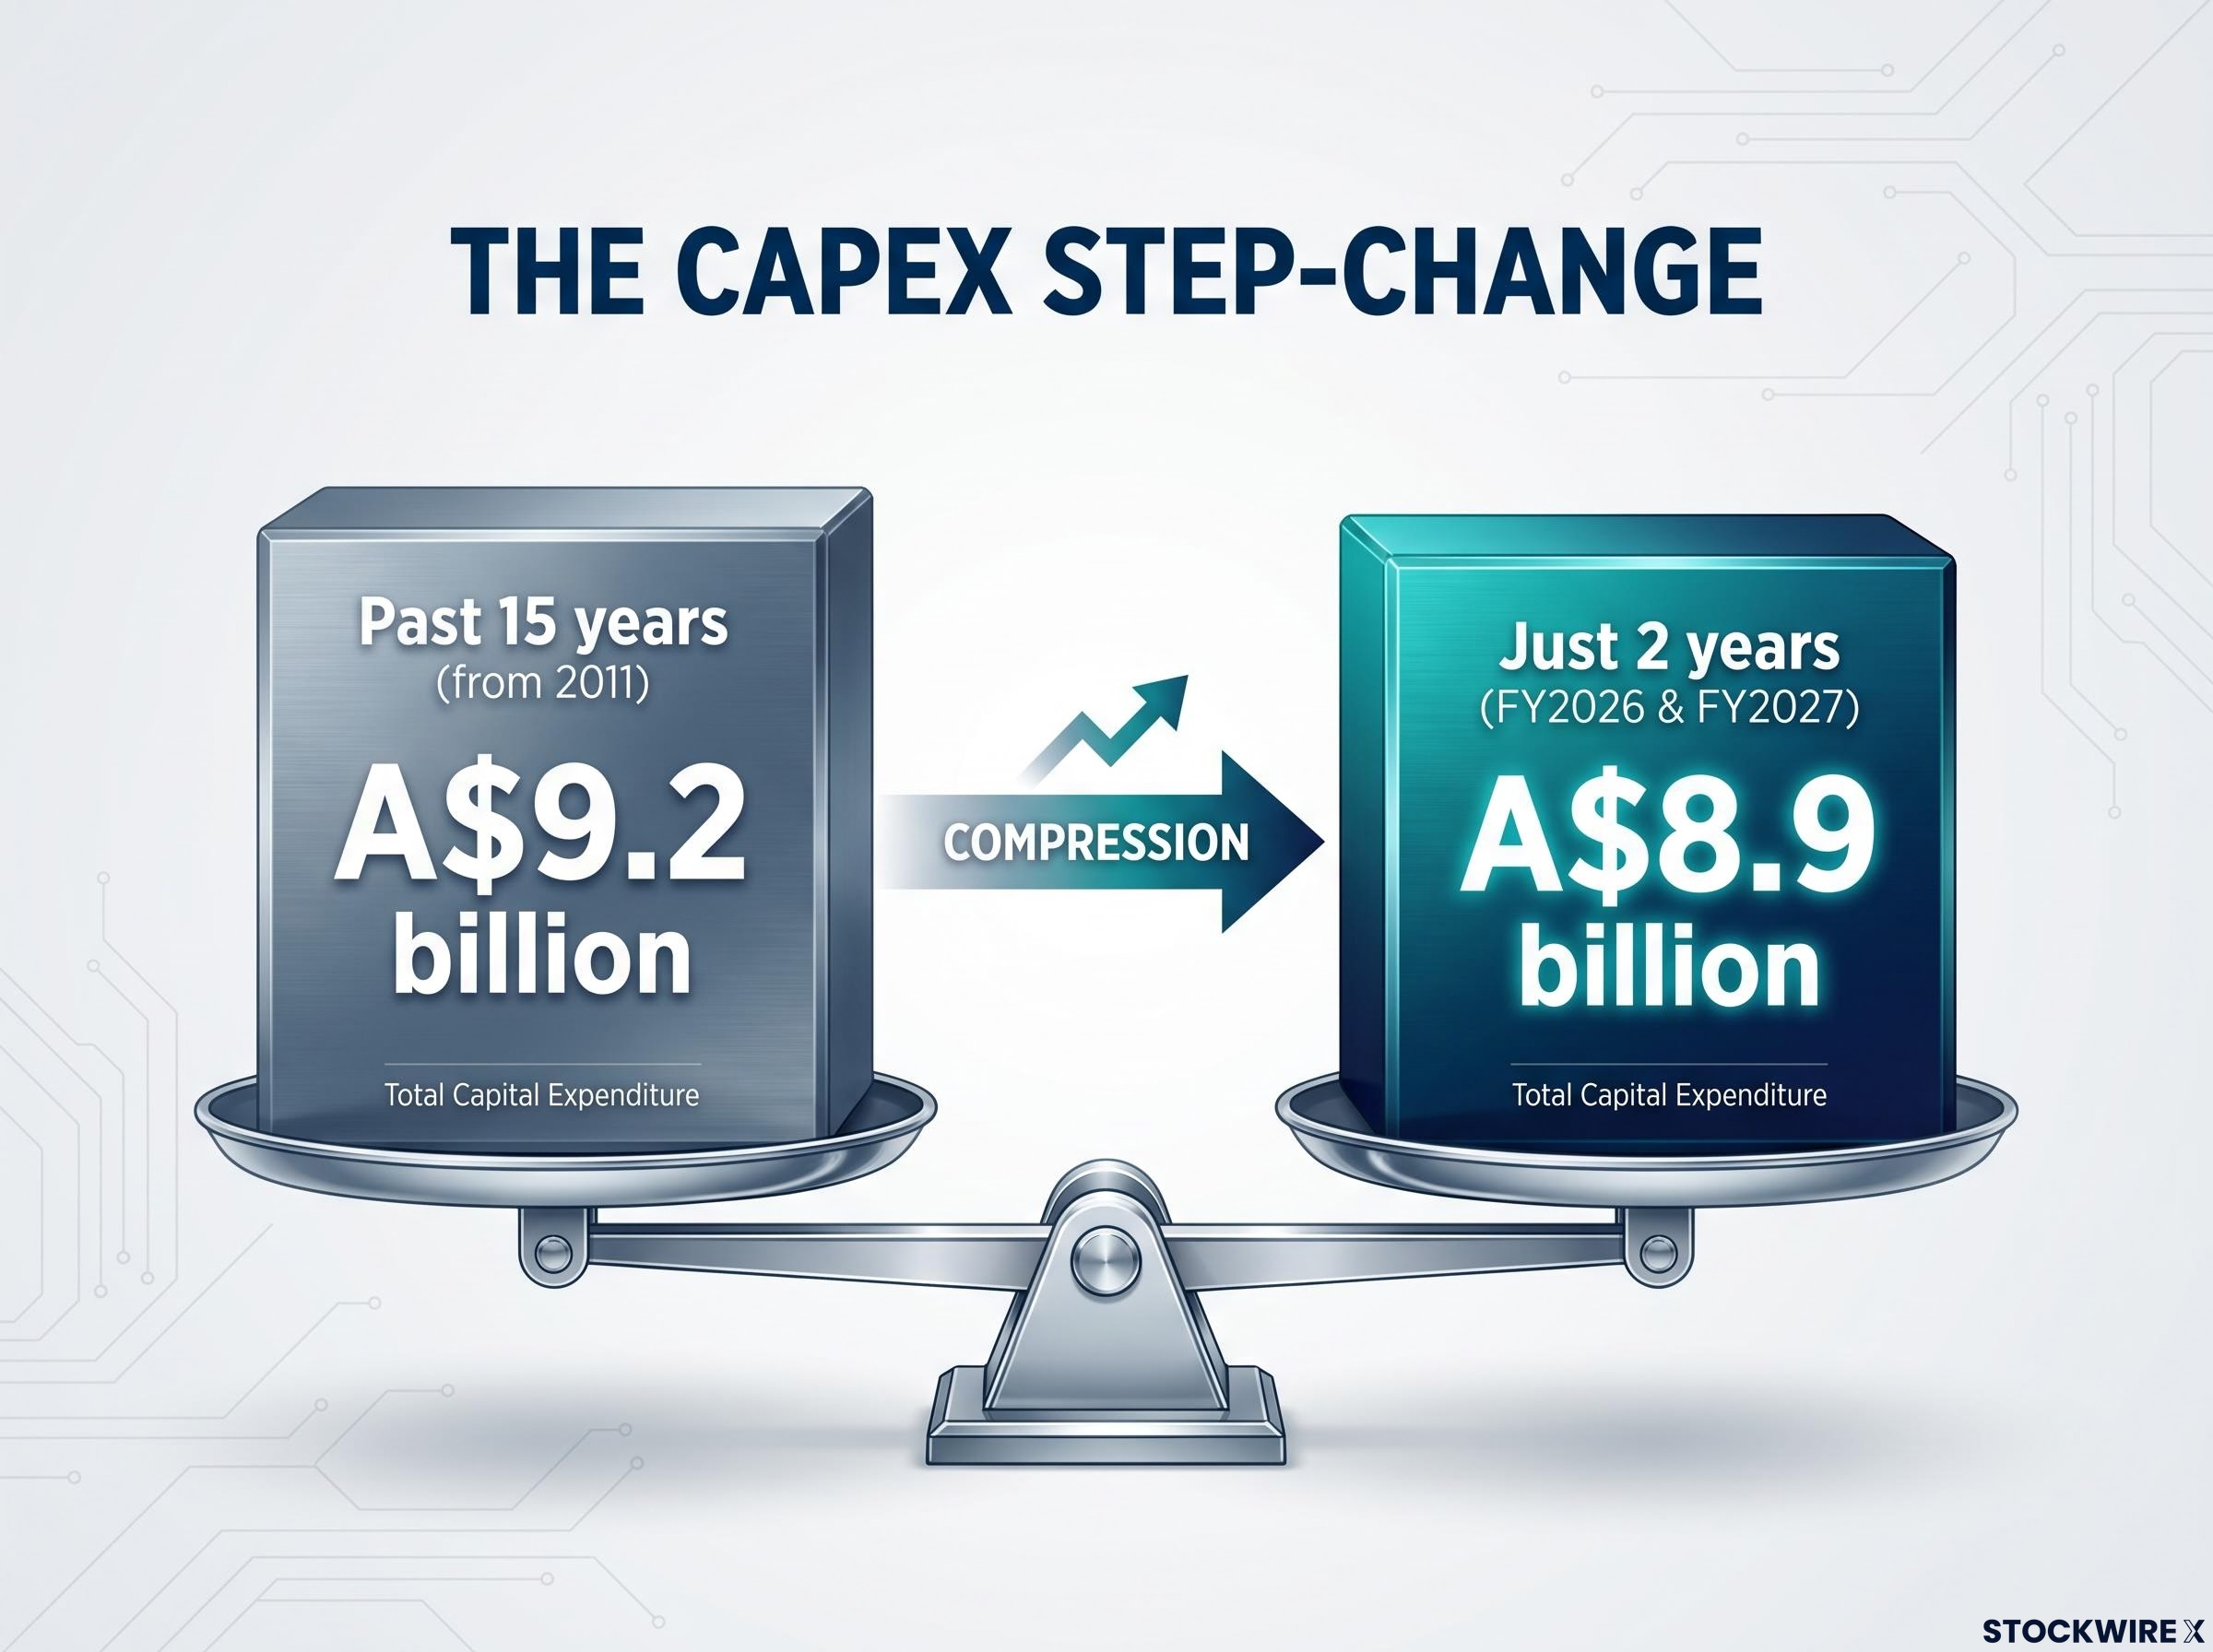
That comparison is not a warning sign by itself. But it tells you the capital cycle is front-loaded at a scale that requires investors to hold through sustained complexity, not dip in and out. Joint venture structures and capital recycling arrangements remain potential levers to reduce net funding outflows, though specific terms are still evolving.
Investors who engage only with the revenue story and skip the capital structure are taking on instrument complexity, refinancing exposure, and dilution risk without pricing it. This section is where the risk profile lives.
Assessing the current entry point relative to fair value
Morningstar analyst Dan Baker, in a valuation update published 1 September 2026, revised NextDC’s fair value estimate to A$15.60 per share, down from A$17.00. The current reference price of approximately A$13.81 implies an 11-12% discount.
The fair value reduction was mechanically driven by dilution from below-fair-value equity issuance. Morningstar simultaneously raised its revenue forecasts for FY2027 onward by 6-7%, reflecting the enlarged order book and stronger contracted utilisation. The business assessment improved; the per-share maths moved the other way.
So what does the 11-12% discount actually represent? Modest upside with limited margin of safety. Not a deep value opportunity. Not fully priced either. At roughly 2.4 times book value, the market’s current pricing reflects a degree of confidence in NextDC’s asset deployment trajectory, though it does not account for the volume of capital still required to execute the programme.
The cash flow reality: Over the five years to FY2026, NextDC’s cumulative free cash flow came to roughly negative A$6.8 billion, driven by the capital intensity of its build programme. Morningstar forecasts an additional ~A$7.9 billion in free cash outflow across the following four years.
For the Morningstar upside to be realised, three conditions must hold:
- Successful conversion of the order book within the projected timeline
- AI and hyperscale demand continuity at structurally elevated levels
- No material equity dilution beyond current guidance
The 11-12% discount to fair value is meaningful only if you intend to hold long enough for the order book conversion to show up in revenue. If your investment horizon does not match the conversion window, the discount is less relevant than it appears on paper.
Five risks that could close the gap between the thesis and the outcome
The growth is contracted. The capital is committed. The risks are specific, and they interact with each other across the duration of the build programme.
- Execution risk: Scaling annual capex from A$3.4 billion (FY2026 actual) to A$5.25-A$5.75 billion (FY2027 guidance) requires project delivery capability that is difficult to compress in time. Construction timelines, supply chain coordination, and workforce capacity all become binding constraints at this rate of acceleration.
- Demand risk: The entire thesis rests on AI and hyperscale demand remaining structurally elevated. This is not a marginal assumption; it is the structural foundation. A moderation in demand growth, even a partial one, would impair the return profile materially rather than incrementally.
The Australian data centre market context matters here because grid access bottlenecks, not just demand levels, determine whether NextDC’s contracted-to-billed conversion timeline holds: approximately 300 live projects are already straining grid connection processes, and operators without existing transmission relationships face extended delivery timelines that compound execution risk.
Capital-specific risks for equity holders
The remaining three risks form a coherent group because they interact with each other across the duration of the build programme.
- Funding and refinancing risk: The multi-instrument capital stack, spanning senior debt, hybrids (A$1.7 billion), and subordinated notes (A$750 million), introduces cost-of-capital and refinancing exposure across a long-duration build. Higher-cost instruments carry call features that add optionality risk.
- Dilution risk: Equity investors face further dilution if capex or cost assumptions diverge from plan. Prior raises were executed at prices below Morningstar’s then-fair value of A$17.00, contributing directly to the reduction to A$15.60.
- Credit market risk: Tighter credit conditions would increase both the cost and the availability of the debt instruments underpinning the programme.
These risks are not hypothetical. They are the precise conditions under which the 11-12% discount to Morningstar fair value would prove insufficient as a margin of safety rather than an entry opportunity.
Making a considered call on NextDC in a high-capex, high-conviction environment
The analytical thread is straightforward once you assemble it. The growth is contracted and visible: ~740 MW of contracted utilisation against ~288 MW of built capacity. The capital structure is complex and front-loaded: ~A$8.9 billion in two years. The valuation discount is modest rather than deep: 11-12% below Morningstar’s A$15.60 fair value. Capital recycling and joint venture optionality remain potential positive variables not yet fully priced.
The appropriate investor profile is narrow but genuine. Before taking or adding a position, honestly assess whether you satisfy these conditions:
- A long investment horizon that extends through the order book conversion window and beyond the projected ~A$7.9 billion in free cash outflow over the next four years
- Comfort with sustained negative free cash flow across multiple fiscal years
- Familiarity with leverage and instrument complexity, including the possibility of further equity raises
The condition that makes or breaks the thesis is whether AI and hyperscale demand remains structurally elevated through the conversion window, and whether the return on the A$5.5 billion capex cycle begins to show up in return-on-invested-capital metrics. If it does, the current discount looks like a genuine entry point. If it does not, the margin of safety was never wide enough.
For investors wanting exposure to Australia’s data centre buildout with lower capital structure complexity than NextDC carries, our dedicated guide to ASX data centre picks-and-shovels stocks examines the electrical infrastructure names capturing revenue from the same AU$26 billion construction wave without the dilution and refinancing risk of operating a hyperscale colocation platform.
This article is for informational purposes only and should not be considered financial advice. Investors should conduct their own research and consult with financial professionals before making investment decisions. Past performance does not guarantee future results. Financial projections are subject to market conditions and various risk factors.