The tariff regime designed to contain China’s economic reach has, in measurable ways, accelerated Beijing’s ability to position itself as the more reliable trading partner. That is not a theoretical concern. It is showing up in trade-flow data, in allied supply-chain decisions, and in corporate investment surveys that tell a consistent story: the wall built to isolate China is redirecting traffic, not stopping it.
The pattern is observable and quantified. Bilateral US-China trade fell more than 25% by late 2025, yet China maintained a very large overall trade surplus by rerouting through third countries. Canada, facing US pressure over its trading relationships, moved toward closer economic arrangements with Beijing. A simultaneous internal administration rift over dollar policy is compressing the Treasury’s room to respond if conditions deteriorate further.
What follows is a framework for why diplomatic headlines from G20 summits and bilateral meetings have not been reliable signals for portfolio positioning, and which sector exposures deserve a structural policy-risk discount rather than a temporary one.
The tariff wall that opened a door for Beijing
The stated rationale for broad tariffs was geopolitical: constrain China’s economic influence by raising the cost of its goods and reducing its integration into Western supply chains. The structural mismatch is that the tariffs fell hardest not on China’s direct export flows to the United States, but on Canada, Mexico, Brazil, and the EU.
Steel tariffs are the sharpest illustration. When measured by volume imported into the United States, China places below the Netherlands in the ranking of steel suppliers. The tariff burden landed squarely on integrated allied supply chains, Canadian mills, Brazilian producers, Mexican manufacturers, while Chinese steel competition was largely unaffected. The policy instrument missed its stated target and hit the countries whose cooperation the broader China-containment strategy required.
That misdirection is not a detail for trade policy specialists. It tells you that the stated premise of the tariff regime does not match its structural impact. The policy risk in trade-exposed sectors is not resolving in the direction the official rationale implies; it is compounding in directions the rationale never accounted for.
Tariff pass-through costs have landed primarily on American households rather than on the exporting countries the tariffs nominally target, with one-year price data attributing an estimated $1,830 to $2,600 in added annual expenses per family to the 2025-2026 escalation and the St. Louis Fed embedding approximately 0.5 percentage points of annualised PCE inflation directly to tariff effects.
“Treating allied exports as security threats is a gift to Beijing, which is happy to present itself as a more reliable economic partner.”
Phillip W. Magness, Senior Fellow, Independent Institute
The incentive structure created by this approach pushed allies to seek alternatives. And those alternatives increasingly run through Beijing.
Canada’s pivot and what it signals about allied supply chains
The collapse of US-Canada trade talks was explained by Canadian negotiators as a consequence of Washington’s insistence on controlling which trading partners Canada could maintain relationships with, a condition widely read as targeting Beijing specifically.
Canada moved toward closer economic engagement with Beijing, including a reported arrangement under which Ottawa agreed to accept up to 49,000 Chinese electric vehicles in return for eased visa access for Chinese nationals travelling to Canada. That figure and the visa-concession terms were reported by Phillip W. Magness of the Independent Institute but have not been independently confirmed in public policy databases at the time of writing. The broader pattern, however, is well-grounded in observed trade flows and expert commentary.
The 50% tariff activation on $20 billion in Canadian imports, bypassing USMCA protections entirely, is the sharpest recent illustration of allied supply-chain restructuring accelerating beyond the point where a simple tariff reversal restores prior arrangements.
If confirmed at the reported scale, the deal represents exactly the category of realignment the tariff regime was designed to forestall. The structural incentive for other allies facing US tariff pressure to deepen ties with Beijing is not unique to Canada. It is a general consequence of the policy architecture.
When big ASX news breaks, our subscribers know first
Administration rift on dollar strategy
Beyond the trade-flow consequences, a lesser-known dimension of the risk picture is emerging inside the administration itself: a disagreement over the dollar that narrows the Treasury’s room to manoeuvre at precisely the moment when more tools, not fewer, would be needed.
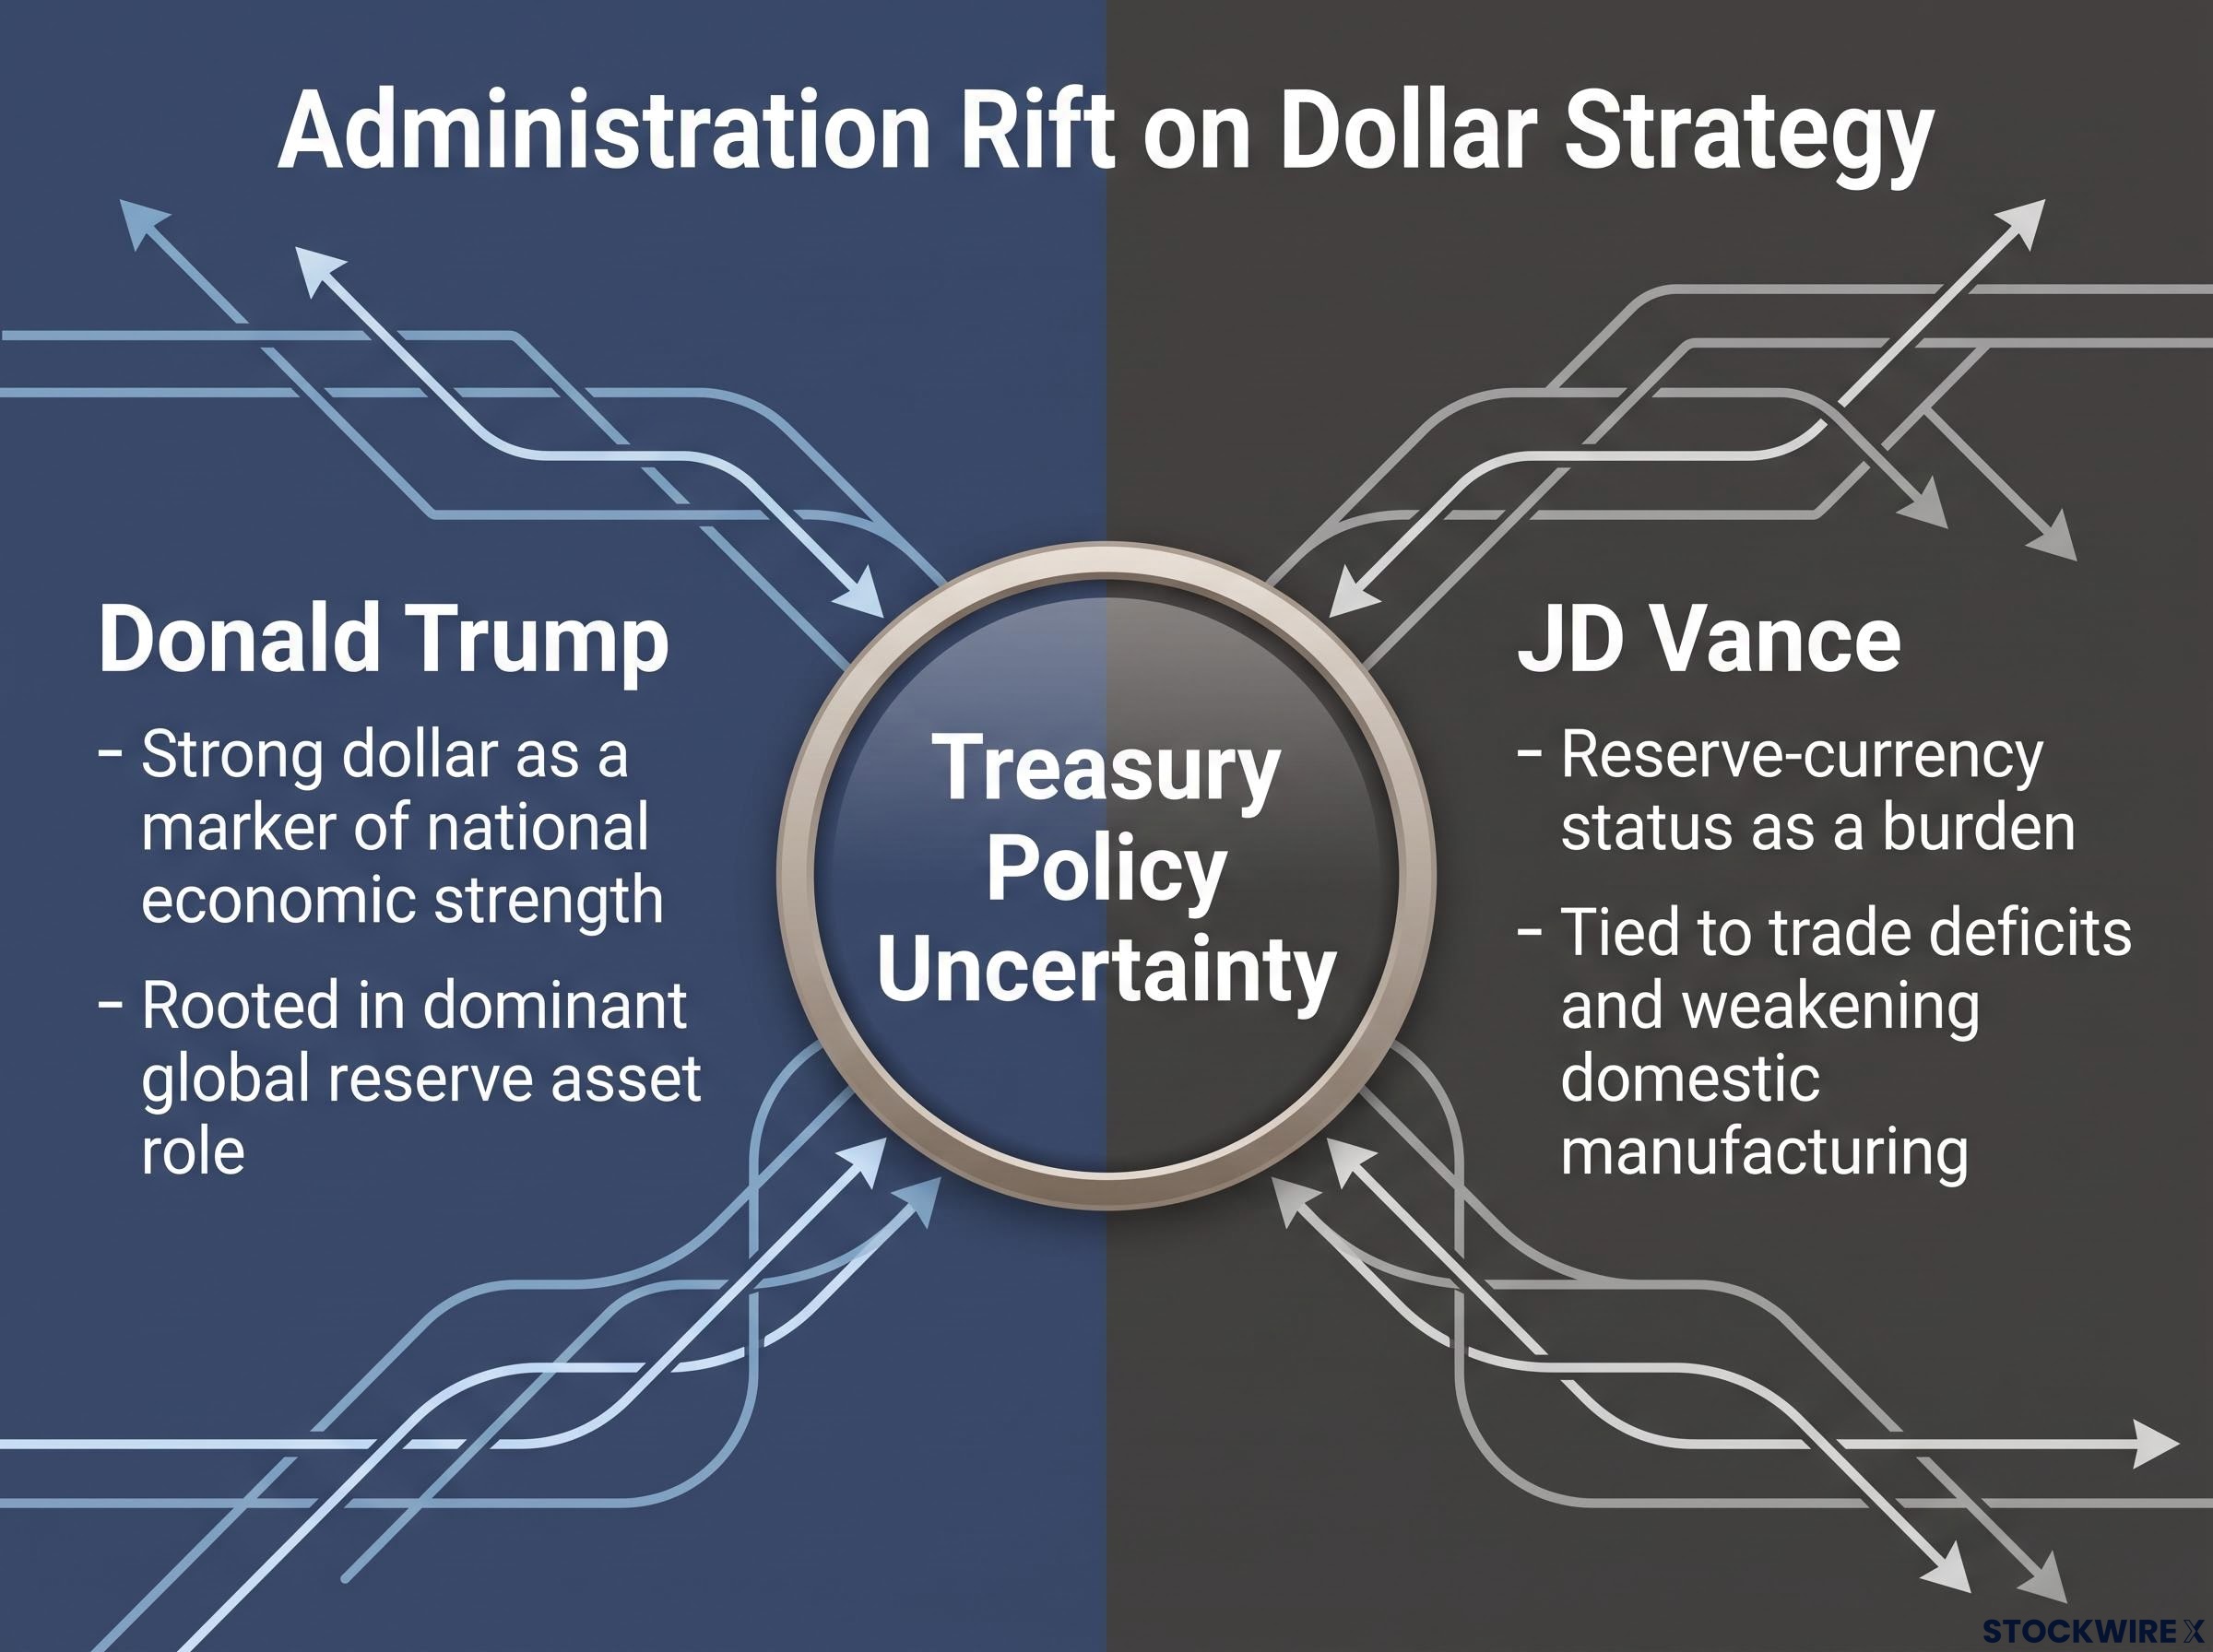
Donald Trump has consistently treated a strong dollar as a marker of national economic strength, a position rooted in the currency’s role as the dominant global reserve asset. Vice President JD Vance takes a sharply different view, characterising reserve-currency status as a burden rather than a benefit and attributing persistent trade deficits and the weakening of domestic manufacturing to that very position.
The disagreement between Trump and Vance over dollar reserve status reflects a broader structural debate: central banks have turned net-negative on dollar allocations for the first time in the data series, US debt is on a legislated path toward 251% of GDP, and hedge funds now hold roughly $4 trillion in gross Treasury exposure, compressing the system’s tolerance for further policy shocks.
There is a long-standing academic argument that reserve-currency status can contribute to trade deficits and deindustrialisation. But concrete plans for deliberate managed depreciation are not documented in official Treasury statements or policy filings. The distinction between Vance’s publicly stated industrial policy views and any speculative positions on currency management matters for how you price this risk.
The investor-relevant implication is not that managed depreciation is likely in the near term. It is that the internal disagreement leaves the Treasury’s response toolkit ambiguous at a time when tariff-driven economic stress could require decisive intervention. According to Magness, the compounding of extended tariff policy missteps with unresolved internal divisions over dollar strategy has left the Treasury in a materially weaker position, with a reduced set of workable levers available if conditions deteriorate.
The asset classes most exposed to this scenario risk include:
- Emerging-market debt
- Commodity-linked equities
- Currency-sensitive exporters
- Dollar-denominated international holdings
What would confirm this risk is moving from debate to policy
The evidence bar investors should apply before treating dollar depreciation as a base-case is specific: official Treasury statements, documented policy filings, sustained currency intervention in FX markets, or coordinated signalling from both Trump and Vance.
G20 communiqués, bilateral summit announcements, and informal public statements from administration officials below the level of coordinated policy do not meet that bar. Vance’s documented industrial policy views should be distinguished clearly from any speculative or unconfirmed positions on currency management.
What the trade-flow data actually shows about decoupling
A more than 25% decline in bilateral US-China trade by late 2025 looks, on the surface, like the decoupling strategy working. The numbers underneath tell a different story.
China maintained a very large overall trade surplus by rerouting through third countries. It sharply reduced purchases of US oil and soybeans and increased purchases from Canada, Argentina, Uruguay, and Brazil. Large economies do not absorb tariff pressure; they build out alternative networks. The bilateral trade decline did not produce the clean separation the decoupling argument required. It produced a reorganisation that left China central to global supply chains, just less directly connected to the United States.
China’s export rerouting capacity is not a sign of fragility but of structural adaptability: semiconductor exports surged 111% year-on-year in May 2026 even as domestic consumer spending contracted, confirming that Beijing’s trade position strengthens in aggregate even when individual bilateral flows are disrupted.
Corporate behaviour confirms this is not a transitional dynamic. US companies operating in China reported record-low investment plans through 2026, citing both direct tariff effects and lost sales from Chinese customers switching to non-US suppliers. The market is already pricing in a structural shift.
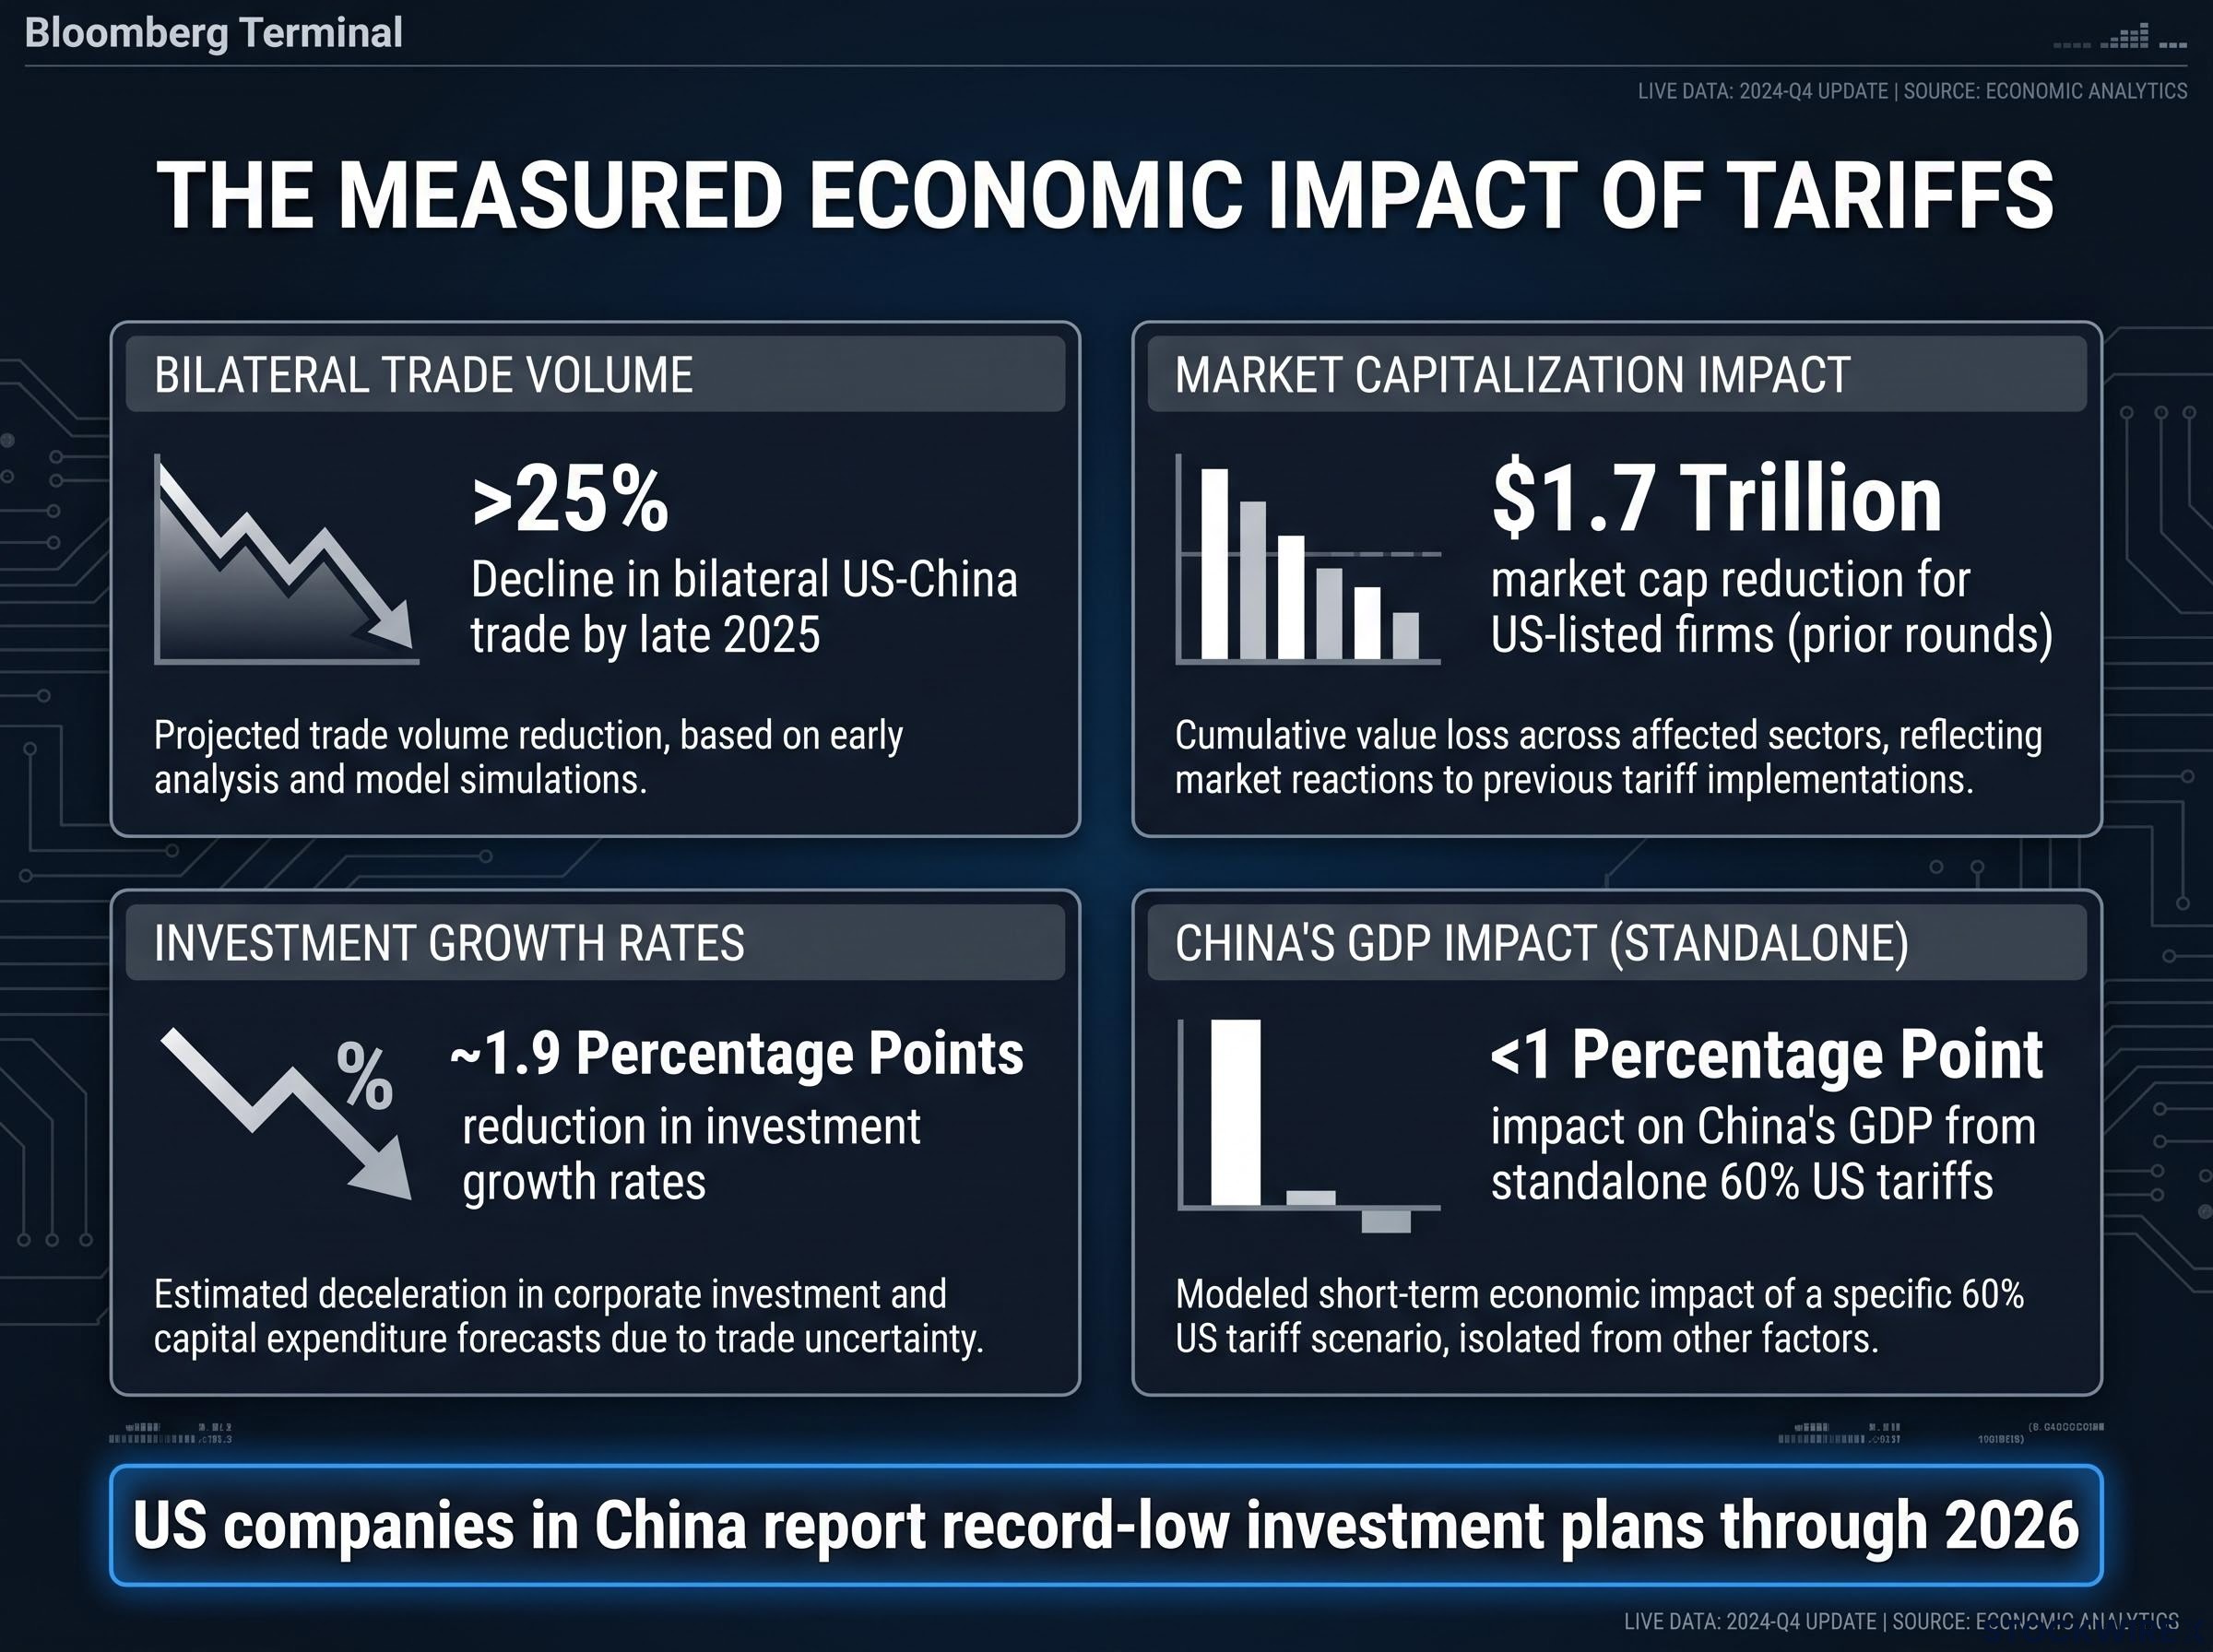
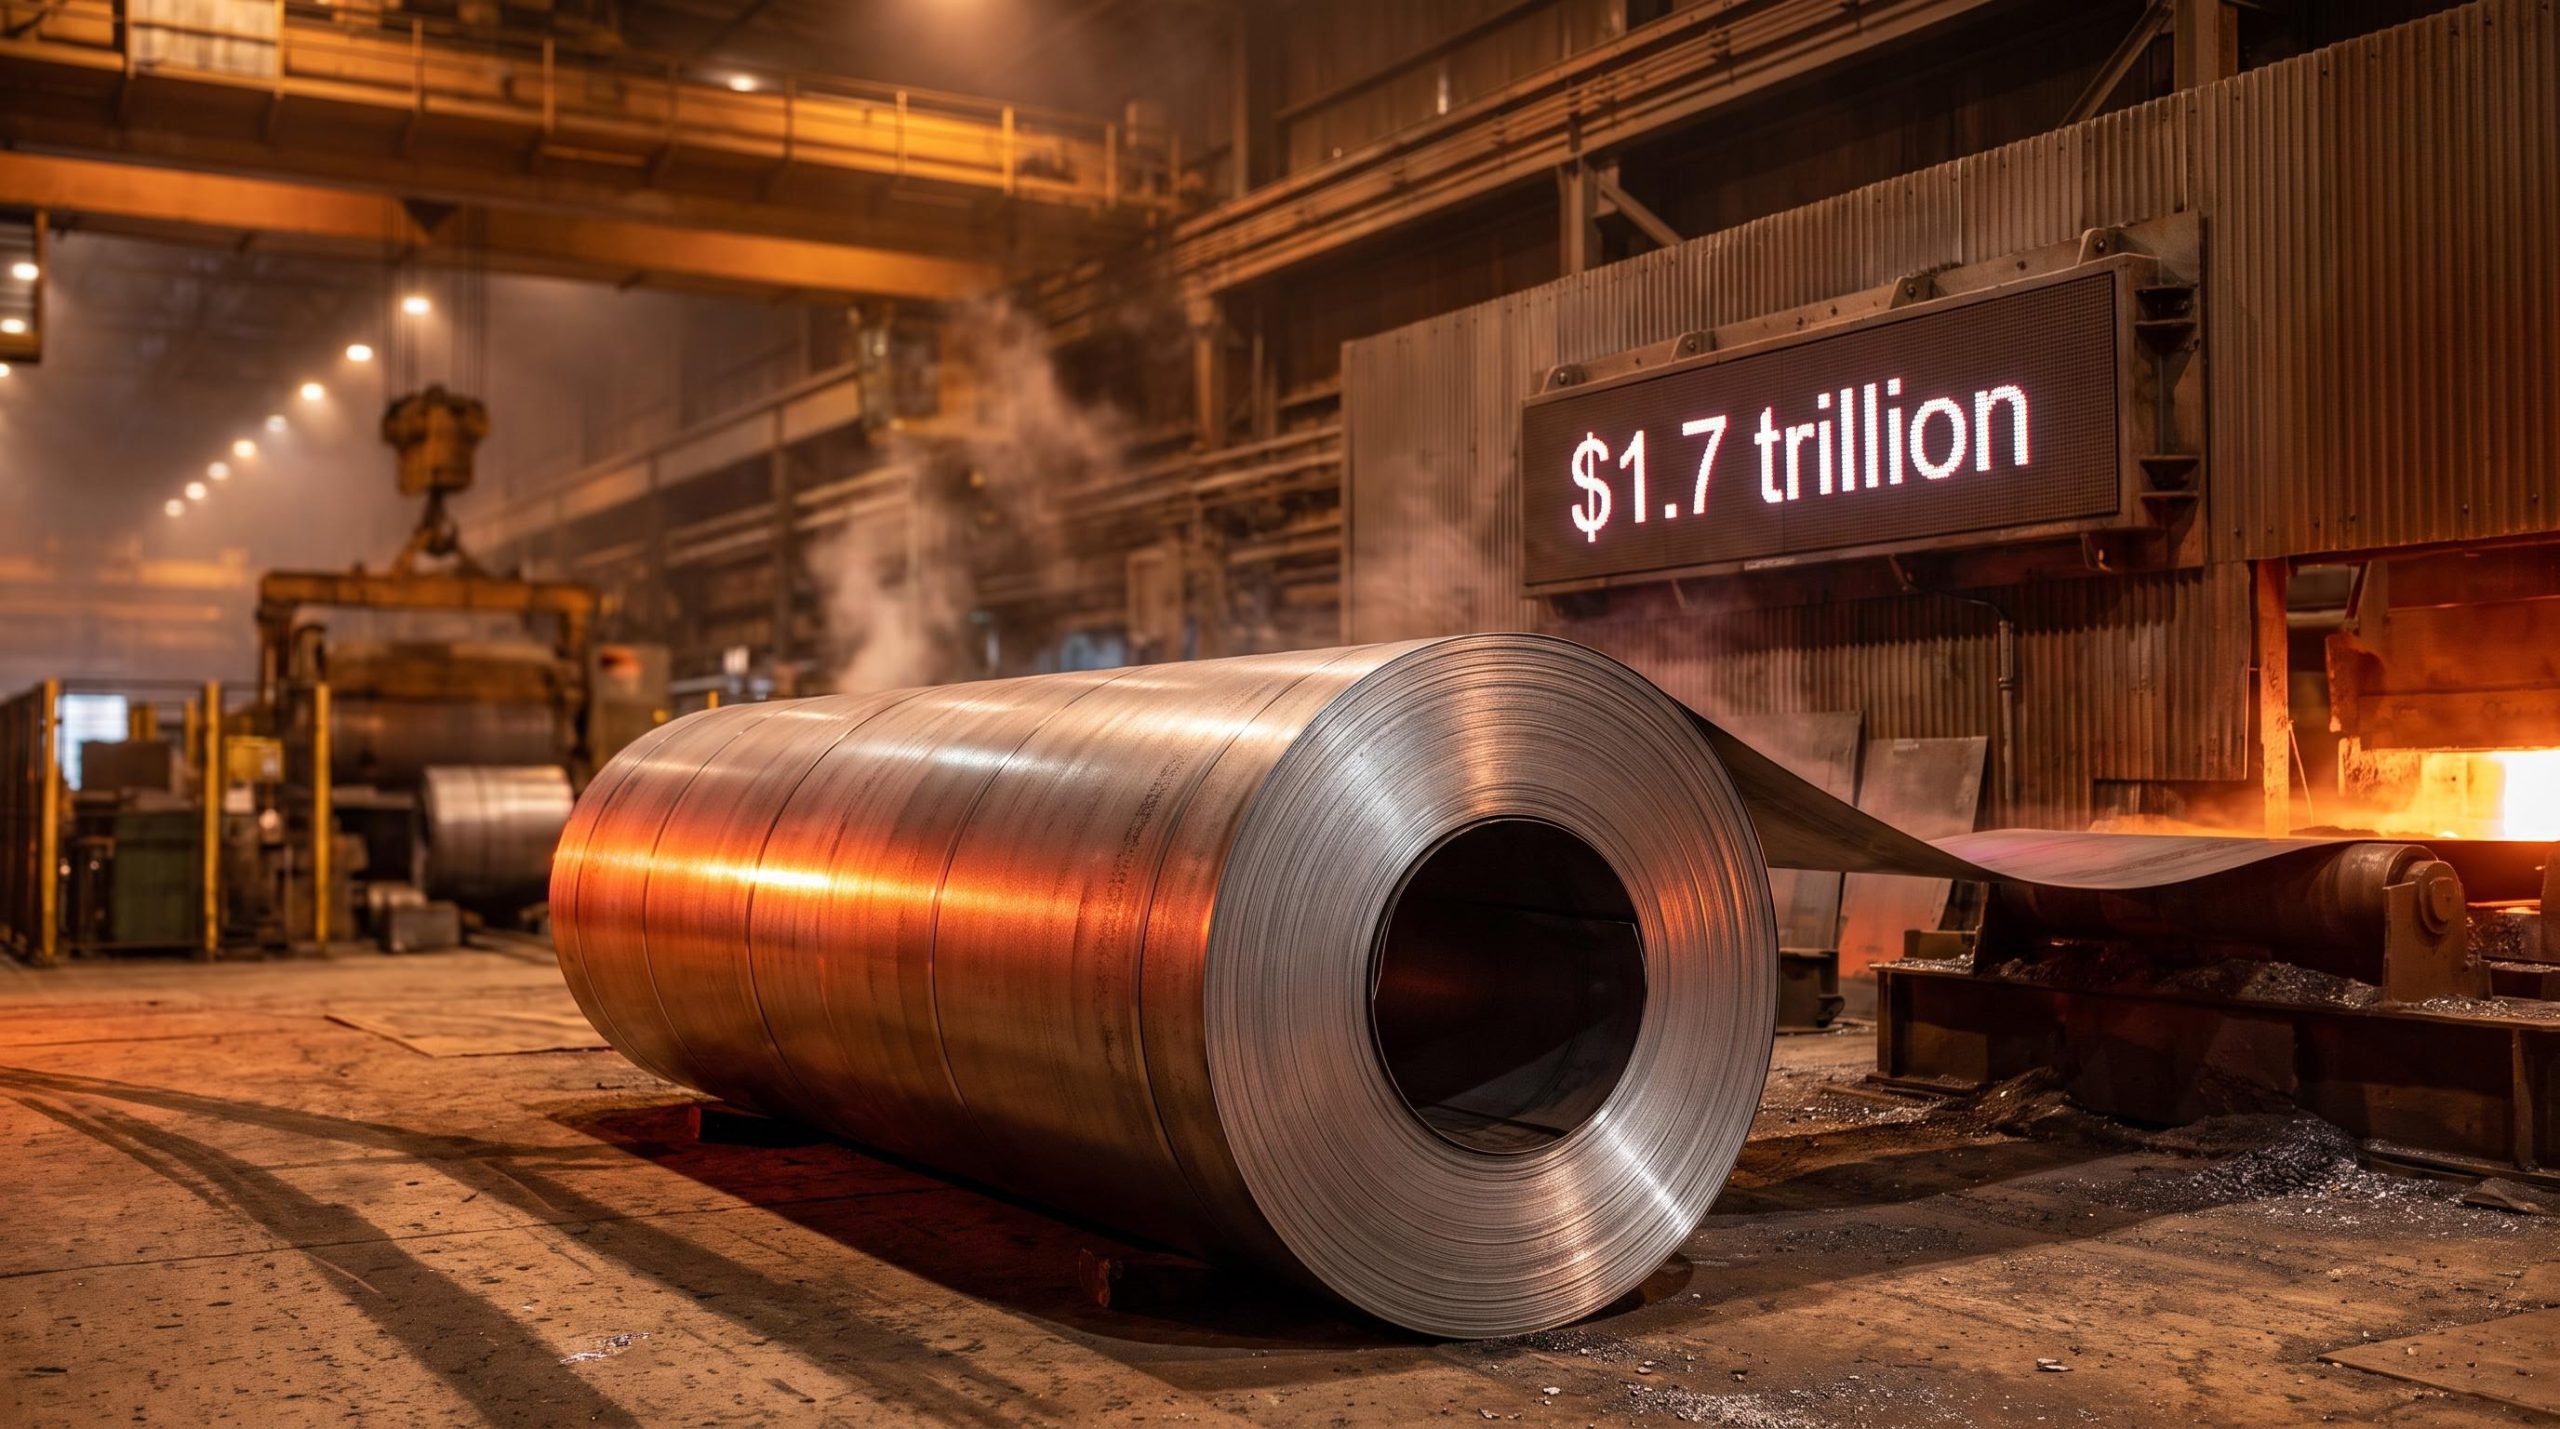
Prior tariff rounds reduced the market capitalisation of US-listed firms by an estimated $1.7 trillion and lowered investment growth rates by approximately 1.9 percentage points. Those earlier rounds were smaller in scale than what is currently in force.
That is your evidence that tariff uncertainty produces measurable, not theoretical, damage to portfolio value and corporate capital allocation.
NBER research on tariff announcements and stock prices published in July 2025 found that a one percentage point increase in applied tariffs was associated with a statistically significant decline in firm valuations, providing peer-reviewed grounding for the market capitalisation losses documented across prior tariff rounds.
| Metric | Figure | Context |
|---|---|---|
| Bilateral US-China trade decline | More than 25% | By late 2025; trade rerouted, not eliminated |
| US-listed firm market cap reduction | $1.7 trillion | Earlier tariff rounds; current rounds larger in scale |
| Investment growth rate reduction | ~1.9 percentage points | From tariff announcements and retaliation |
| China GDP impact from standalone 60% US tariffs | Less than 1 percentage point | Per macro research consensus; US acting alone |
The trade-flow evidence dismantles the assumption that a bilateral trade volume decline signals strategic progress. It signals supply-chain rerouting, with China retaining centrality. You need to evaluate trade-exposed positions against the actual diversion pattern, not the headline decoupling narrative.
Sector exposure and the policy-risk discount investors are underpricing
The sector damage mechanisms are specific and documented. Steel and metals tariffs disrupted allied supply chains without meaningfully constraining Chinese competition. Auto supply chains are being restructured in ways that reduce US manufacturers’ preferred-partner access, with the Canada-China EV arrangement illustrating exactly how. Industrials and construction face margin compression from tariff pass-through on top of interest rate sensitivity.
Tariff uncertainty alone, independent of actual tariff levels, has been documented as a cause of deferred capital expenditure across multiple sectors. Policy unpredictability is a cost in its own right.
| Sector | Primary tariff mechanism | Investor implication |
|---|---|---|
| Autos | Allied supply-chain restructuring; partner-access reduction | Preferred-partner networks narrowing; input cost volatility |
| Steel and metals | Tariffs on allied exporters; Chinese competition unaffected | Cost burden on US producers without competitive benefit |
| Industrials and construction | Tariff pass-through on inputs; capex deferral from uncertainty | Margin compression compounded by rate sensitivity |
| Energy and commodities | China redirecting purchases to non-US suppliers | US commodity producers losing Chinese demand to competitors |
The asymmetry between the modest constraint tariffs impose on China’s growth (less than one percentage point from standalone 60% tariffs, low single-digit cumulative impact over several years) and the substantial costs they impose on US producers and allied partners is the structural fact that matters. The policy instrument is hurting the side wielding it more than the target. That asymmetry should be embedded in sector valuations as a persistent feature, not a transitional one.
Past US-China negotiations have produced announcements that overstated underlying agreement while trade volumes continued to suffer. Treasury Secretary Scott Bessent has signalled an intention to put China’s trade terms on the G20 agenda, while at the same time pursuing Chinese cooperation on Iran sanctions enforcement, a dual objective that introduces compounding friction and makes any summit-level optimism an unreliable basis for repositioning.
Before adjusting sector positioning based on summit or diplomatic headlines, apply a higher evidence bar:
- Official documents or trade filings confirming policy changes
- Sustained trade-volume shifts maintained over multiple quarters
- Coordinated official statements reflecting actual implemented policy, not negotiating posture
What changes the calculus, and what probably does not
The conditions that would represent genuine structural change in the tariff risk environment are specific: a documented shift to rules-based tariff frameworks with allied partners, confirmed reductions in trade-exposed sector policy uncertainty, or credible coordinated currency policy signals from both Trump and Vance.
What does not meet that bar is equally specific. G20 announcements, bilateral meeting communiqués, and informal public statements from administration officials have historically overstated underlying agreement. The record shows that announcement optimism has repeatedly outpaced trade-volume reality. These are not reliable triggers for portfolio repositioning.
Signals that would indicate genuine structural change:
- Documented shift to rules-based, predictable tariff frameworks with allied partners
- Official coordinated statements on dollar policy from both Trump and Vance
- Sustained bilateral trade-volume recovery maintained over multiple quarters
Headline categories that should not trigger repositioning:
- G20 summit communiqués and joint statements
- Bilateral meeting announcements and diplomatic language
- Informal public comments from sub-cabinet officials
- Negotiation-posture signals without implementing documents
- State visit scheduling or cancellation
The alliance-reliability dimension compounds the timeline risk. The reorientation of allied supply chains toward China is not a one-cycle event that reverses cleanly when tariffs are adjusted. The trust and relationship capital lost with Canada and others took years to build and will take consistent policy to rebuild. That makes the investment implications longer-dated than a single tariff cycle.
According to Magness, the sustained period of tariff policy failure has progressively depleted the Treasury’s toolkit, leaving the window available for effective policy correction considerably narrower than the current pace of diplomatic engagement would suggest.
The analytical through-line of this piece resolves into a practical discipline: not permanent bearishness on trade-exposed sectors, but a higher evidence bar for when diplomatic and trade developments actually warrant adjusting your exposure. Until the policy architecture itself changes, the structural discount belongs in the valuation.
This article is for informational purposes only and should not be considered financial advice. Investors should conduct their own research and consult with financial professionals before making investment decisions. Forward-looking statements regarding tariff policy, dollar strategy, and trade-flow trajectories are speculative and subject to change based on policy developments, market conditions, and geopolitical dynamics.
—