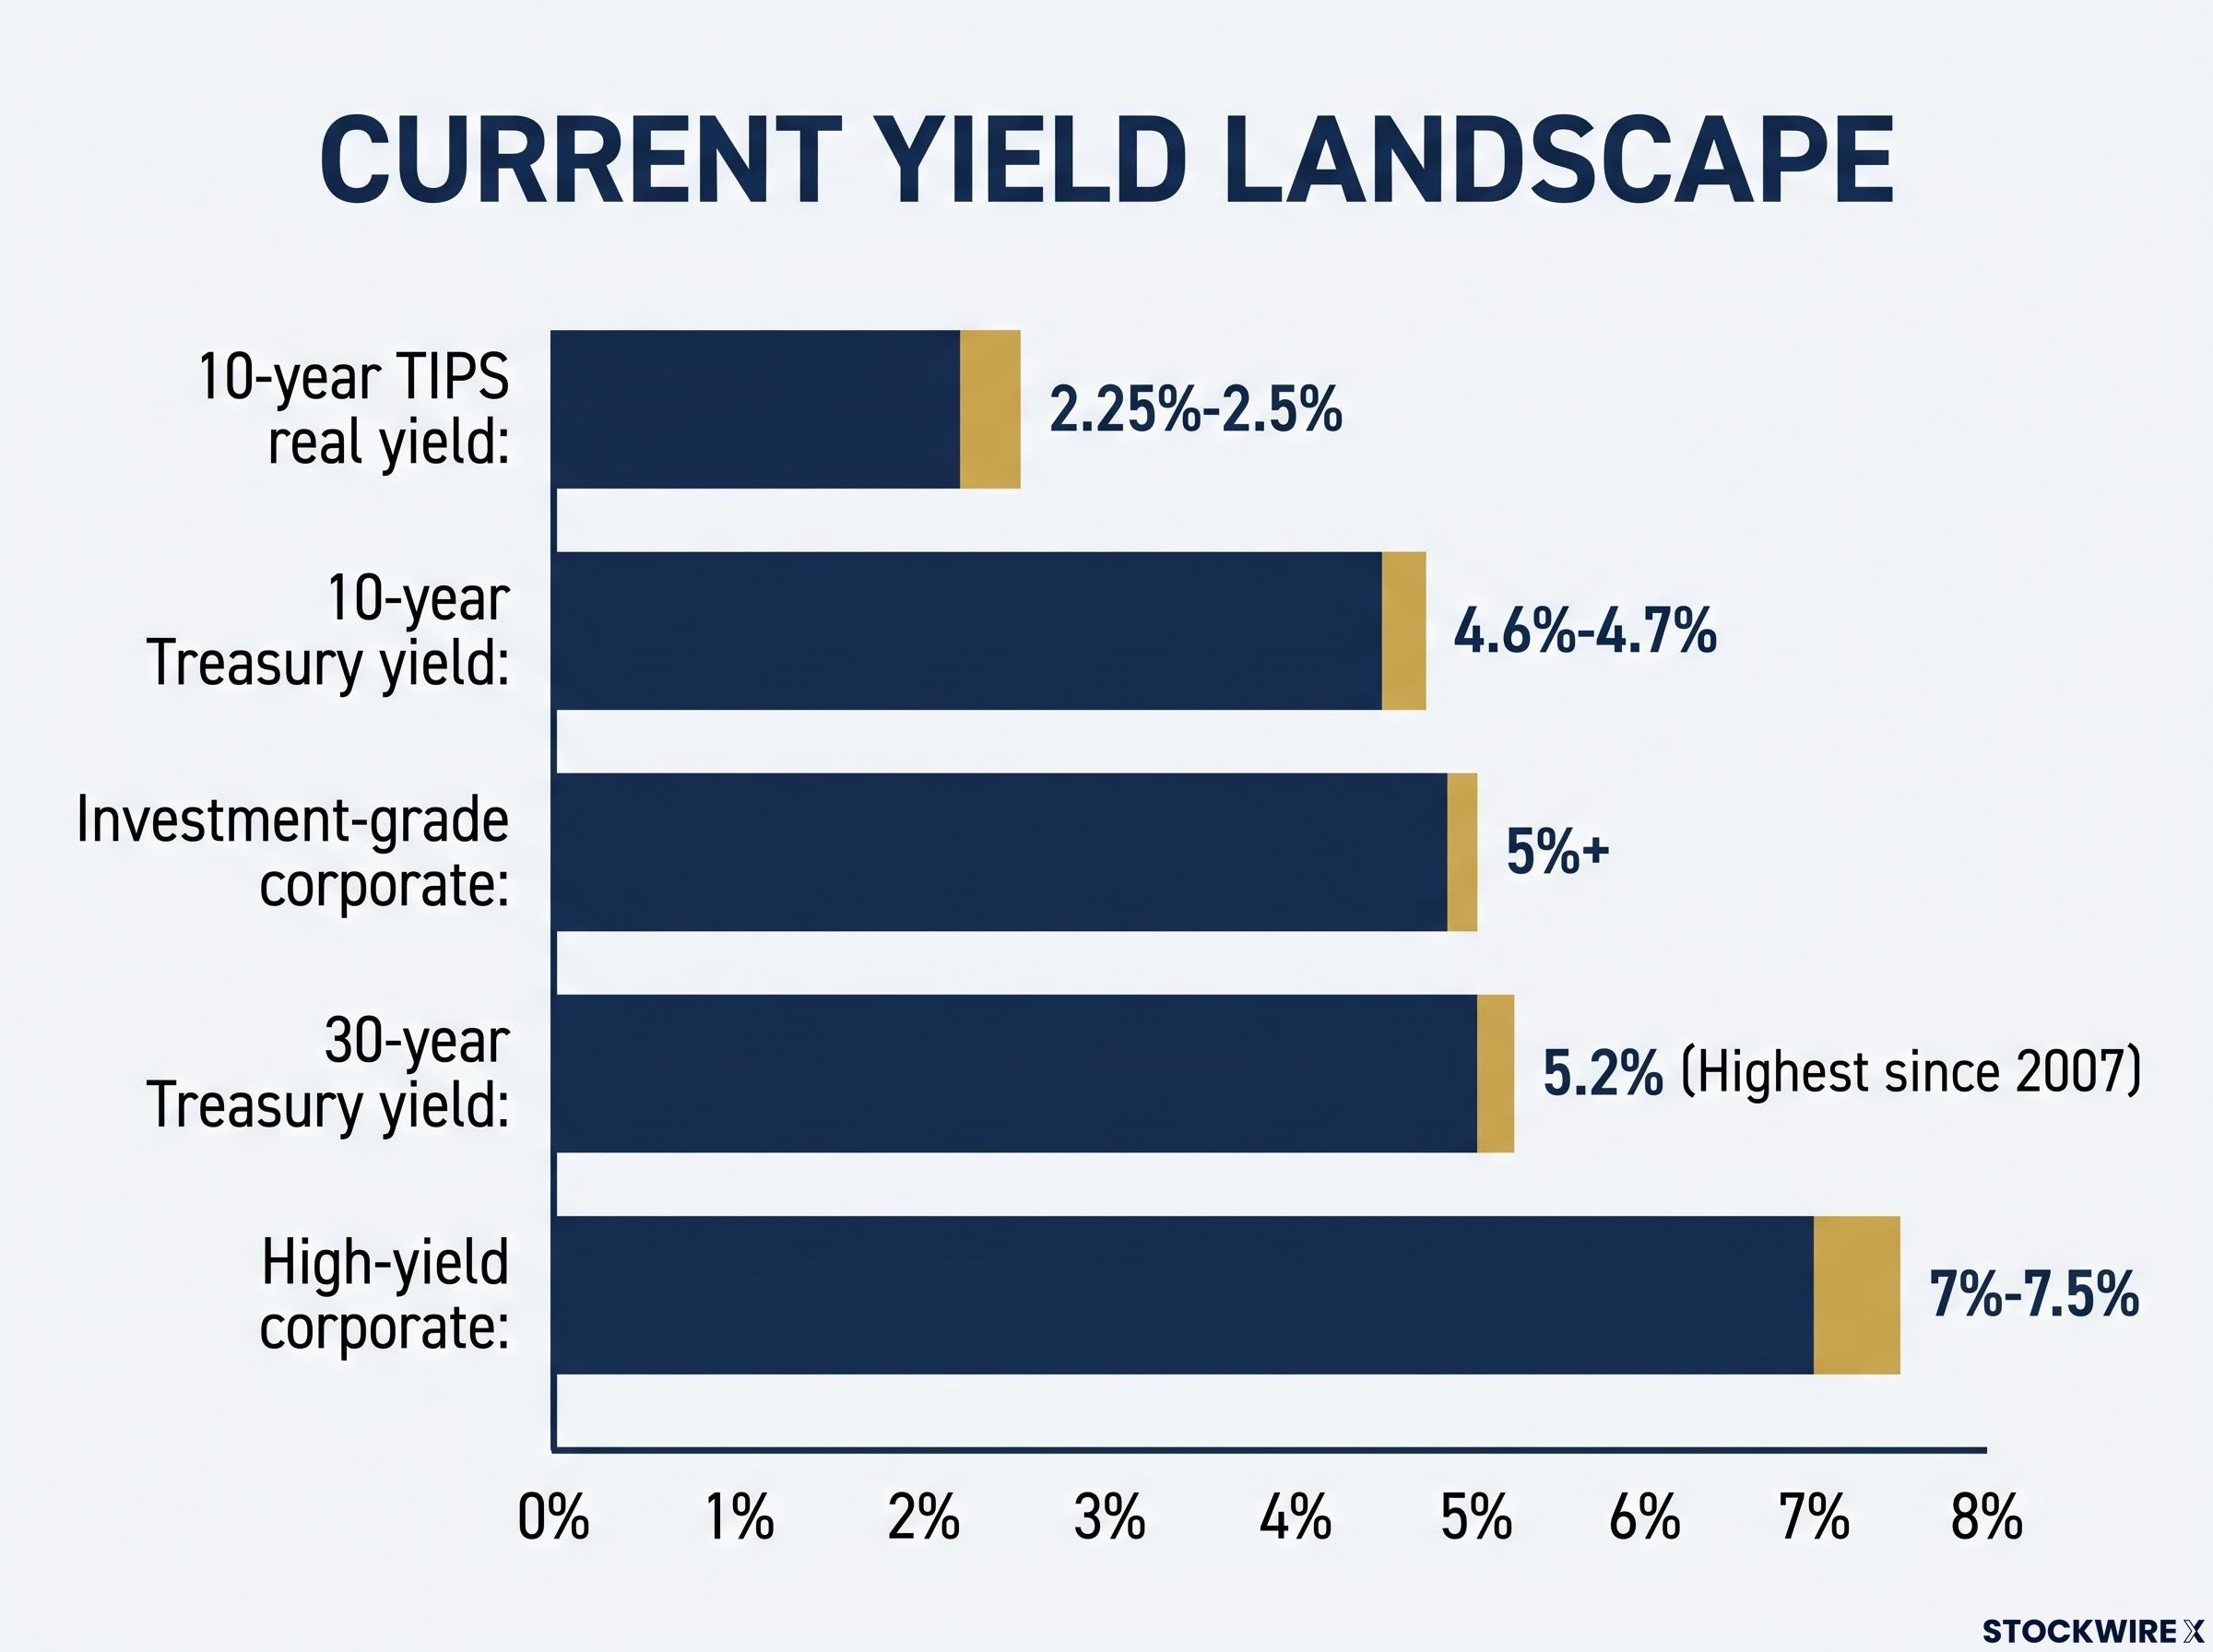
For most of the past decade, bonds were where returns went to die. That changed. The 10-year TIPS real yield now sits at approximately 2.25%-2.5%, and investment-grade corporate bonds yield north of 5%. If you dismissed fixed income after 2008 and never looked back, you may be sitting on the most mispriced opportunity in your portfolio right now.
This is not a normal bond market recovery. Inflation has remained above the Federal Reserve’s 2% target for more than 65 months. The 30-year Treasury touched 5.3% in 2026, its highest level since 2007. The case for owning bonds is no longer about speculating on rate cuts; it is about locking in real income before conditions shift. If you stay parked in cash, you face reinvestment risk the moment the Fed pivots. If you extend duration carelessly, you could absorb double-digit price losses should yields climb further.
Here is the framework for deciding where your next dollar belongs. This guide maps the fixed income spectrum, from TIPS to Treasuries to corporate credit, and closes with a concrete allocation structure you can begin applying immediately.
Why this bond market is genuinely different from the one you learned to ignore
If your instinct is still to treat bonds as dead money, the numbers deserve a fresh look. The yield environment has shifted structurally, not incrementally.
Here are the three figures that frame the opportunity:
- 10-year Treasury yield: approximately 4.6%-4.7%
- 30-year Treasury yield: approximately 5.2%, the highest since 2007
- 10-year TIPS real yield: approximately 2.25%-2.5%, among the highest since the late 2000s
For context, real yields were near zero or negative for much of the 2010s. If you tuned out of bonds during that stretch, you were right to. A 0% real yield means your bond income merely kept pace with inflation at best. Today, you can lock in returns that, after inflation, are meaningfully positive for the first time in over a decade.
Federal Reserve Chair Kevin Warsh pointed to inflation having run hot for 65 months as a central concern in his Jackson Hole address. Charles Schwab’s Collin Martin and colleagues at the Schwab Center for Financial Research expect price pressures to hold above 2% across several more quarters, with any meaningful decline unlikely before early 2027.
That inflation persistence is precisely what makes these yields durable rather than fleeting. You are not buying into a brief spike. You are buying into a structural repricing. Waiting for further clarity may mean watching this window compress without you in it.
When big ASX news breaks, our subscribers know first
TIPS: the inflation protection most investors are underusing
TIPS, or Treasury Inflation-Protected Securities, are the most direct inflation hedge available to you in the bond market, yet data from Schwab’s research team suggests they remain persistently underrepresented in retail portfolios, with very few of the firm’s own clients holding them in any meaningful size. The gap between what TIPS offer and how few people hold them in meaningful size is one of the most addressable risks in fixed income portfolios right now.
How TIPS work
The mechanics are straightforward. A TIPS bond ties its principal value to the Consumer Price Index (CPI), so when measured inflation rises, the principal rises with it, and since coupon payments are calculated against that growing principal, they increase in step. The real yield, currently around 2.25%-2.5% on the 10-year, is what you lock in above inflation if you hold to maturity.
That means if inflation runs at 3% annually over the next decade, you earn roughly 5.25%-5.5% in nominal terms. If inflation runs at 4%, you earn more. The protection is contractual, not speculative. Compare that to the 2010s, when real yields were near zero or negative: holding TIPS then meant your bond income barely kept pace with rising prices. Today’s entry point is a fundamentally different proposition.
The Federal Reserve TIPS yield curve methodology confirms that real yields represent the contractual return above inflation locked in at purchase, a distinction that makes today’s 2.25%-2.5% entry point structurally different from the near-zero real yields that persisted through most of the 2010s.
One tax detail matters here. The CPI-driven principal adjustment is taxable annually, even though you do not receive that cash until maturity. This “phantom income” issue makes TIPS significantly more tax-efficient inside an IRA or 401(k) than in a taxable brokerage account.
Individual TIPS vs. funds: the practical trade-offs
You have three main ways to hold TIPS, each with a distinct trade-off:
- Individual TIPS held to maturity: You eliminate mark-to-market price fluctuations entirely. You know your real yield at purchase and collect it regardless of what rates do in between. The trade-off is lower liquidity and the need to manage maturities yourself.
- TIPS mutual funds: These offer diversified maturity exposure and professional management, but their net asset value fluctuates daily with rate movements, so your statement balance will move even when your underlying income stream has not changed.
- TIPS ETFs: Similar diversification benefits to mutual funds, with intraday trading flexibility and typically lower expense ratios, but the same daily price fluctuation applies.
For a reader with retirement spending needs, the 2.25%-2.5% real yield means your bond income is contractually keeping pace with inflation, plus a margin. That guarantee is worth acting on before real yields compress again. A reasonable starting allocation for the inflation-protection sleeve of your fixed income portfolio is 25%-40% in TIPS across varied maturities, held preferentially in tax-advantaged accounts.
Corporate bonds at 5%-plus: what the yield hides and what it does not
The headline numbers are genuinely attractive. Investment-grade corporates are yielding 5% or more. High-yield bonds are paying 7%-7.5%. Compare that to the 2%-3% environment of the prior decade, and the income case writes itself.
Schwab’s view on both investment-grade and high-yield credit fundamentals has remained consistently positive and has not shifted in recent months. Collin Martin has pointed out that even when corporate earnings disappoint relative to high expectations, the underlying ability of most companies to meet debt obligations remains solid. Federal Reserve aggregate data covering the entire non-financial U.S. corporate sector shows short-term assets running at roughly 95 cents for every dollar of near-term liabilities, a ratio that compares favourably with much of the past several decades and points to resilient balance sheet liquidity.
But two specific complications are worth pricing into your positioning.
First, credit spreads are tight. The Bloomberg investment-grade corporate bond index currently shows an average spread of around 80 basis points, a figure that sits meaningfully below where that measure has averaged over the long run. A credit spread is the extra yield a corporate bond pays above a comparable Treasury; it compensates you for the risk that the issuer defaults. At 80 basis points, you are accepting below-average compensation for that risk. Spreads can re-rate quickly if growth slows or risk appetite retreats.
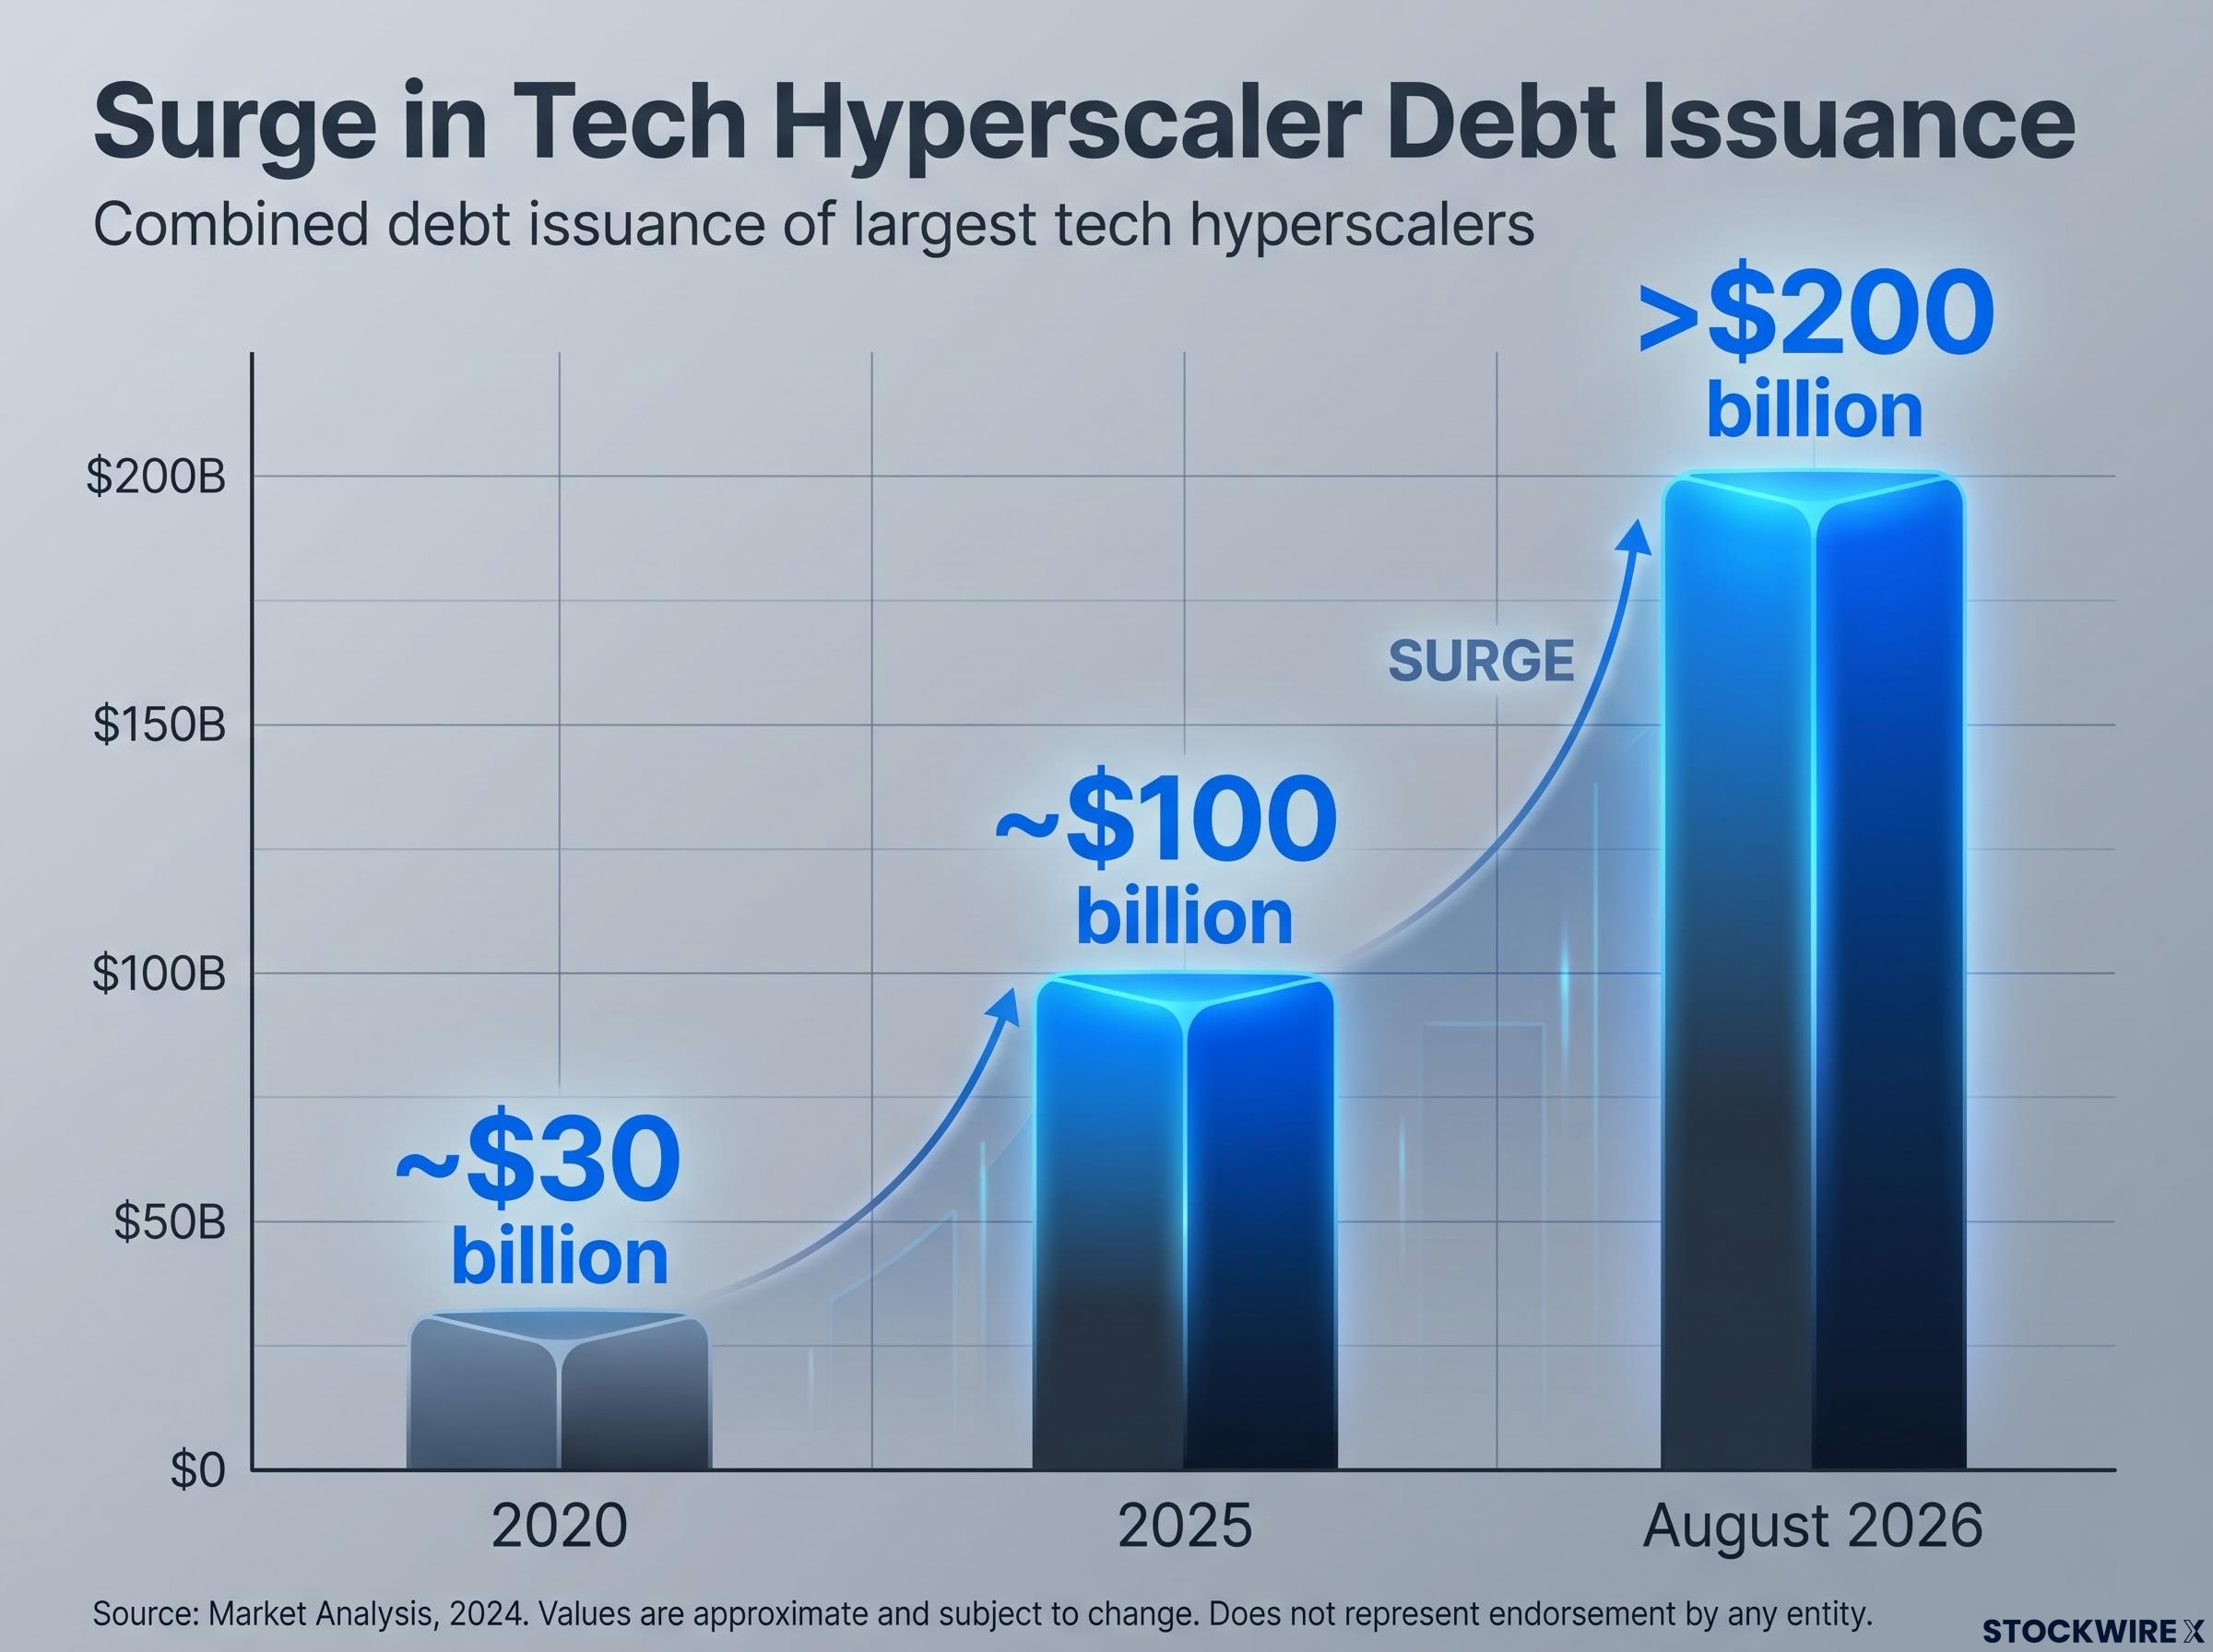
When examining the four or five largest technology hyperscalers by capital expenditure, their combined debt issuance came to roughly $30 billion in 2020, climbed to just above $100 billion in 2025, and by the close of August 2026 had already exceeded $200 billion, with much of that capital directed toward AI data centres and infrastructure whose long-term returns remain highly uncertain.
That supply pressure is concentrated in long-duration paper from these issuers. In the past, major technology names tended to trade at tighter spreads than the broad market, a reflection of their strong cash generation and elevated credit ratings, but substantial new supply has begun to erode that advantage and push tech spreads wider. The practical read: the front and belly of their curves (roughly 3-7 year maturities) look more attractive than 20-to-30 year bonds from the same names.
AI-related debt issuance from the largest hyperscalers had already surpassed twice the full-year 2025 total by July 2026, a supply surge concentrated in long-dated paper that is pushing spreads on individual names wider even as the broad investment-grade index holds near 80 basis points.
| Category | Yield range | Approximate spread | Recommended maturity |
|---|---|---|---|
| Investment-grade | 5%+ | ~80 bps (below historical average) | 3-7 years |
| High-yield | 7%-7.5% | Wider, but compensating for higher default risk | 3-5 years, with multi-year time horizon |
The 5% yield is real and worth owning. But spread compression means you need to be deliberate about maturity and issuer concentration rather than reaching for yield indiscriminately. Favour shorter to intermediate maturities, limit your concentration in long-dated AI-capex-heavy issuers, and match risk to your actual time horizon.
Treasuries and duration: how to use the risk-free anchor without getting anchored by it
Treasuries remain the risk-free foundation of any fixed income portfolio, but duration, the measure of how sensitive your bond’s price is to changes in interest rates, is a risk that compounds quickly at scale. The decision of where on the yield curve to concentrate is not a default; it is the most important structural choice you will make.
Bond duration is the single number on a fund fact sheet that translates a rate move into a real dollar loss: a fund with duration of 17 loses roughly 17% of its value from a single one-percentage-point rate rise, while a fund with duration of 6 loses about 6%, even if both carry the label ‘bond fund.’
The 5-to-10 year segment offers the strongest balance between yield and rate sensitivity for most investors. You capture the bulk of available yield without taking on the extreme duration risk that sits in 20-to-30 year paper. Longer maturities offer the highest nominal yields, but a 1% rise in yields can translate to double-digit price losses in those positions. Many broad bond index funds hold substantial long-term Treasury exposure without investors realising it. If you own one, check your effective duration; you may be carrying far more rate risk than you consciously chose.
The fiscal backdrop and what it means for long-term yields
Three primary drivers are keeping long-term yields elevated:
- Resilient economic growth sustaining policy rates at elevated levels for an extended period
- Persistent inflation uncertainty limiting the Fed’s scope for meaningful rate reductions
- Mounting fiscal pressures stemming from sizeable deficits accumulated outside of any recessionary conditions
Total U.S. public debt has reached roughly $40 trillion, with the debt-to-GDP ratio now above 100%. The country is carrying substantial budget shortfalls even as the broader economy continues to expand. Should the investors who absorb marginal Treasury supply pull back over fiscal concerns, the resulting upward pressure on yields could simultaneously weaken the dollar and fan further inflation.
Martin described this fiscal challenge as a genuine but slow-moving risk rather than an acute threat, one that he believes warrants serious attention from policymakers across both parties. HSBC has previously drawn attention to 5% on the 10-year Treasury as a level at which broader financial conditions could come under meaningful strain. The 10-year currently sits at 4.6%-4.7%, below that threshold but not far from it.
The US fiscal trajectory is already translating into concrete household costs: a single percentage-point rise in the 10-year Treasury adds roughly $97,000 in total interest on a $400,000 mortgage over 30 years, and the unusually wide mortgage-to-Treasury spread signals that structural rate pressure extends beyond the current Fed policy cycle.
The practical implication: if you hold a broad bond index fund thinking it is “safe,” a single percentage point rise in yields could cost you more than a year of coupon income on the long-duration portion. Be intentional. A recommended allocation is 30%-45% of your fixed income in nominal Treasuries, biased toward the 3-to-10 year segment.
Building a fixed income portfolio that works across multiple outcomes
Every section above pointed here. The question is not whether to own fixed income; it is how to structure your holdings so they deliver across more than one economic scenario.
Fixed income portfolio positioning in a higher-for-longer environment favours a blended allocation across nominal Treasuries, investment-grade corporates, and inflation-linked instruments held across a laddered maturity structure, an approach that addresses income, inflation protection, and capital preservation simultaneously rather than optimising for any single outcome.
Start by segmenting your fixed income by purpose, not by product name:
| Purpose | Instrument | Illustrative allocation | Key risk to manage |
|---|---|---|---|
| Inflation protection | TIPS | 25%-40% | Phantom income tax; hold in IRA/401(k) |
| Core income | Treasuries + IG corporates (intermediate) | 30%-45% | Duration; keep to 3-10 year segment |
| Opportunistic income | High yield (where risk tolerance allows) | 5%-15% | Spread widening; needs multi-year horizon |
| Liquidity | Cash / ultra-short instruments | As needed | Reinvestment risk if Fed cuts |
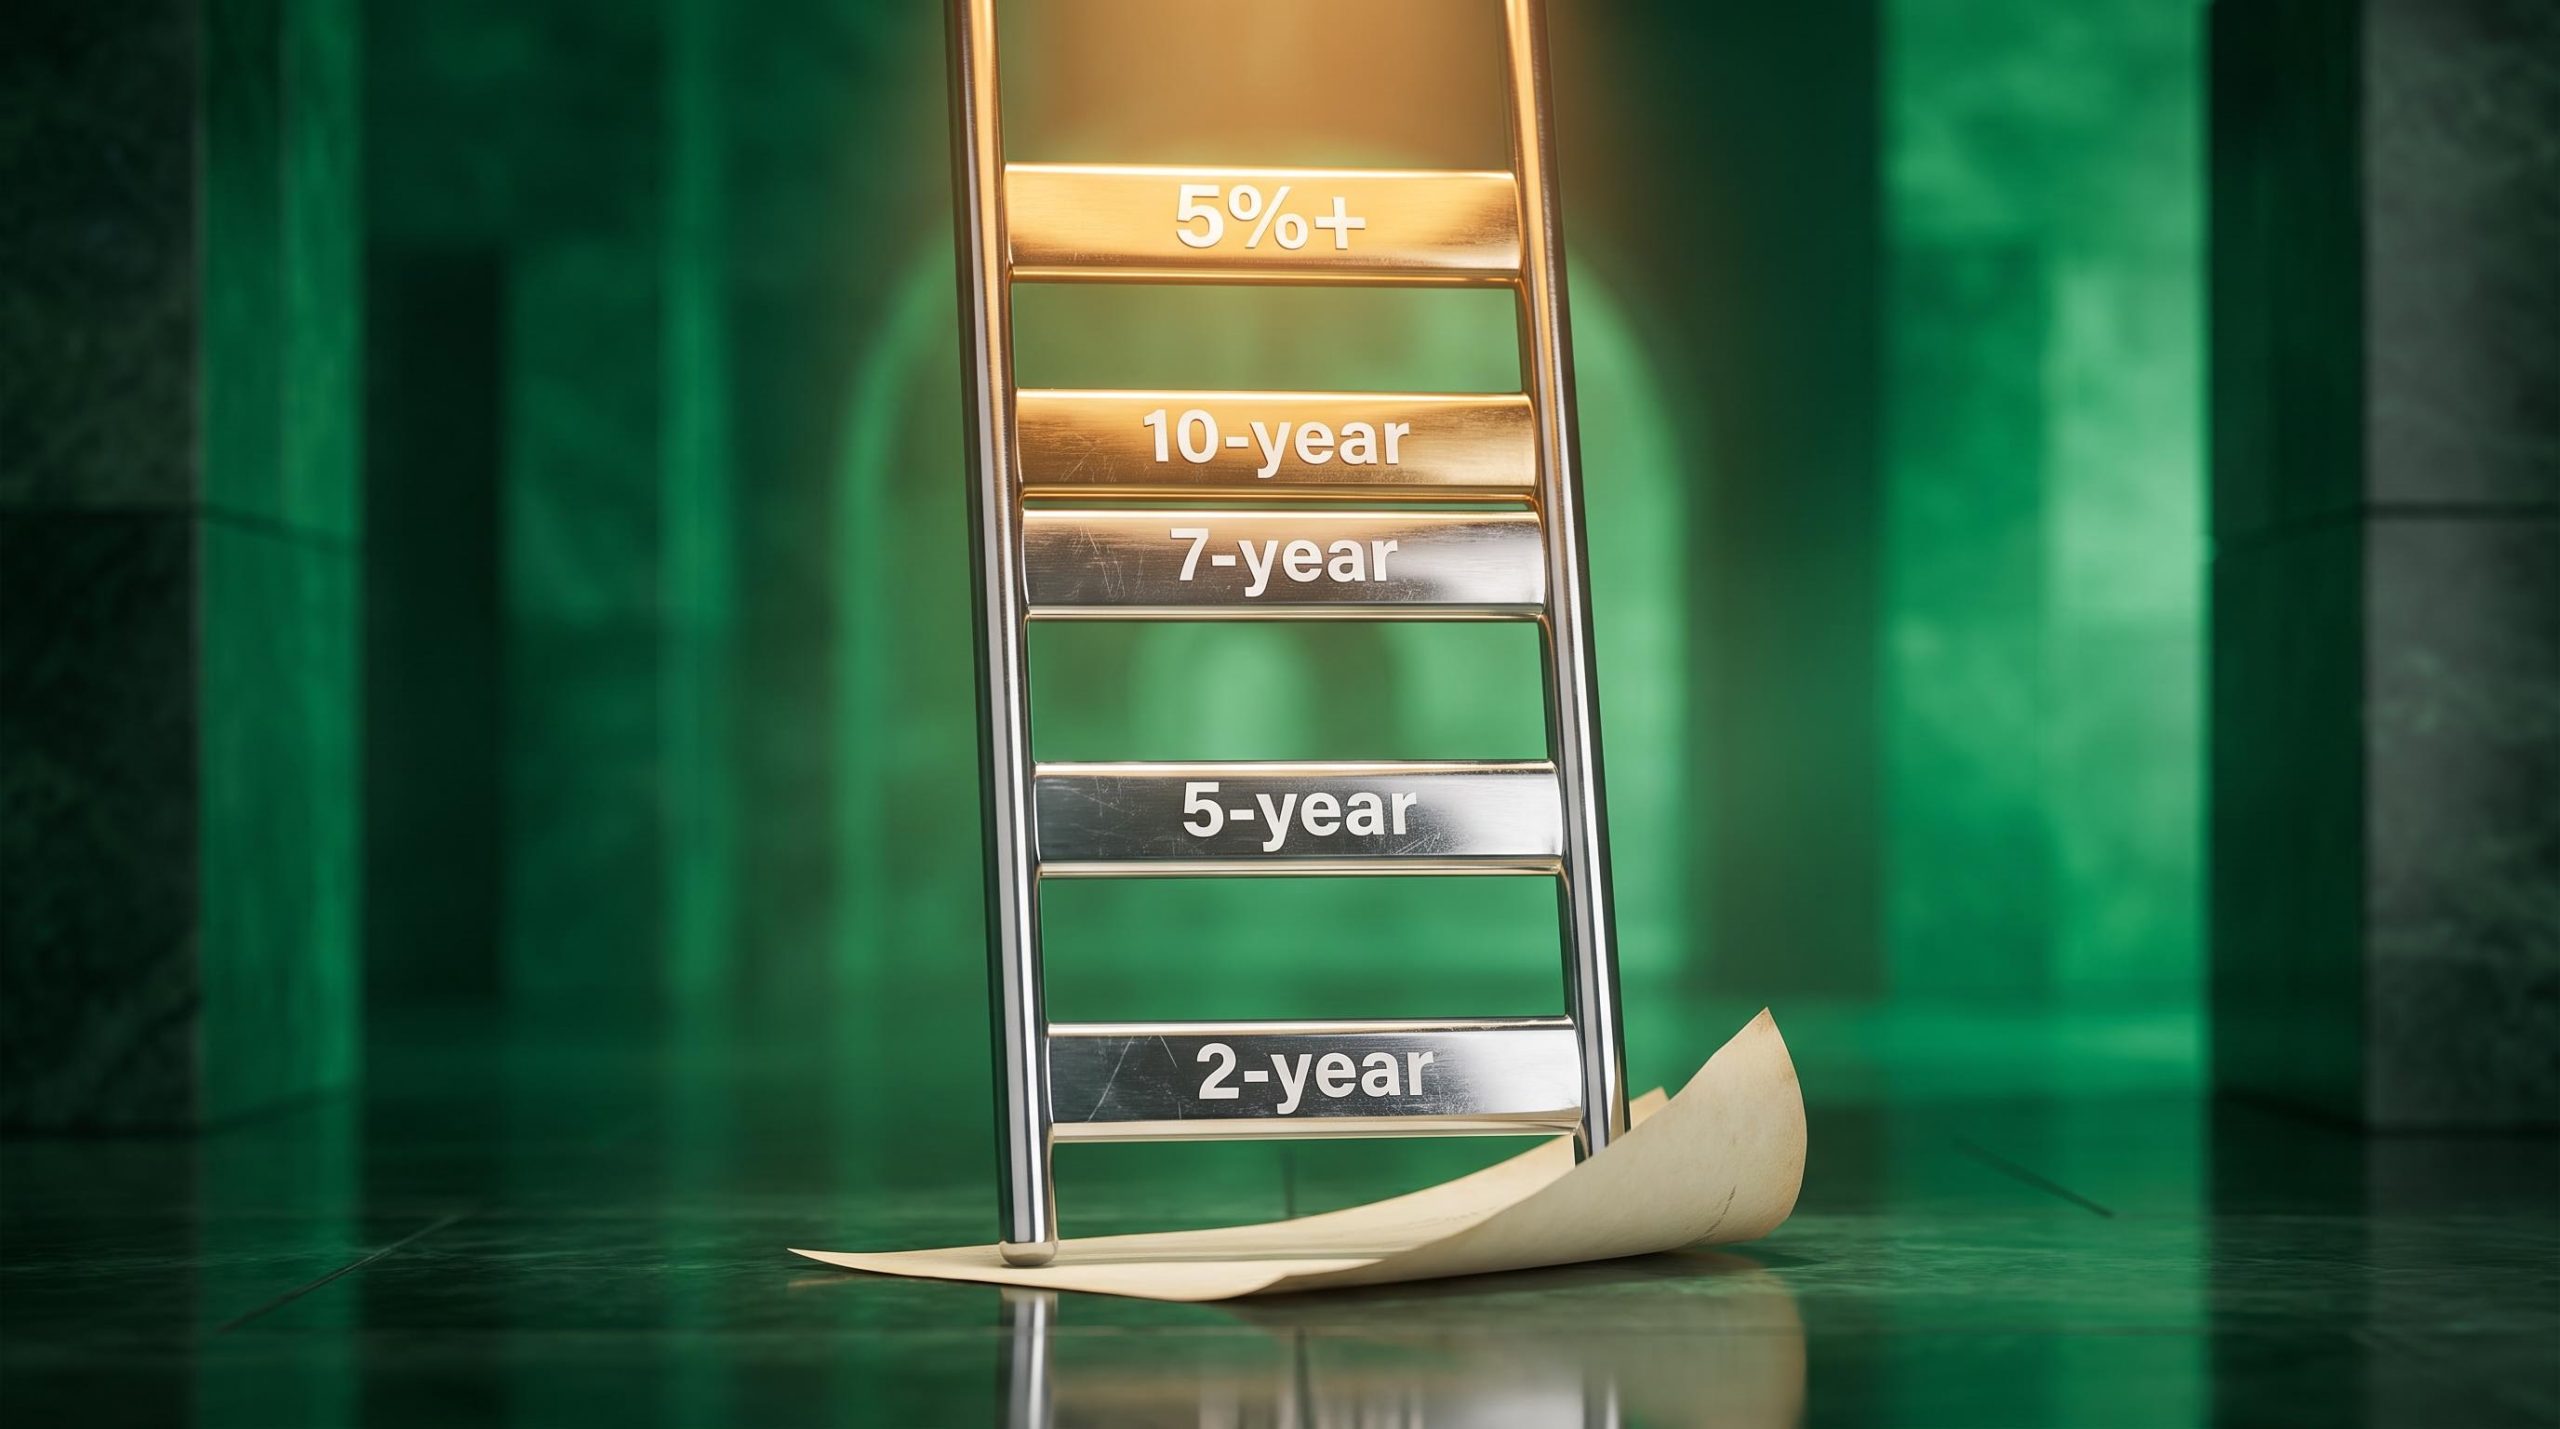
Once you have the segments in place, ladder your maturities across them. Laddering means spreading your purchases across a range of maturity dates so that bonds come due at regular intervals:
- 2-year rung: Closest maturity; provides near-term liquidity and reinvestment flexibility
- 5-year rung: Core intermediate position; balances yield and rate sensitivity
- 7-year rung: Extends the yield pickup without entering the long-duration danger zone
- 10-year rung: Longest rung for most investors; locks in today’s yields for a full decade
If yields rise, your maturing rungs can be reinvested at higher rates. If yields fall, your existing bonds locked in at higher coupons keep paying. Either way, you are not making a binary bet on direction.
One more implementation step matters: tax placement. These three instruments are the strongest candidates for your tax-advantaged accounts:
- TIPS: Phantom income from annual CPI principal adjustments is taxable even though cash arrives only at maturity
- High-yield bond funds: Frequent coupon payments and fund turnover generate taxable events
- Active bond funds with high turnover: Capital gains distributions erode after-tax returns in taxable accounts
The “all cash” temptation deserves a direct response. Money markets currently offer attractive short-term yields, but they reset immediately if the Fed cuts. Holding only cash leaves you fully exposed to reinvestment risk on your largest position. Cash is a liquidity buffer, not a fixed income strategy. The distinction matters when rates eventually change direction.
What to do before rates change direction
Fixed income now offers real income for the first time in over a decade. But that income accrues only to investors who position deliberately across the curve and across asset types. Owning a single broad bond fund and assuming you are covered is not a strategy; it is an accident of defaults.
Before the rate environment shifts, whether toward cuts or further yield increases, you should be able to answer these questions about your own holdings:
- What is your portfolio’s effective duration? If you cannot answer, check your fund’s fact sheet this week.
- What share of your fixed income is inflation-indexed? If the answer is zero, the TIPS section above gives you a starting framework.
- Are you holding any positions in long-dated hyperscaler debt you did not consciously choose? Your broad corporate bond fund may have made that decision for you.
- Is your cash allocation a temporary liquidity buffer or a permanent yield-chasing stance? There is a difference, and reinvestment risk sits squarely in the gap between the two.
This article is for informational purposes only and should not be considered financial advice. Investors should conduct their own research and consult with financial professionals before making investment decisions. Past performance does not guarantee future results. Financial projections are subject to market conditions and various risk factors.
In a higher-for-longer environment, the cost of inaction is no longer zero. Real purchasing power erodes while you wait for a certainty that will not arrive cleanly. The yields are here. The framework is in front of you. What you do with them is the only variable left.