Australia’s data centre market is heading for A$60 billion. That is the number circulating across broker notes, media coverage, and conference stages. It is also, on closer inspection, a scenario ceiling rather than a consensus forecast, and the distance between the two is where most of the mispricing in this sector lives.
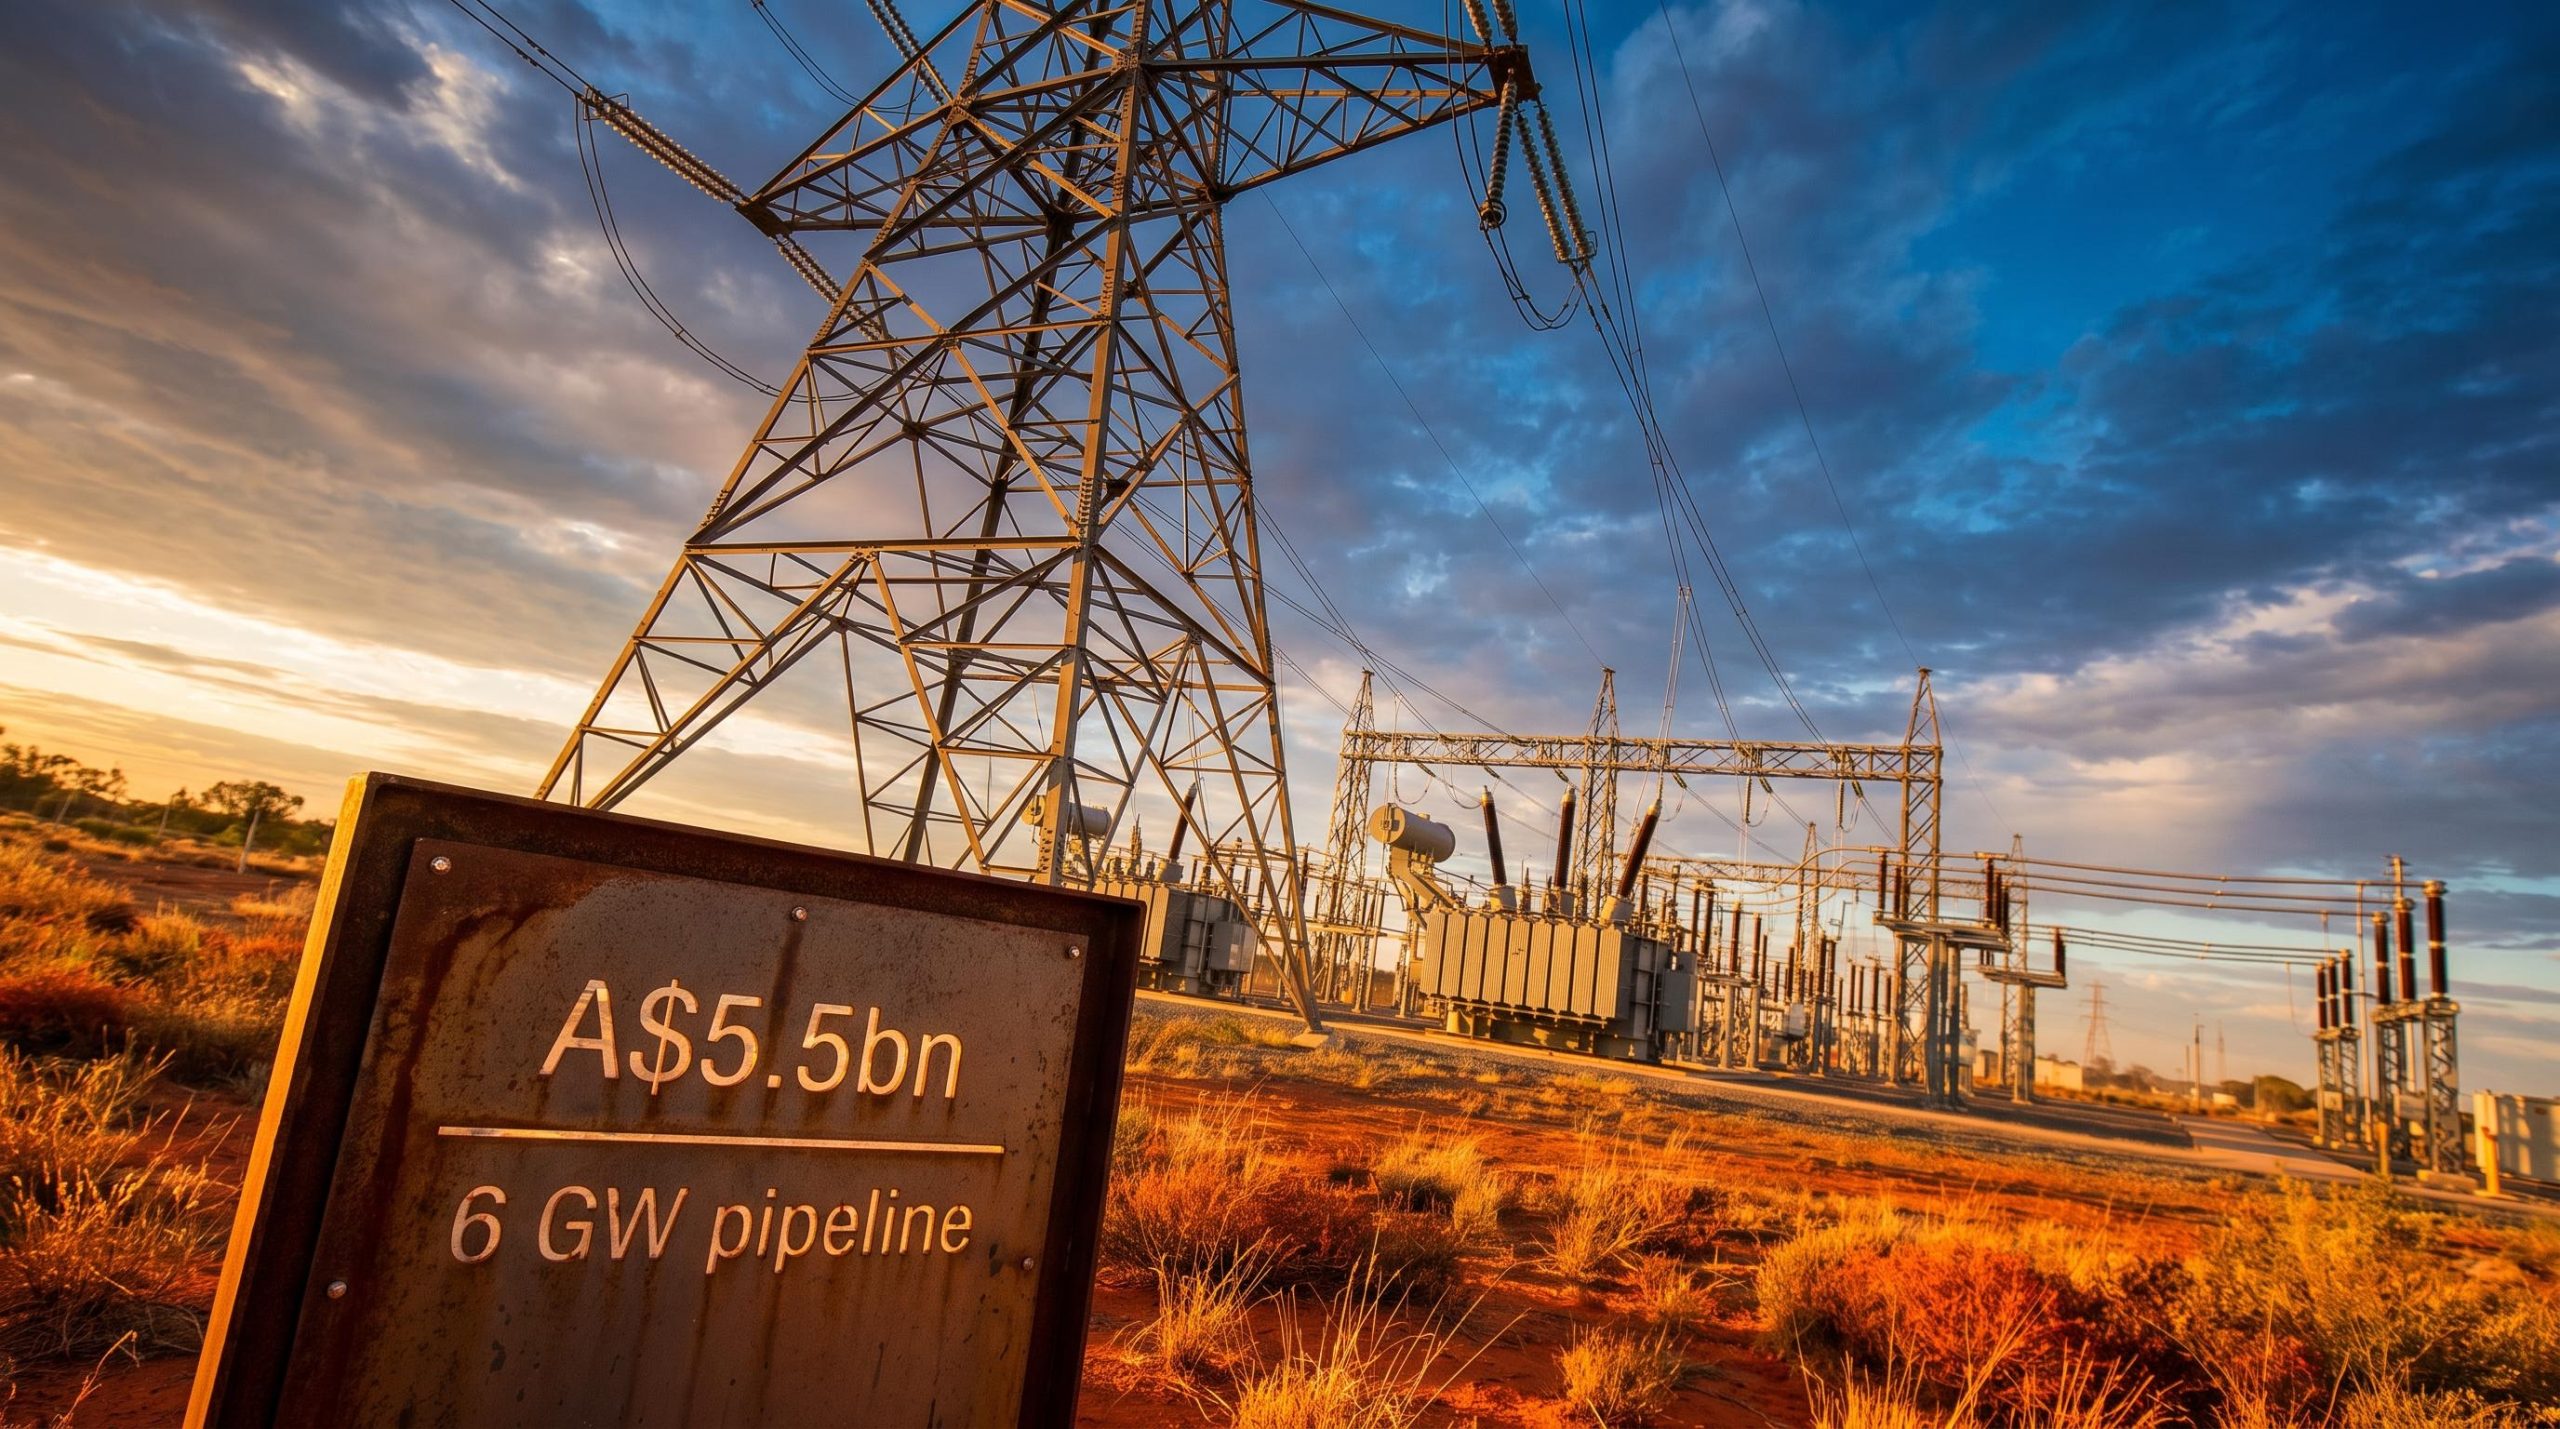
The timing makes this worth unpacking now. Alphabet raised A$5.5 billion through a record kangaroo bond offering, with the proceeds directed at AI infrastructure projects across Australia. NextDC reports earnings after market close today. And a new federal energy obligation framework is actively rewriting the cost structure for every project in the pipeline.
What follows is a framework for distinguishing which layer of the Australian data centre opportunity carries genuine conviction and which carries policy-contingent risk, so you can position accordingly rather than treating the sector as a single undifferentiated trade.
The A$60 billion figure is real, but it is not what most investors think it is
Start with what the research houses actually forecast for Australia’s data centre services market, meaning annual operating revenue from colocation and cloud facilities. Those figures cluster around USD 7-9 billion (approximately AUD 10-13 billion) by 2030-31. That is a large and fast-growing market. It is not A$60 billion.
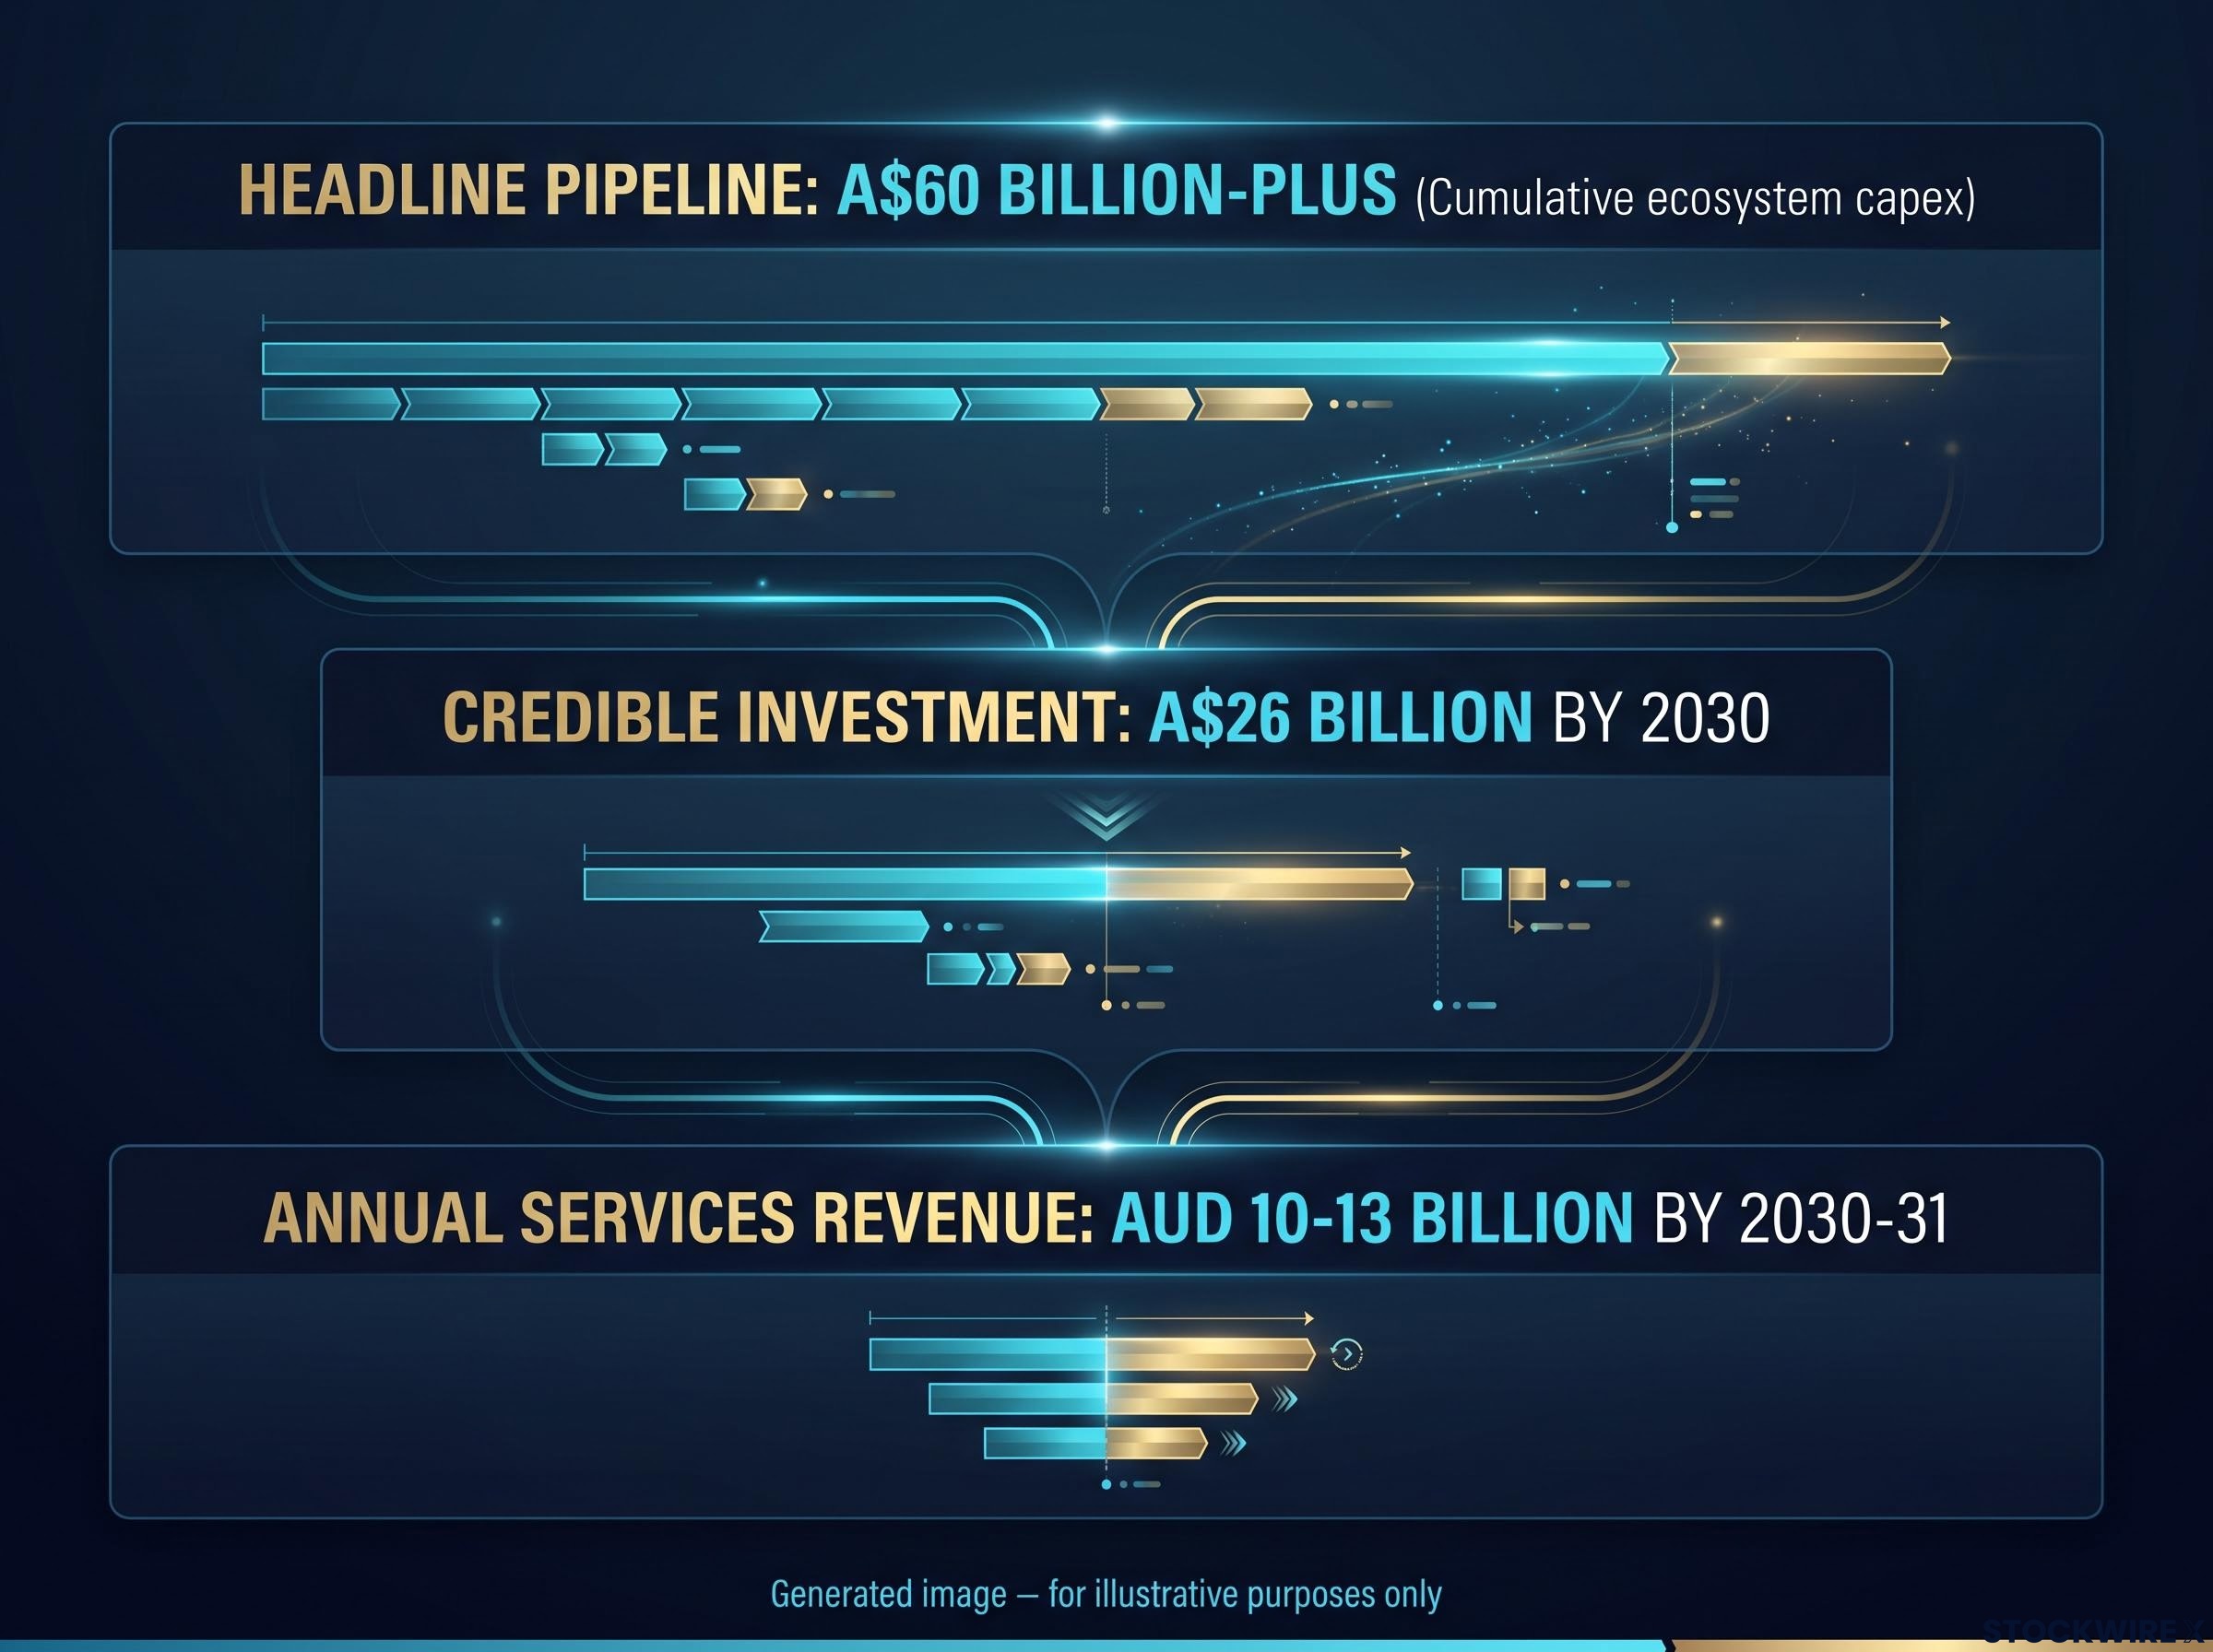
An investment-focused industry report, “Empowering Australia’s Digital Future,” estimates credible new data centre investment at roughly A$26 billion by 2030. For the A$60 billion figure to hold, it requires a longer time horizon, inclusion of speculative pipeline projects that may or may not proceed, and the counting of associated energy and transmission infrastructure across the ecosystem. It is a cumulative capex ceiling for the entire build-out, not an annual revenue number.
| Metric | Figure | Time Horizon | What It Measures |
|---|---|---|---|
| Annual services revenue | USD 7-9 billion (AUD 10-13 billion) | 2030-31 | Operating revenue from colocation and cloud facilities |
| Investment-focused capex estimate | A$26 billion | By 2030 | Credible new data centre capacity investment |
| Headline pipeline figure | A$60 billion-plus | Longer horizon | Cumulative ecosystem capex including energy, transmission, and speculative pipeline |
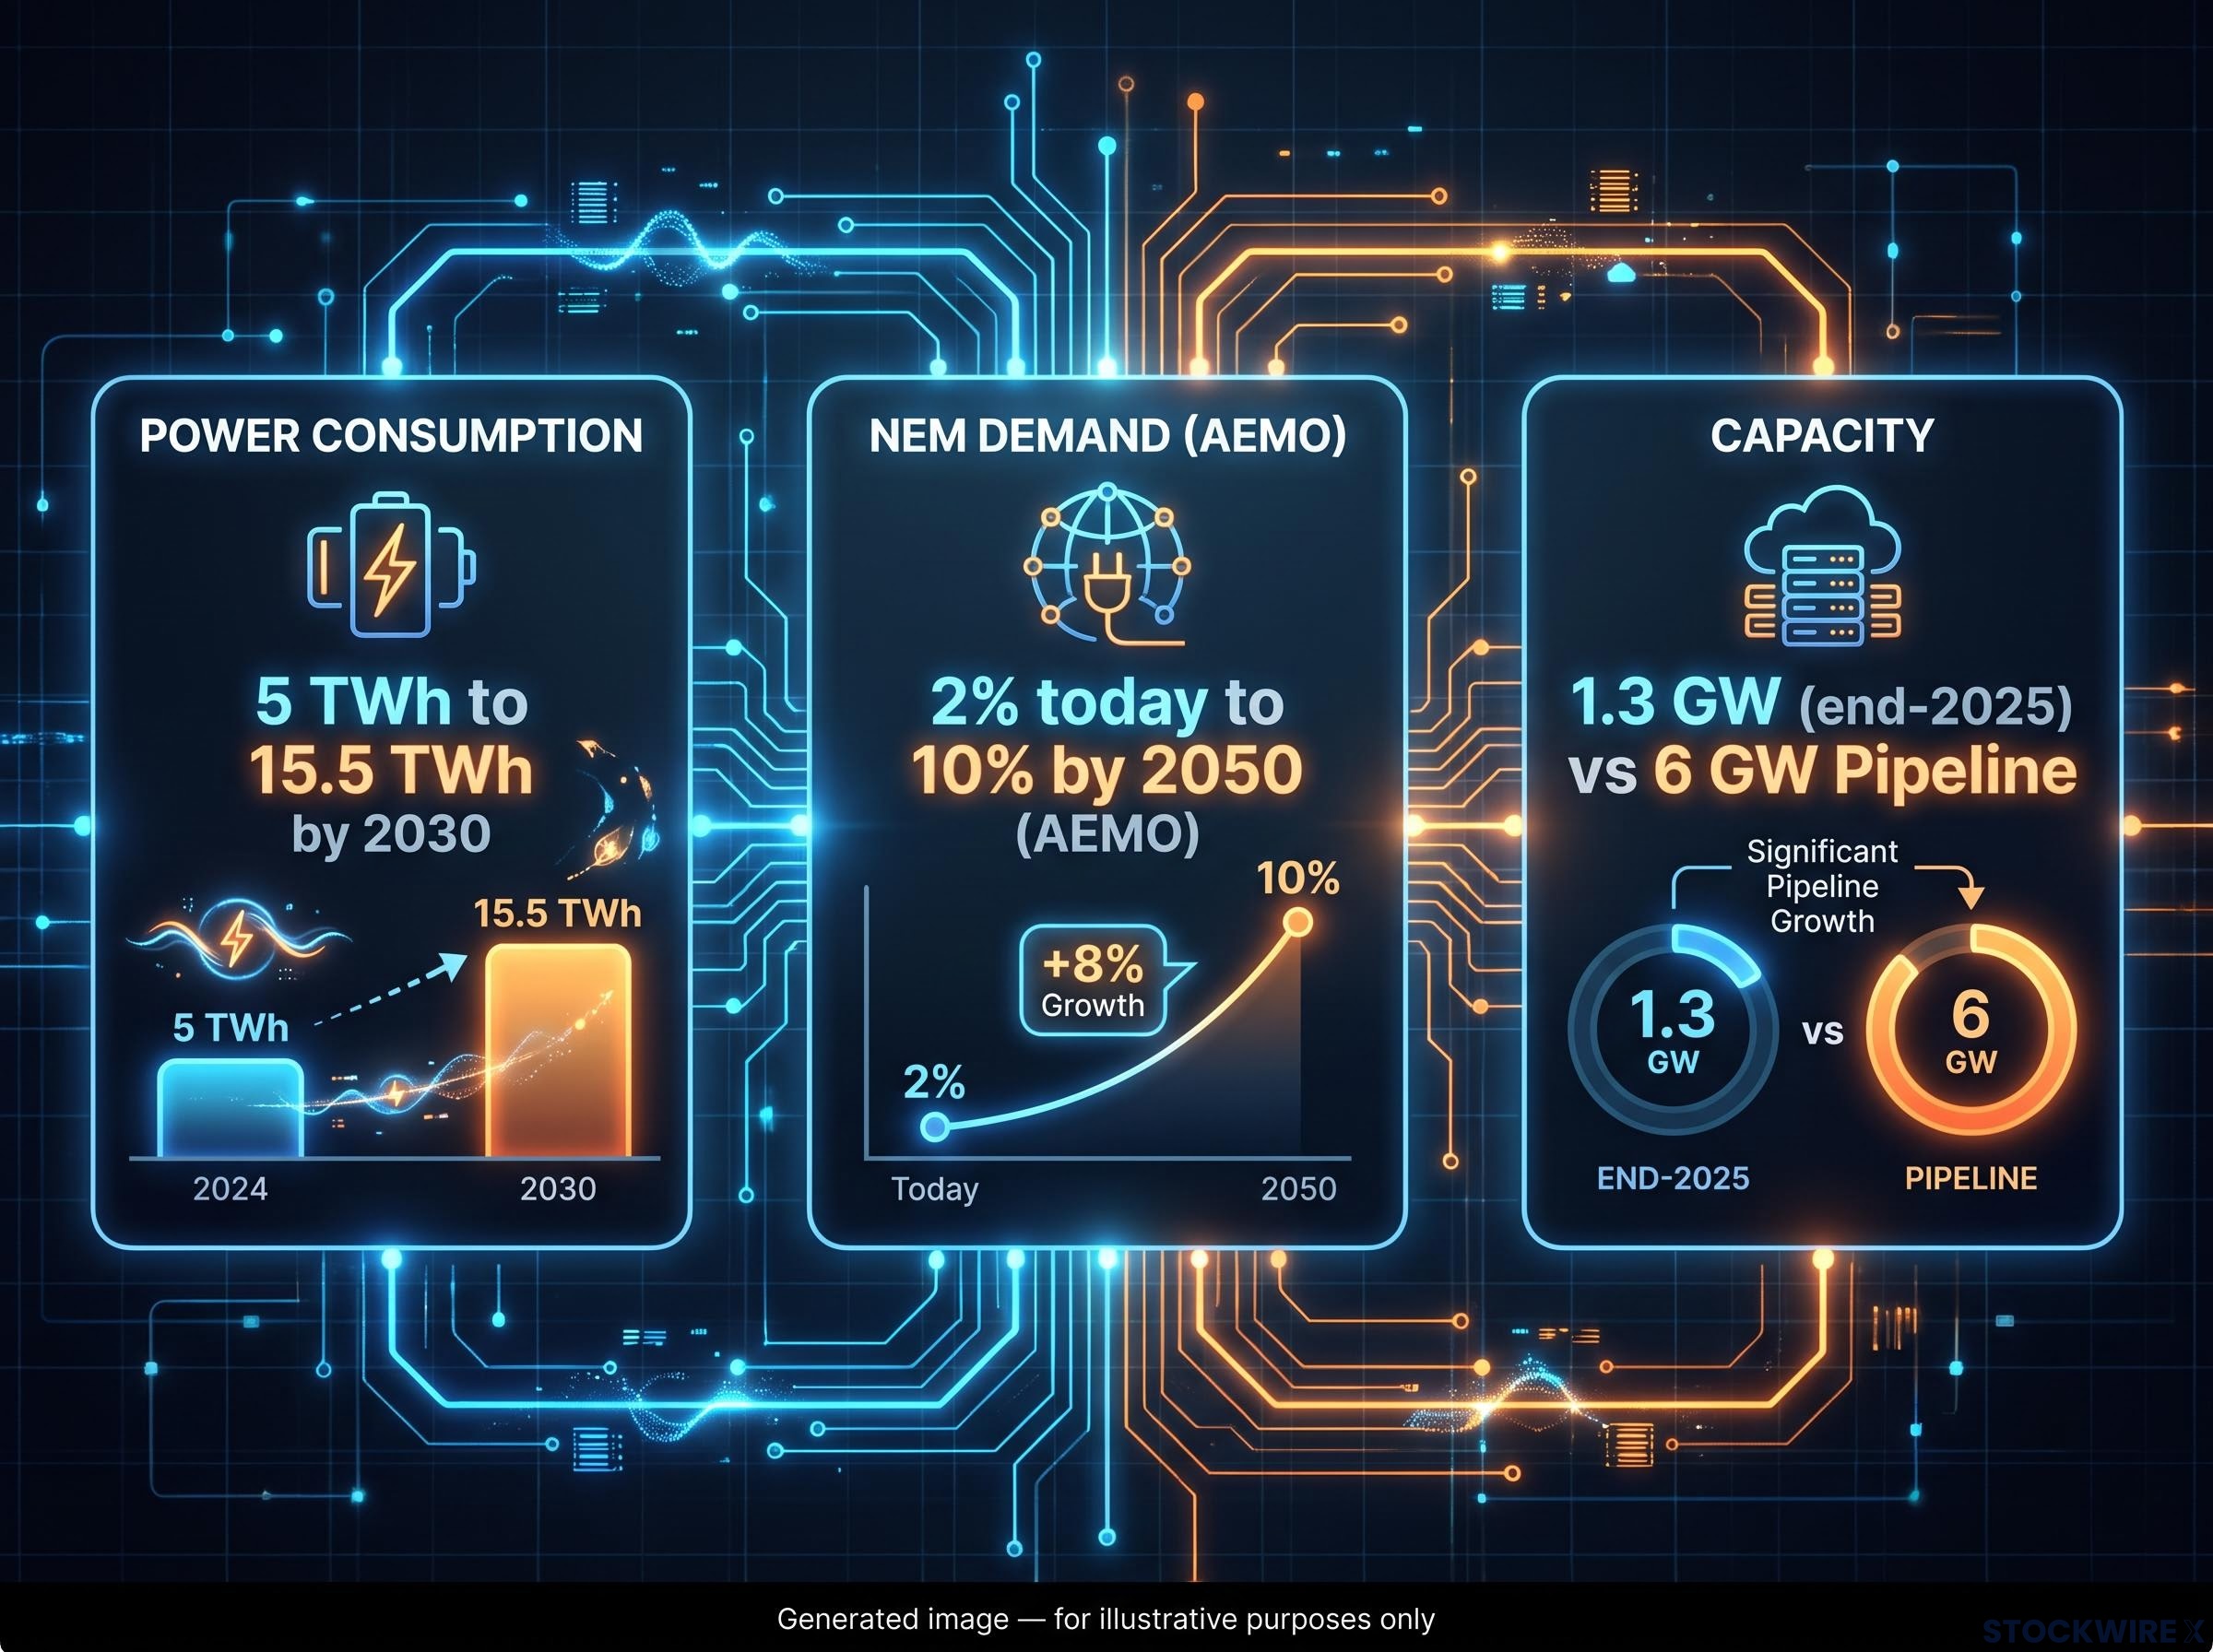
The scale benchmark that matters most is the 6 GW potential pipeline, roughly four times end-2025 operational capacity of approximately 1.3 GW. Credible build-out reaches 1.8 GW within three years, still leaving an estimated supply gap of 0.7-1.7 GW by 2028 if demand materialises as projected.
Demand-side validation: Alphabet’s A$5.5 billion kangaroo bond, settled in August 2026, channelled dedicated capital into Australian AI infrastructure, demonstrating that hyperscaler commitment here is tangible and substantial. The question is not whether demand exists. It is whether Australian infrastructure can absorb it fast enough.
Global AI power demand projections from the IEA and Goldman Sachs, which place AI-specific incremental load at 800-1,000 TWh above a no-AI baseline by 2030, establish the international demand context that makes Australian hyperscaler commitments legible as part of a structural shift rather than a local policy artefact.
The gap between the headline figure and what the research layer supports tells you something specific: investors anchoring to A$60 billion as a baseline are likely buying a story rather than a forecast. Understanding exactly what scenario conditions that number requires is the first discipline any position-sizing decision demands.
When big ASX news breaks, our subscribers know first
The policy risk is real, but the threat is to margins and timelines, not existence
What the federal framework requires
The Commonwealth has moved towards a national baseline framework for large data centre loads rather than leaving obligations to ad-hoc project-by-project negotiation. Three specific elements are taking shape:
- Renewable underwriting: Large data centres must underwrite new renewable generation or become net generators of renewable energy over time
- Full network cost allocation: Operators pay their full share of network connection and augmentation costs
- Demand-response capability: Facilities must provide demand-response capability to support grid stability during periods of stress
These obligations are being expressed through a combination of technical standards, contracted obligations, and connection terms. The Australian Energy Market Commission (AEMC), the body responsible for energy market rules, is simultaneously revising technical access standards for large inverter-based loads, shifting from participant-based to plant-type assessments for facilities connecting via uninterruptible power supply (UPS) systems and other power-electronics-heavy configurations.
This is not a single blunt “build your own renewables” edict. But it is a real cost layer that every operator in the pipeline must now price into their project economics.
What state-level variation actually means now
Initial coverage indicated that Queensland and the Northern Territory had obtained carve-outs from the proposed federal requirements. More recent policy commentary signals a different trajectory: the federal direction is towards a common floor that states cannot water down, though they may impose stricter requirements or layer their own incentives above it.
Any perceived exemption arbitrage between states is likely transient and politically driven rather than a durable structural advantage. The more meaningful state-level differentiators are planning efficiency, pre-zoned data centre precincts, and the ability of state networks to absorb large new loads under the federal framework. Those advantages sit above the national floor, not below it.
For investors assessing Australian data centre operators, the policy story is not binary viability risk. It is a margin and timeline headwind that favours operators with the capital depth and grid relationships to absorb compliance costs faster than competitors. The investment question shifts from “will this sector survive regulation” to “which operators convert pipeline to revenue fastest under the new cost structure.”
Grid access is where the opportunity actually breaks down
Policy risk has been partially resolved by the emergence of a national floor. Grid access has not.
Scale anchor: The Australian Energy Market Operator (AEMO) projects data centres rising from approximately 2 percent of National Electricity Market (NEM) demand today to approximately 10 percent by 2050. Domestic power consumption is expected to roughly triple by 2030, from 5 TWh to 15.5 TWh under central scenarios, with a potential sevenfold increase by 2035-36.
Securing access to high-voltage transmission infrastructure and adequate substation capacity has emerged as the primary operational barrier cited repeatedly by both project developers and regulators. Australia’s current connection framework was not designed for multiple very large simultaneous load applicants, and approximately 300 live data centres as of 2025 are already straining existing processes. Three structural problems explain why this bottleneck is harder to resolve than the policy layer:
AEMO’s 2026 Integrated System Plan projects data centres rising from approximately 2 percent of NEM demand today to almost 10 percent by 2050, with domestic power consumption expected to roughly triple by 2030 under central scenarios, providing the demand baseline against which every grid access assessment in the queue is now being evaluated.
- Grid certainty is foundational. Developers hesitate to commit capital until they have high confidence in the capacity, location, and timing of connections. Without that certainty, project timelines stretch and risk premia rise before a single approval condition is imposed.
- Infrastructure sequencing is misaligned. New transmission, substations, and augmentations for renewables and for large data centre loads compete for the same constrained resources. Prioritising one delays the other, and the sequencing framework does not yet account for simultaneous demand at this scale.
- Process opacity is an independent bottleneck. Even where policy intent is supportive, slow and opaque connection assessment processes delay projects and increase costs independently of any regulatory requirement. Long assessment timelines and a lack of visibility into competing applications compound uncertainty for every applicant in the queue.
“Fast lane” or dedicated pathway reform for strategic loads is as consequential as physical grid investment, and the two are not substitutes for each other. Building more transmission capacity does not help if the connection process takes years to navigate.
If grid access reform stalls, the 6 GW pipeline does not disappear. It concentrates among the operators with existing grid relationships and balance sheets large enough to absorb extended connection timelines. That narrows the investable opportunity considerably, and it is the variable most likely to determine which operators successfully convert their pipeline and which ones see capex commitments sit idle.
NextDC earnings today and the tiered framework for investing in the build-out
NextDC reports after market close today, 27 August 2026, and the result will serve as the first live test of every structural question this analysis has raised.
Pipeline scale: NextDC carries a contracted capacity pipeline of approximately 740 MW, supported by a forward order book of approximately 544 MW as of early 2026, against which the company is deploying roughly A$3 billion in capital expenditure each year.
Consensus analyst estimates put revenue at roughly A$253 million for the period, alongside a net loss in the vicinity of A$32 million and a loss per share of around A$0.20. Those loss figures reflect heavy depreciation and interest during the capital-intensive build-out phase rather than weak demand; they are the accounting signature of infrastructure-stage investment and should not be read as a demand signal.
The earnings-day signals that matter most are not the near-term loss figures. They are guidance commentary and management disclosure on grid access delays, energy obligation costs, and the pace at which contracted megawatts are converting to billed megawatts. Those variables feed directly into whether NextDC’s 740 MW pipeline becomes EBITDA or remains stranded capital.
CDC Data Centres’ 555MW hyperscaler deal and DigiCo’s US$750 million Chicago divestiture illustrate the contracted capacity milestones that sector peers are achieving, providing a benchmark against which NextDC’s 740 MW pipeline and conversion pace can be assessed.
This article is for informational purposes only and should not be considered financial advice. Investors should conduct their own research and consult with financial professionals before making investment decisions. Analyst consensus estimates cited above are unverified and subject to revision.
A three-tier framework for Australian AI infrastructure exposure
The sector does not demand a single position. It demands a choice between three distinct risk profiles.
| Tier | Representative Names | Key Risk | Investment Thesis |
|---|---|---|---|
| Tier 1: Global supply chain | Copper producers, power-equipment manufacturers | Global cycle risk; lower Australia-specific policy exposure | Broad AI infrastructure upside without local execution risk; benefits whether Australian projects proceed or not |
| Tier 2: Domestic operators | NextDC | Australia-specific policy, grid access, and conversion risk | High-beta exposure requiring active monitoring of grid-access progress, compliance costs, and contracted-to-billed conversion pace |
| Tier 3: Energy providers and network owners | AGL, Origin | Regulatory risk concentration; AEMC technical standard tightening | Structural gatekeepers; upside if utilities successfully bundle power, connection, and co-located generation; downside if standards tighten faster than commercial models adapt |
Tier 1 offers the build-out upside without the local execution risk. Tier 2 is the highest-conviction play but demands active monitoring of the grid access and policy variables identified above. Tier 3 is the gatekeeper play: energy providers and network owners are both the beneficiaries and the risk-bearers as the AEMC tightens technical access standards. The tier you choose determines not just your return profile but your exposure to the specific Australian risks this analysis has detailed.
The railroad analogy that recurs across AI infrastructure analysis has a specific analytical grounding: a binding constraint framework focused on power availability, cooling density, and interconnection timelines identifies which operators are positioned to compound returns rather than merely participate in the cycle.
Where conviction is warranted and where the risk is still being priced
Three specific variables will resolve the uncertainty sitting between the 1.3 GW operational baseline and the 6 GW potential pipeline:
- Connection framework reform: Not just policy announcements, but actual process changes that reduce assessment timelines and create dedicated pathways for strategic loads
- National energy obligation floor clarity: The conclusion of state-level negotiation and confirmation that the common baseline cannot be watered down, removing the exemption arbitrage overhang
- Contracted-to-billed conversion pace: The rate at which NextDC and peers convert contracted megawatts into revenue-generating capacity, starting with today’s earnings disclosure
Global infrastructure spending on data centres benefits materials and equipment suppliers whether individual Australian projects proceed or not. Copper, switchgear, transformers, and high-voltage engineering businesses are carried by the international capex cycle as well as by the domestic energy transition running alongside it. The Clean Energy Finance Corporation estimates AI and automation could contribute up to A$600 billion to Australian GDP by 2030, a macro demand anchor that supports the broader infrastructure thesis even under conservative project completion scenarios.
The A$60 billion headline is achievable under favourable scenario conditions. But the investment merit of this sector does not depend on that number being hit. The supply-chain and operator tiers offer differentiated entry points at differentiated risk levels. You do not need the high case to materialise. You need to identify which tier matches your risk tolerance and then monitor the two or three variables that will determine whether that tier delivers. Today’s NextDC result is where that monitoring begins.
For investors wanting to understand how global institutional positioning is shaping capital flows into the sector, our full explainer on Goldman’s data centre investment thesis covers the lease-rate tripling, the land-and-power positioning question, and the GPU efficiency tail risk that Goldman’s bullish framework does not fully resolve.
Past performance does not guarantee future results. Financial projections referenced in this article are subject to market conditions and various risk factors.