

PharmX delivers EBITDA-positive FY26 as Marketplace launch drives platform growth
In its August 2026 FY26 full-year results presentation, PharmX Technologies (ASX:PHX) detailed a year of investment across its pharmacy platform, reporting total revenue of $7.74m, up 3% on FY25, while remaining EBITDA positive at $1.1m.
The company closed the period with cash of $2.6m and positive operating cashflow of $0.825m. Management positioned FY26 as a foundational year, anchored by the launch of its Marketplace and a Strategic Alliance with Sigma, both framed as platforms for FY27 growth.
Profitability metrics softened during the period. EBITDA declined 33% to $1.08m, while net profit after tax (NPAT) recorded a loss of $1.83m, compared with a $0.26m loss in FY25. The company attributed the movement to deliberate investment in people, marketing and technology, alongside one-off Sigma establishment costs.
When big ASX news breaks, our subscribers know first
FY26 financial results: revenue growth while investing for scale
The presentation detailed an improving revenue mix across the platform. Gateway recurring revenue rose 8%, Marketplace recurring revenue increased 73%, and New Zealand recurring revenue grew 67% compared with FY25.
Management clarified the recurring revenue picture carefully. Excluding a structural market change, recurring revenue grew +9% on the prior corresponding period. Including that headwind, recurring revenue grew +5%. The headwind stemmed from a distribution shift for two major suppliers, who moved to supplying via wholesaler rather than direct to store, which impacted Gateway account fees. Factoring in non-recurring and development revenues in FY25, the net revenue change year-on-year was +3%.
Gross margin improved to 84%, a 2% improvement on FY25. The NPAT loss was driven by higher depreciation, amortisation and interest, together with an increase in share-based payments to $1.17m (FY25: $0.22m).
On the Sigma Strategic Alliance, management outlined an establishment fee of $9.7m relating to establishing the Alliance. Of this, $0.6m was expensed in FY26, with the remainder to be expensed over the life of the contract.
The Sigma Strategic Alliance, announced in February 2026, positions PharmX as the embedded EDI infrastructure partner across Australia’s largest pharmacy distribution network, with Sigma taking a 10% equity stake and a Board seat as part of the arrangement.
| Metric ($’000) | FY26 | FY25 | Change | Var % |
|---|---|---|---|---|
| Revenue | 7,737 | 7,530 | 207 | 3% |
| EBITDA | 1,080 | 1,608 | (528) | (33)% |
| NPAT | (1,826) | (264) | (1,562) | (592)% |
Cash position holds firm through a year of transition
The company delivered positive operating cashflow of $0.825m during a year of significant investment, a notable outcome given the resources directed toward the Marketplace launch. Product development investment totalled $2.1m for the period (FY25: $1.7m), including the Marketplace rollout.
PharmX ended the period with closing cash of $2.6m at 30 June 2026 and nil debt.
-
Net cash from operating activities: $0.825m
-
Product development investment: $2.1m
-
Closing cash: $2.6m, nil debt
What PharmX does: the pharmacy platform explained
PharmX operates as critical infrastructure for the Australian and New Zealand (ANZ) pharmacy supply chain, connecting pharmacies, wholesalers and suppliers through a single platform built around a common data set. That platform comprises three components.
The first is EDI · Pharmx Gateway, described as the truth layer for ANZ pharmacy. It connects 99% of ANZ pharmacies, processes over $20bn in gross transaction value (GTV) across 120,000+ products and 300M+ invoice lines annually, and generates subscription or per-account fees.
The second is the Marketplace, offering 40,000 SKUs with multi-cart checkout and embedded analytics. It shifts the revenue mix toward variable, invoice-linked earnings.
The third is Data & Analytics, an AI-native platform offering supplier and category analytics on a subscription plus usage-fee basis.
For investors, the network reach across roughly 7,000 ANZ pharmacies underpins a defensible position, with Gateway data powering both Marketplace and Analytics in what management describes as a customer value flywheel.
Marketplace momentum and platform KPIs signal FY27 upside
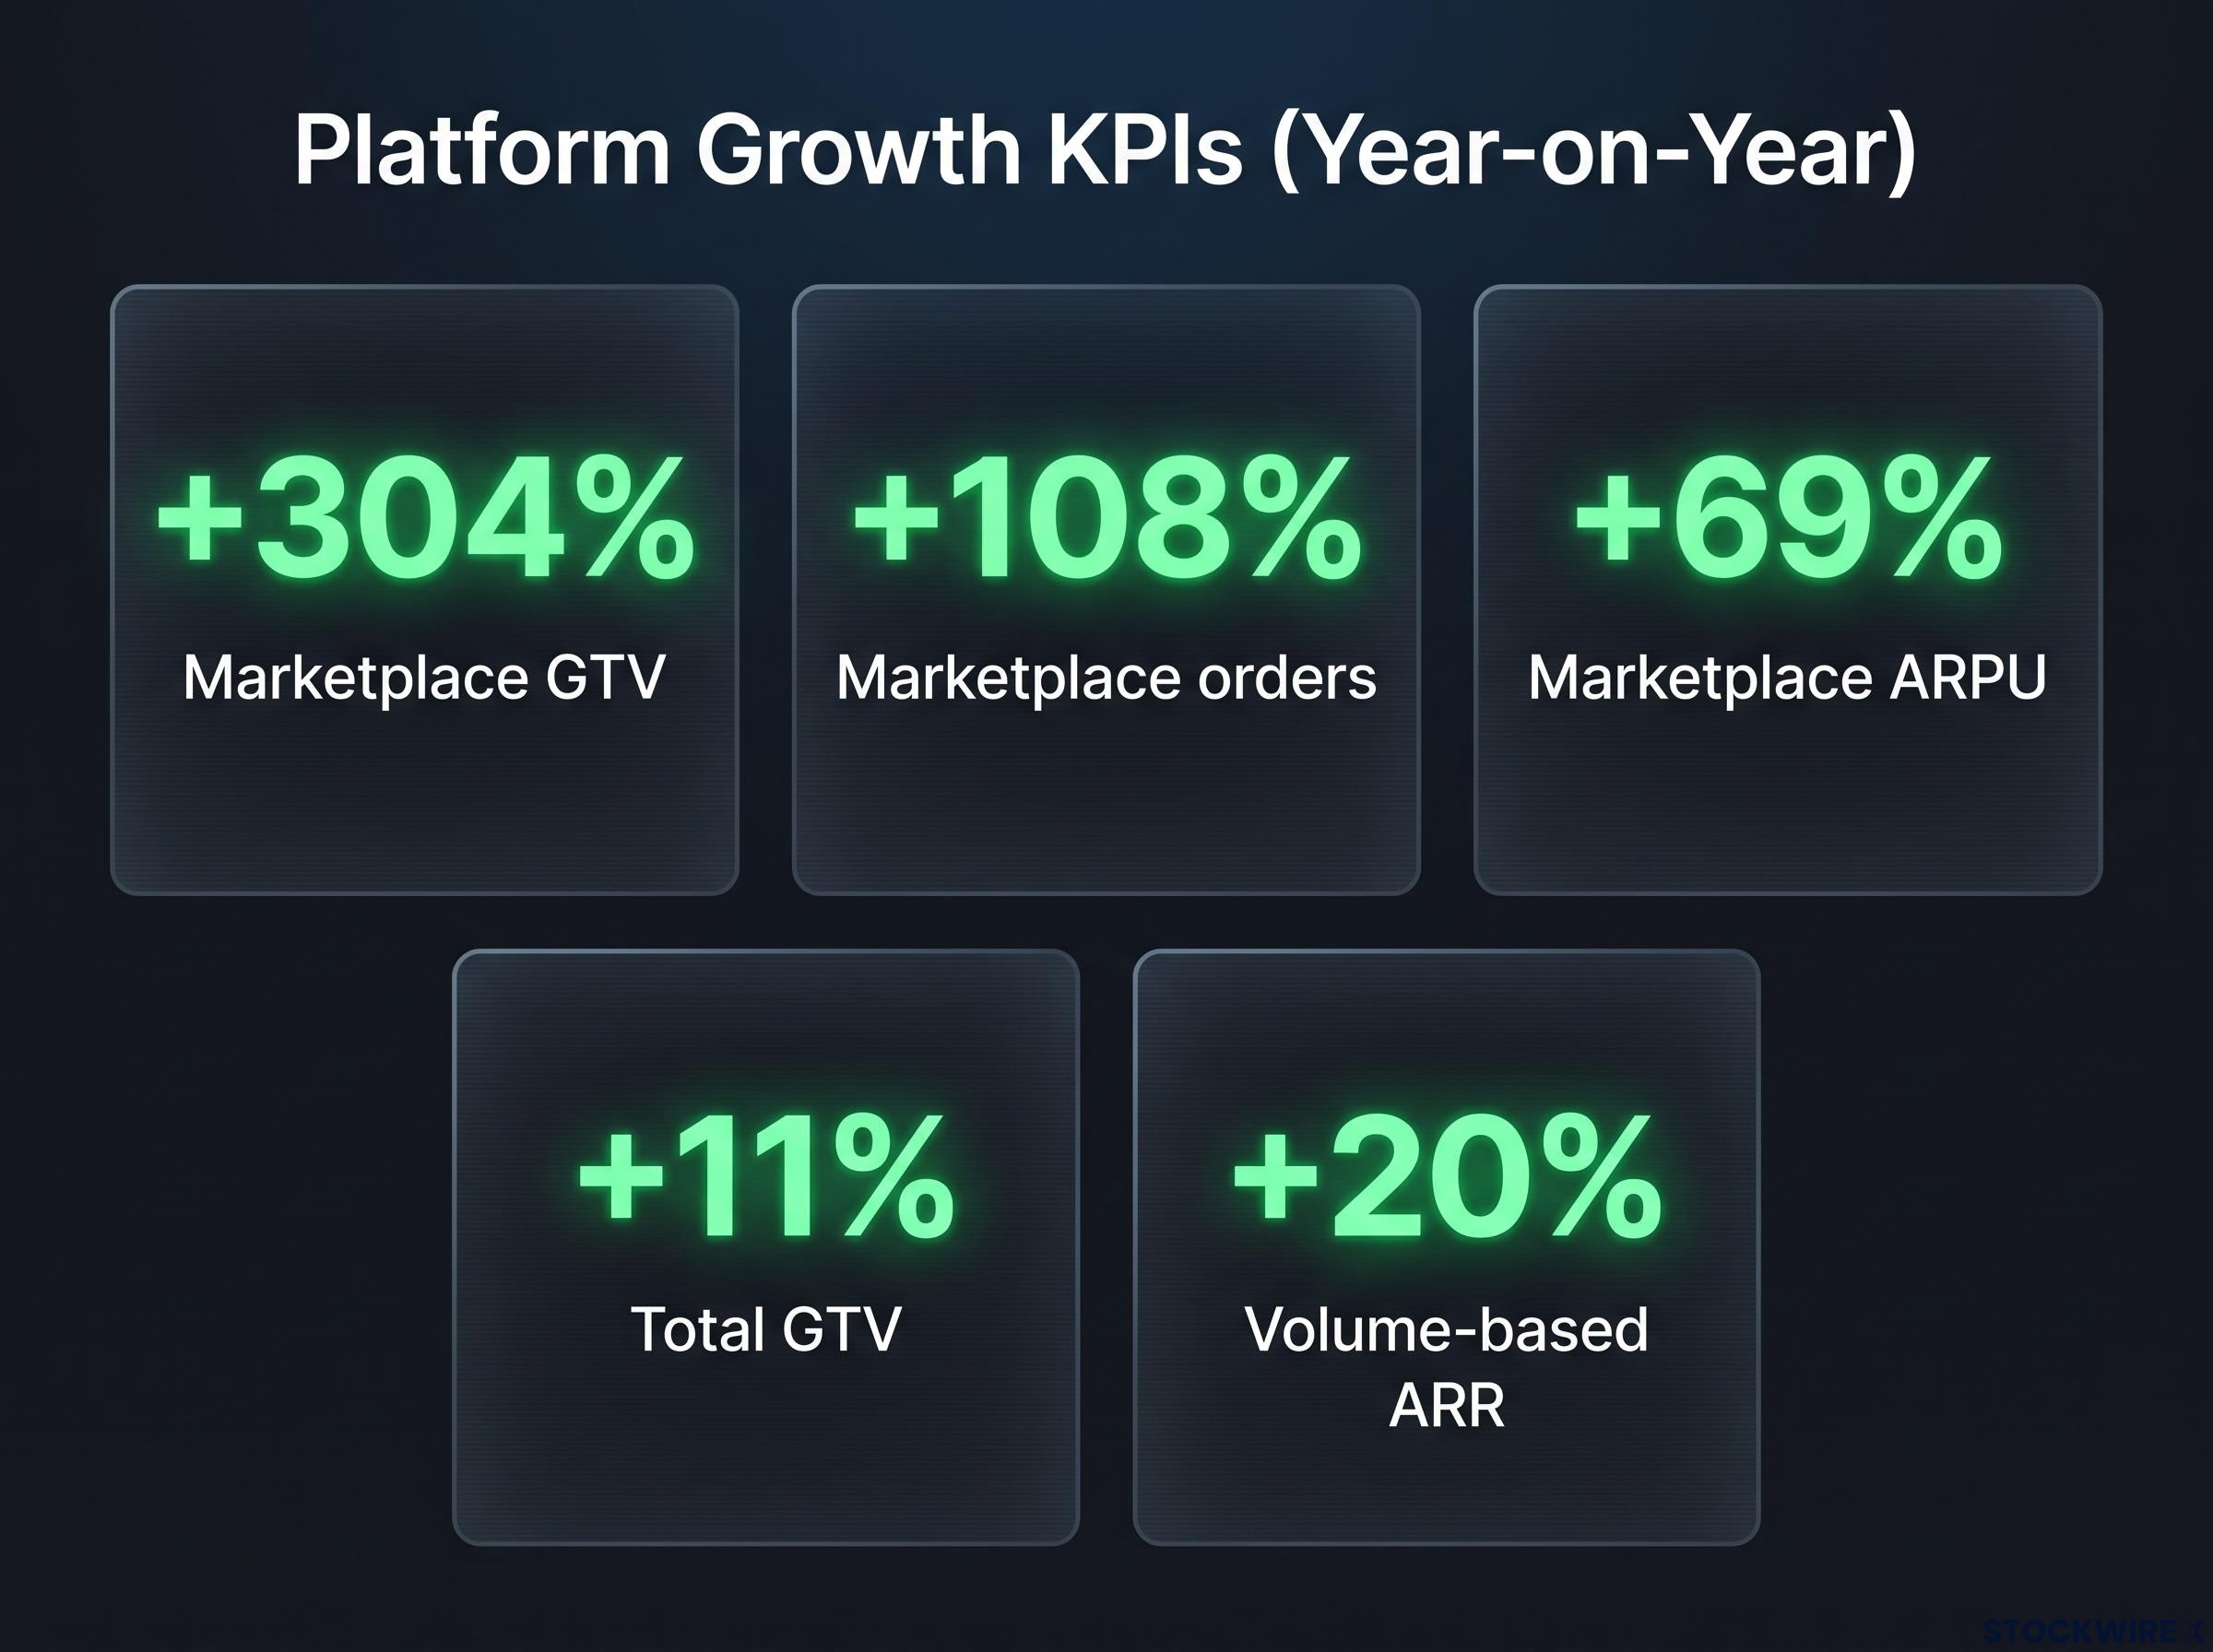
Platform metrics showed broad-based growth over the year. Total GTV rose 11%, the number of orders on the Single Platform increased 11%, and volume-based ARR grew 20%.
Average revenue per user (ARPU) also advanced on a June year-on-year basis, with Gateway up 10%, Marketplace up 69%, and Analytics up 12%. Marketplace scaling was particularly strong, with GTV up 304% and orders up 108% year-on-year.
Supplier transition to the Single Platform improved 13% year-on-year. As at FY26, 64% of suppliers (115 in total) were on Marketplace or the full Single Platform, up from 60% in FY25.
Early-stage cohort metrics comparing Q4 to Q3 FY26 offered encouraging leading indicators, though these are measured off a low base rather than an established run-rate:
-
Active user growth: +200% (target cohort)
-
Monthly repeat purchase rate: 77% (target cohort)
-
Total GTV growth: +340% (target cohort)
-
Monthly spend per pharmacy: +71% (target cohort)
FY27 focus: a year of execution
Management framed FY27 as a “year of execution” and outlined five strategic priorities:
-
Scale Marketplace to a $100m annualised GTV run rate
-
Expand margins, with +$200m GTV available to renew
-
Modernise and vertically expand EDI, targeting +40 suppliers across AU and NZ
-
Maximise the Sigma alliance, anchoring distribution across Australia’s largest pharmacy footprint
-
Grow data and analytics through partnership-led, data-as-a-service revenue
The company noted that contracted FY27 growth has already been secured via new partners including Boody, Pacific Optics, Kind Brands and Dedalus. In New Zealand, supplier growth is expected through Bargain Chemist and TONIQ, alongside vertical integration in partnership with Sigma.
The Sigma Gateway deployment in New Zealand, targeting approximately A$700,000 in ARR by year three at a 40% EBITDA margin, represents the first confirmed deliverable under the multi-year alliance and extends PharmX’s infrastructure to both sides of Sigma’s supply chain for the first time.
The presentation also referenced supportive market tailwinds. According to the IMARC Group, the Australian pharmacy retail market is forecast to reach $65.7b by 2034 at a 5.3% CAGR, while the e-pharmacy market is projected to grow at a 12.9% CAGR.
Capital structure snapshot
Key capital metrics as at 20 August 2026 were detailed as follows:
-
Share price: A$0.105
-
Shares on issue: 666.1m
-
Market cap: A$69.9m
-
Cash (30 June 2026): A$2.6m
-
Debt: Nil
-
Enterprise Value: A$67.3m
Major shareholders include CW Retail Holdings (10%) and Arrotex Investments Holding (9%), with the top 10 holders accounting for 68.4% of shares on issue.
PharmX FY26 Results Presentation
“Foundations laid in FY26 expected to convert to growth in FY27.”
PharmX enters FY27 EBITDA positive and debt-free, with a launched Marketplace, the Sigma Strategic Alliance, and contracted new partners underpinning its stated growth ambitions. Whether the early-stage Marketplace cohort metrics convert into a sustained run-rate will be a key measure of execution across the coming year.
Don’t Miss the Next ASX Tech Winner
Big News Blast delivers FREE breaking ASX tech news and in-depth analysis directly to your inbox within minutes of release. Join 20,000+ investors already staying ahead of the market. Click the “Free Alerts” button at StockWire X to get the next market-moving announcement the moment it drops.