
Trajan closes FY26 with H2 momentum despite forex headwinds
In its FY26 results presentation delivered on 27 August 2026, Trajan Group Holdings (ASX: TRJ) outlined a full-year performance where reported figures softened under a stronger Australian dollar, while the second half showed a clear recovery in profitability and margin.
The presentation was led by Chief Executive Officer Stephen Tomisich and Interim Chief Financial Officer Simon Billingham, covering the period 1 July 2025 to 30 June 2026. Trajan is a global developer and manufacturer of analytical and life science products, operating with approximately 600 people across nine manufacturing and operations sites in the US, Australia, Europe and Asia.
Management detailed the headline full-year numbers as follows:
- Group Revenue of $161.4M, down 3.1% on the prior comparable period (PCP) of $166.5M
- Group nEBITDA of $13.2M, down 14.7% from $15.5M
- Operating NPATA of $2.2M, up 191.3% from $0.8M
The central tension in the result is that reported declines were largely currency-driven. Management noted that AUD appreciation in the second half impacted reported results by approximately $5.0M in revenue and $2.4M in nEBITDA, while underlying performance strengthened as the year progressed.
When big ASX news breaks, our subscribers know first
FY26 financial results at a glance
The full-year scorecard, presented below, highlights the sharp improvement in Operating NPATA alongside the softer reported revenue and margin figures.
| Metric | FY26 | FY25 (PCP) | Change |
|---|---|---|---|
| Group Revenue | $161.4M | $166.5M | Down 3.1% |
| Group nEBITDA | $13.2M | $15.5M | Down 14.7% |
| Proforma Gross Margin | 38.9% | 39.8% | Down 0.8pts |
| Operating NPATA | $2.2M | $0.8M | Up 191.3% |
| Cash | $12.6M | $11.9M | Up 6.5% |
| Net Debt | $34.6M | $29.5M | Up 17.0% |
The second-half turnaround
The core positive narrative from the presentation was the recovery between the first and second halves of the year. Management detailed that H2 nEBITDA rose to $8.1M, up 61.8% on H1’s $5.0M, driven by the realisation of cost efficiency measures.
The H1 FY26 results had already signalled the trajectory, with nEBITDA compressed to $5.0M in the first half as forex headwinds and capital equipment softness weighed on reported figures, even as the Capital Equipment order book and pricing actions laid the groundwork for the H2 recovery that followed.
On a fixed-currency basis, adjusting the second half back to H1 forex rates, H2 nEBITDA reached $10.5M, a 109.3% uplift. Proforma gross margin also lifted 3.2 points from H1 (37.4%) to H2 (40.6%).
Management noted that on an FX-adjusted basis, full-year nEBITDA landed within 2.5% of guidance and revenue within 2.2%. For investors, the trajectory into FY27, rather than the headline decline, is the key signal from the result.

What drove the numbers, forex and market headwinds
With approximately 85% of Trajan revenues derived in USD and EUR, the sustained appreciation of the Australian dollar in the second half weighed directly on reported figures. The presentation set out several pressures on the full-year result:
-
Government funding delays impacting sales, notably in North America
-
Restructures in pharma and food accounts preventing some planned Capital Equipment purchases
-
A general slowdown in growth across the food sector, most likely linked to macroeconomic volatility
-
AUD appreciation in H2, impacting revenue by approximately $5.0M and nEBITDA by approximately $2.4M
Cost discipline delivering tangible gains
Management outlined the operational initiatives that fed the second-half uplift, each contributing measurable gains:
-
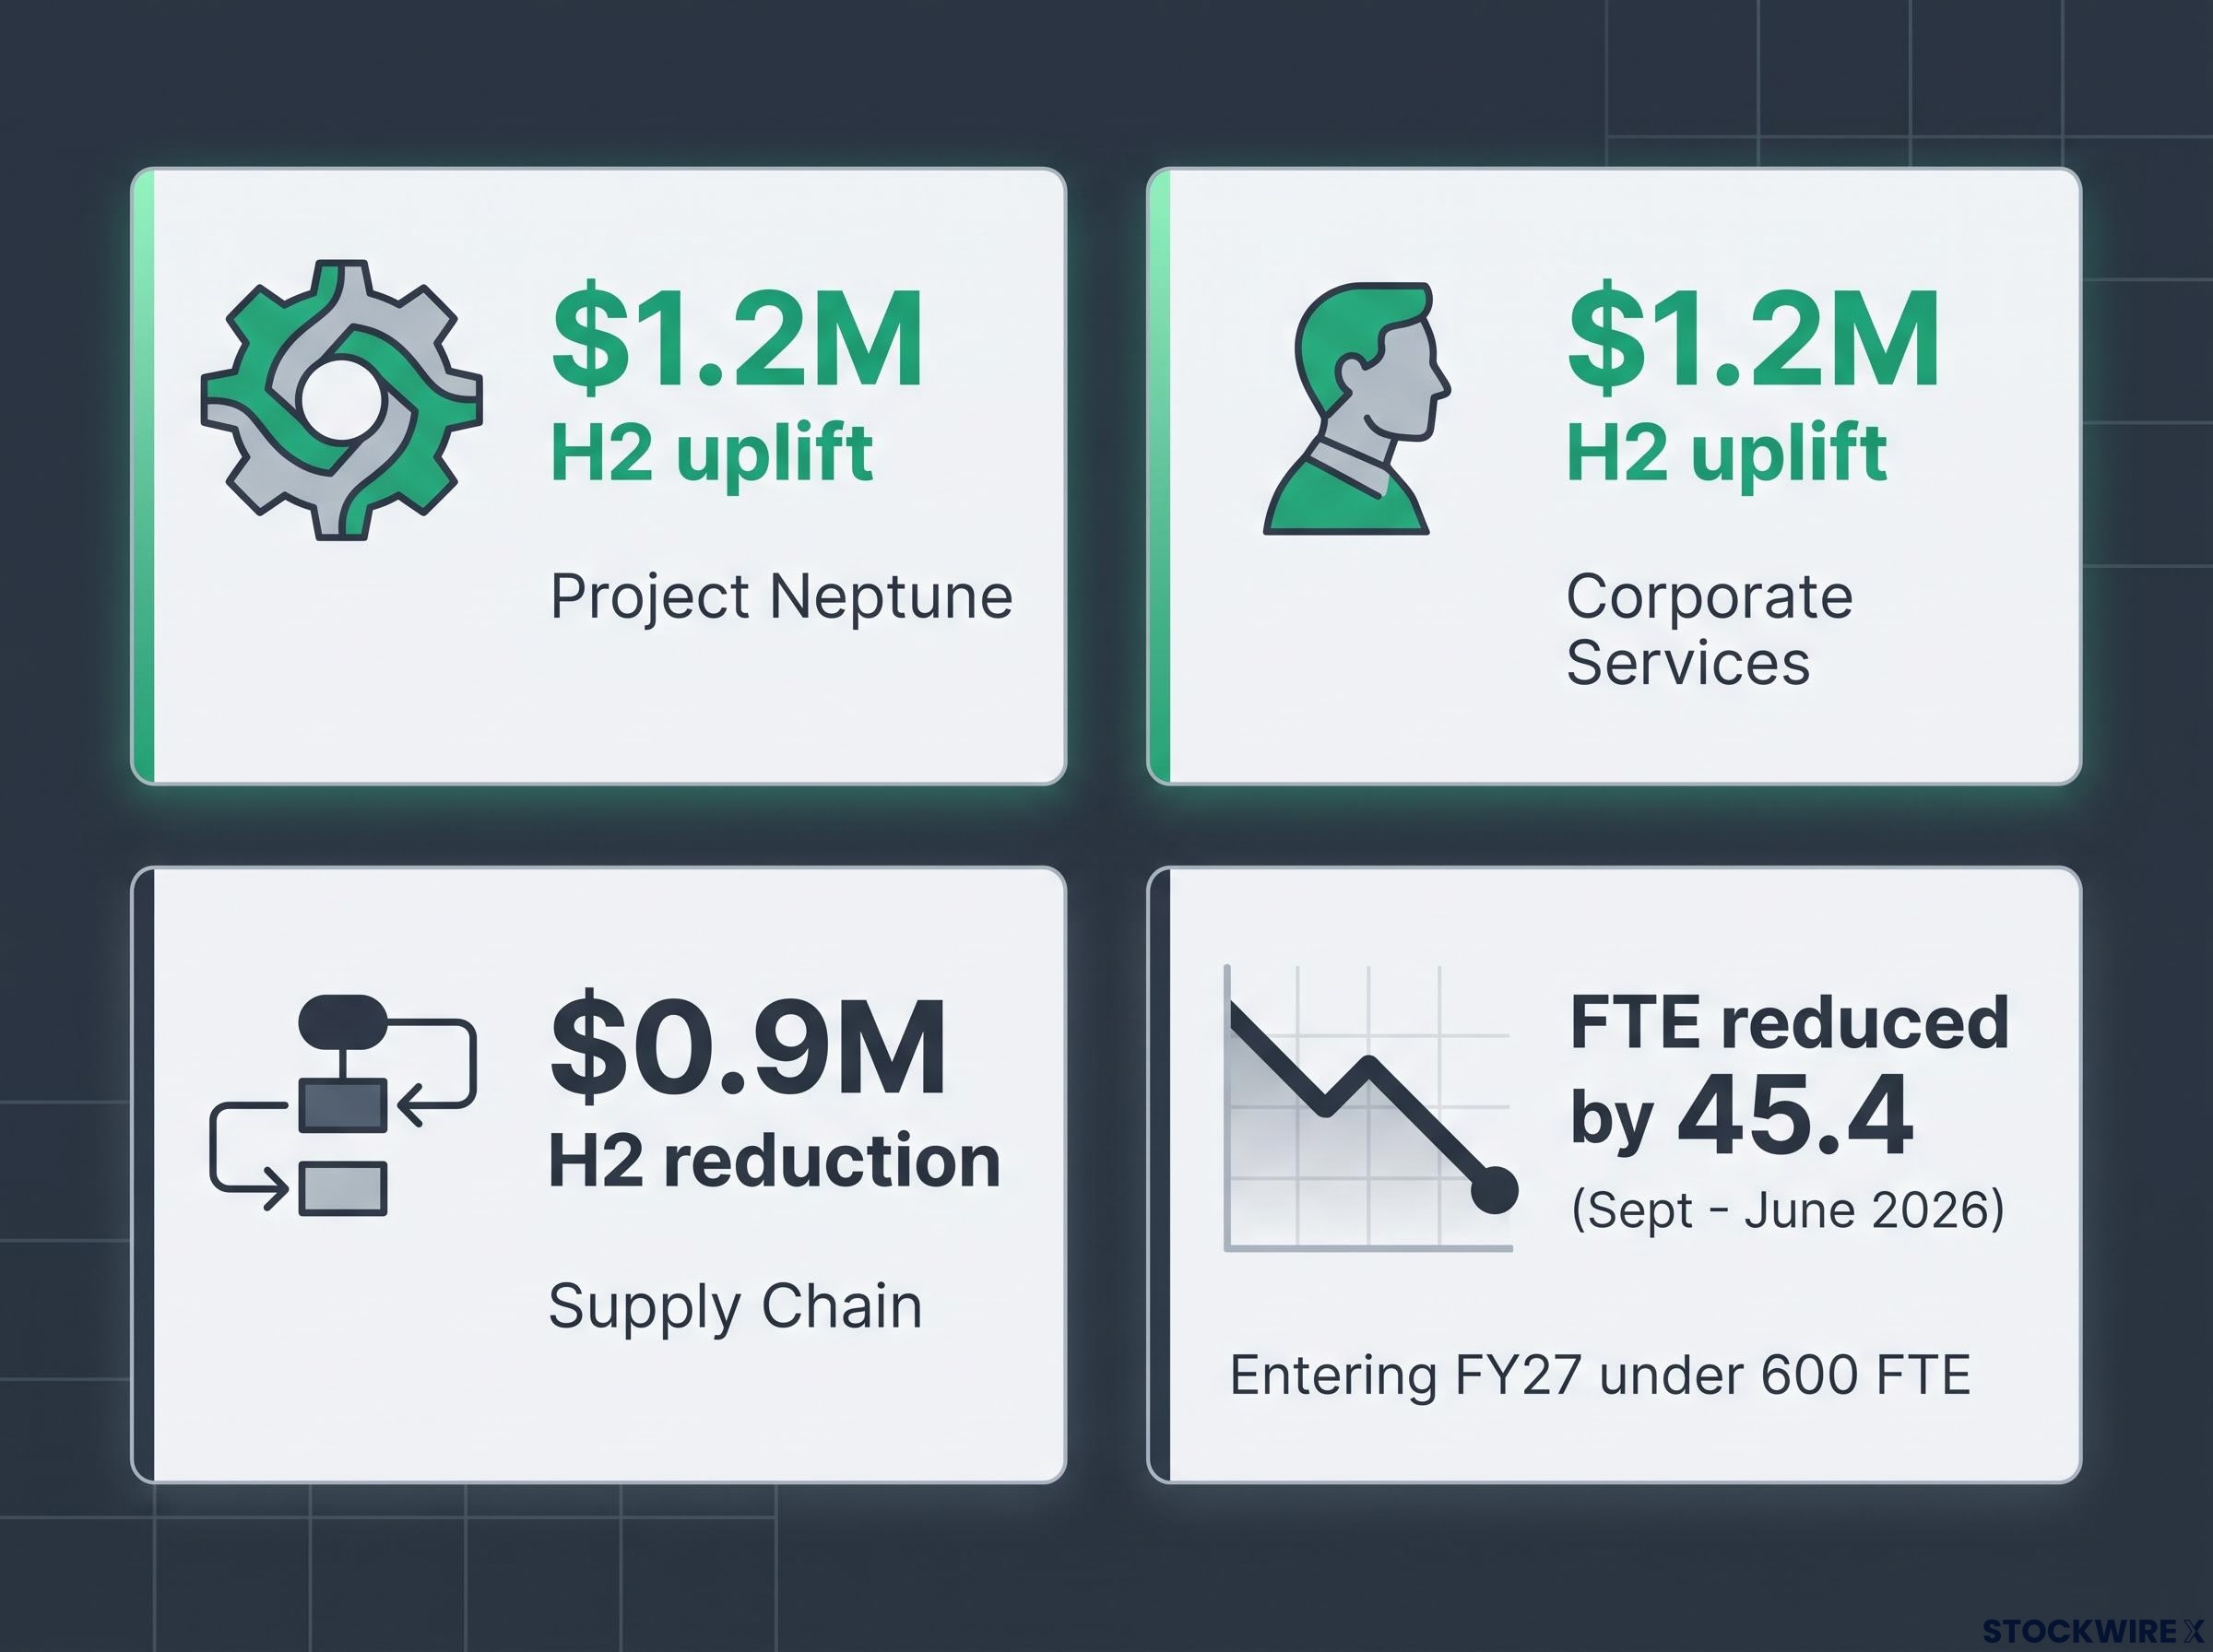
Project Neptune cost reductions across headcount and facilities delivered an uplift of $1.2M in H2
-
A reduction in Corporate Services headcount achieved a further uplift of $1.2M in H2
-
Pricing actions effective 1 January 2026 contributed a 3.2-point gross margin gain in H2 over H1
-
A supply chain growth initiative contributed a reduction of approximately $0.9M in H2
Full-time equivalents (FTE) reduced by 45.4 from September to June 2026, with Trajan entering FY27 now under 600 FTE.
Understanding Trajan’s three operating segments
Trajan reports across three operating segments, a structure that balances stable recurring income, order-driven capital sales and an emerging growth area.
Components & Consumables is the largest and most stable segment, generating recurring revenue through multiple channels to market. Capital Equipment covers instruments, software and customised automation for clinical, pharmaceutical, food and environmental analysis. Disruptive Technologies comprises decentralised microsampling, including Mitra® devices, and represents the emerging growth engine.
| Segment | FY26 Net Revenue | Change | Gross Margin | FY26 nEBITDA |
|---|---|---|---|---|
| Components & Consumables | $102.6M | Flat (FY25 $102.7M) | 39.3% (down 2.3pts) | $32.1M (down 7.9%) |
| Capital Equipment | $52.9M | Down 9.7% | 36.3% (up 1.2pts) | $8.6M (down 11.7%) |
| Disruptive Technologies | $5.9M | Up 14.2% | 57.2% (up 0.2pts) | ($0.6M) (improved 58.2%) |
The standouts across the segments included:
-
Components & Consumables: fixed-FX sales growth of +2.2%, with margin recovering from 37.5% (H1) to 41.0% (H2), supported by new launches including CB Emitters and Pure-Pass GLC well plates.
-
Capital Equipment: softer revenue, offset by a year-end order book of $8.7M and gross margin expansion to 36.3%.
-
Disruptive Technologies: Mitra® devices are now used as a routine tool in therapeutic drug monitoring of transplant patients in Europe, with a new microsampling product launch planned for FY27.
Cash flow and balance sheet position
The presentation addressed a softer cash conversion result, which management attributed to deliberate working-capital investment rather than operational weakness. Normalised operating cash flow was $1.5M (FY25: $13.4M), while free cash flow was ($1.9M) (FY25: $9.3M).
The cash conversion ratio fell to 0.11 (FY25: 0.86), reflecting strategic working-capital investment, the timing of the ERP implementation in Germany, and the company’s “in-region, for-region” strategy in H1.
Trajan ended the year with cash of $12.6M and net debt of $34.6M, up 17%. Management stated that, supported by a robust cash balance, its capital management priorities include inventory optimisation and debt reduction.
FY27 outlook and guidance
Looking ahead, management set out expectations for FY27 even at current exchange rates:
-
Mid-single digit organic revenue growth in FY27
-
Double-digit nEBITDA growth in FY27 over the prior comparable period
More specific FY27 revenue and nEBITDA targets are anticipated to be provided post-Q1, at the October AGM.
Management Outlook
Management noted that nEBITDA momentum is expected to continue, with the cost base reducing further, and that Trajan expects to return to a debt reduction mode with improved cash conversion.
On currency, the company detailed hedging cover at sub-USD $0.70 through to June 2027, with offshore manufacturing progression expected to reduce AUD exposure over time. Management indicated that pharma is back in growth mode with new product releases planned, while modest growth is planned in Capital Equipment.
Trajan enters FY27 with a leaner cost base, strengthening second-half momentum, a growing order book and hedging cover in place, framing the recovery narrative that management put to investors at the results presentation.
Don’t Miss the Next Healthcare & Manufacturing Breakout
Get FREE breaking ASX news delivered to your inbox within minutes of release, complete with in-depth analysis already done for you. Join 20,000+ subscribers who stay ahead of the market the moment announcements drop. Click the “Free Alerts” button at Big News Blast to start receiving alerts across Healthcare, Manufacturing and beyond.