
Liberty Financial Group delivers 7% profit growth in FY26 results
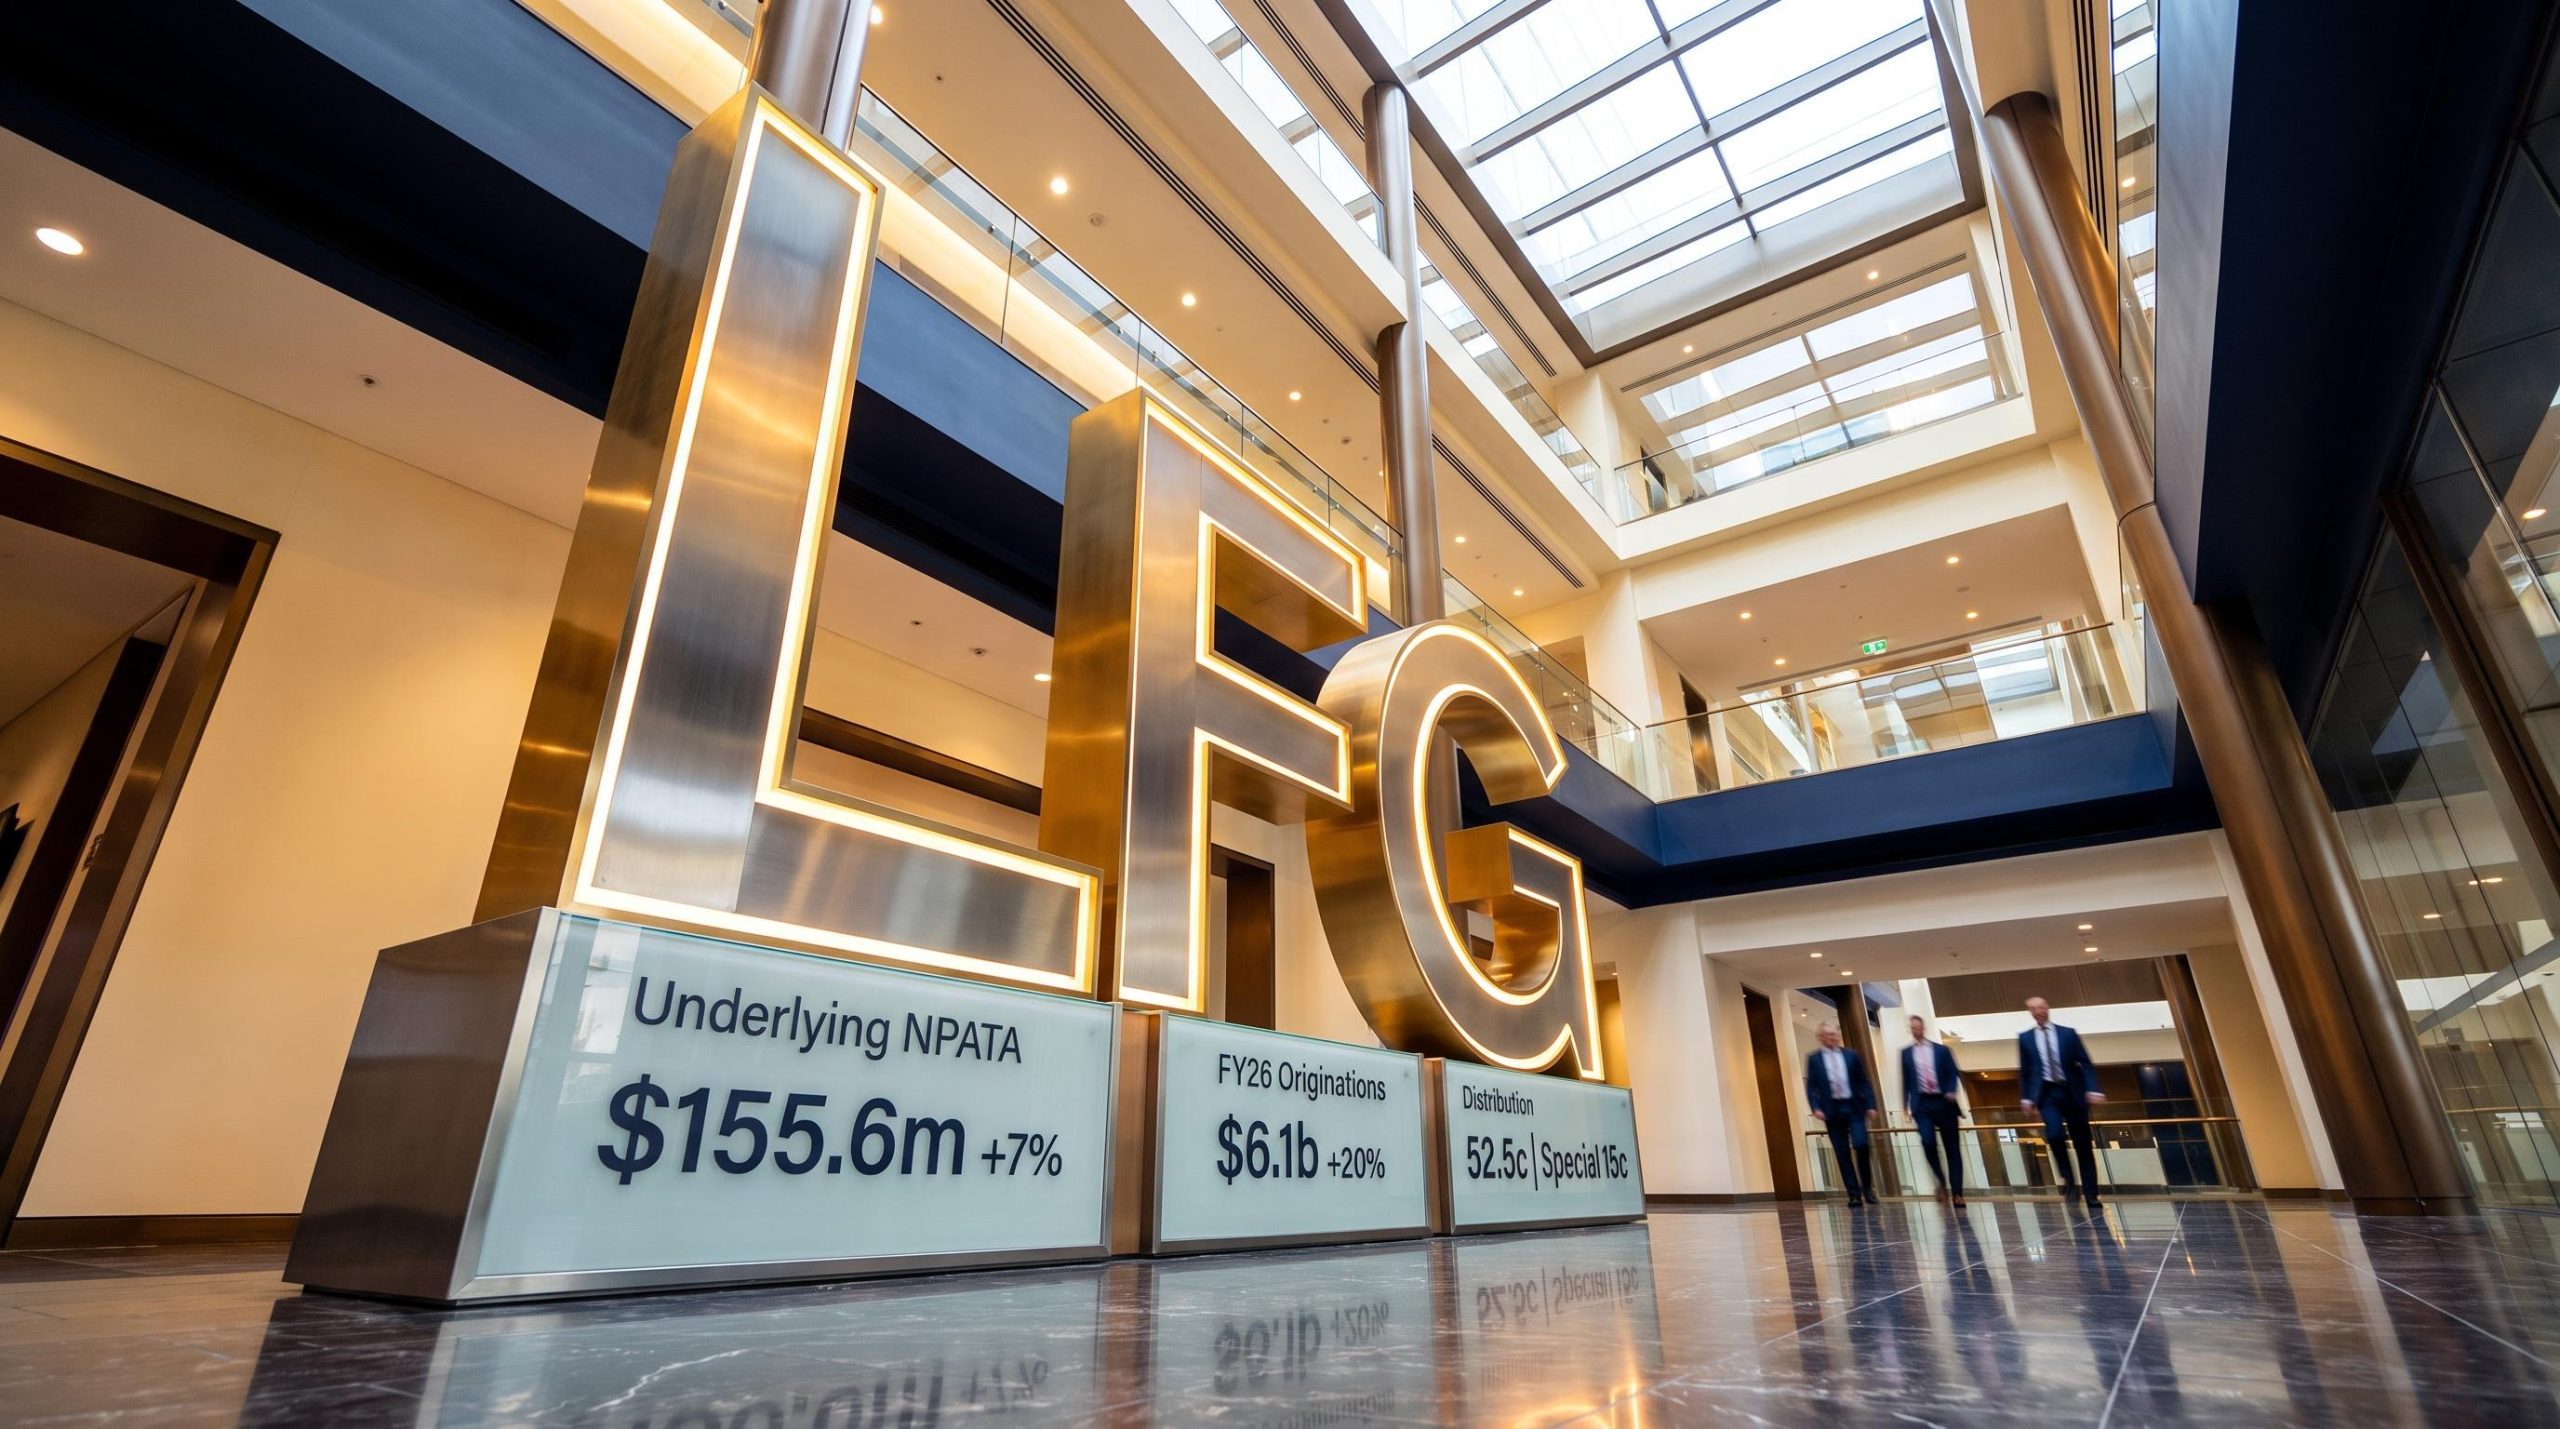
In its FY26 full year results presentation delivered on 24 August 2026 by Chief Executive Officer James Boyle and Chief Financial Officer Peter Riedel, Liberty Financial Group reported underlying NPATA of $155.6m, up 7% on FY25 ($145.0m) and 18% higher since FY24.
The company delivered record FY26 originations of $6.1b, an increase of 20%, alongside a 13.1% cash return on equity (ROE). Management framed the year around continued profit momentum, net interest margin (NIM) expansion, resilient credit quality and compelling distributions to securityholders, positioning the non-bank lender as a consistently growing, investment-grade business.
When big ASX news breaks, our subscribers know first
The FY26 numbers that matter
The presentation detailed a set of headline metrics that reflected margin expansion and disciplined cost management across the reporting period.
| Metric | FY26 | FY25 | Change |
|---|---|---|---|
| Underlying NPATA | $155.6m | $145.0m | +7% |
| Net revenue | $626m | $604m | +4% |
| NIM | 2.50% | 2.49% | +1bps |
| Cost to income | 26.8% | 27.1% | −30bps |
| Distribution | 52.5c | 51.9c | +1% |
| New assets originated | $6.1b | $5.1b | +20% |
The FY26 distribution of 52.5c includes a 15c special dividend payable on 21 September 2026. Additional operating highlights recorded across the year included:
-
Financial assets of $15.2b, up 3%
-
Broker Net Promoter Score (NPS) of 89, up from 83
-
Average full-time equivalent (FTE) staff of 511, down 2%
Behind the numbers: NIM expansion and record originations
Management attributed the NPATA lift primarily to higher net interest income of $9m, driven by portfolio growth and NIM expansion, together with higher net fee and commission income of $2m from increased originations and distribution business volumes.
NIM expanded to 2.55% in the second half of FY26, up from 2.50% in the prior corresponding half, supported by asset mix and positive funding markets.
On funding, the company reported that all $5.5b of maturing facilities in 2H26 were renewed on improved or equivalent terms, reflecting continued positive funding conditions. The May-26 medium-term note (MTN) maturity of $200m was replaced with a new $300m MTN at an improved margin of 78bps, with FY26 term issuance totalling $4.7b.
Cost to income remained stable at approximately 27%, with the modest 2H26 uptick attributable to the Moula acquisition completed in December 2025. Excluding Moula, cash expenses declined $1m in 2H26.
A note on credit quality
Bad and doubtful debts (BDD) remained stable at 19bps. The +30 day delinquency rate stood at 3.97% at 2H26, already reduced to 3.85% at 31 July 2026.
The presentation noted that 74% of customers in 90+ day delinquency were supported by property security, at an average loan-to-value ratio (LVR) of 68%. The collective provision increased to $65m, reflecting a more conservative economic outlook and portfolio growth. Together, these metrics indicate earnings quality underpinned by margin, funding strength and disciplined arrears management.
What is a non-bank lender, and why does NIM matter?
Liberty is described as the only investment-grade non-bank, holding a BBB/stable rating from Standard & Poor’s. Founded in 1997, it operates across three segments: Residential Finance, Secured Finance and Financial Services.
Management highlighted that LFG’s 2.50% NIM leads its peer set, where banks ranged between 1.53% and 2.05%. Its cost-to-income ratio of 44.9% was also cited as among the lowest across the comparison group, underscoring why the company’s peer-leading metrics matter to the investment case.
A standout yield: how Liberty compares to the major banks
The presentation outlined a distribution story built on frequency and scale. Four quarterly interim distributions of 7.5c were paid across FY26, with a final distribution of 7.5c, a 15c special dividend, and the first FY27 quarterly interim distribution of 8c all payable on 21 September 2026.
FY26 distributions and special dividends equate to a 16.3% yield based on the 30 June 2026 security price of $3.23. Over a three-year period, LFG recorded an average dividend yield of 9.2% (plus 3.4% in special dividends), compared with the Big 4: CBA at 3.7%, WBC at 5.5%, NAB at 5.3% and ANZ at 5.7%.
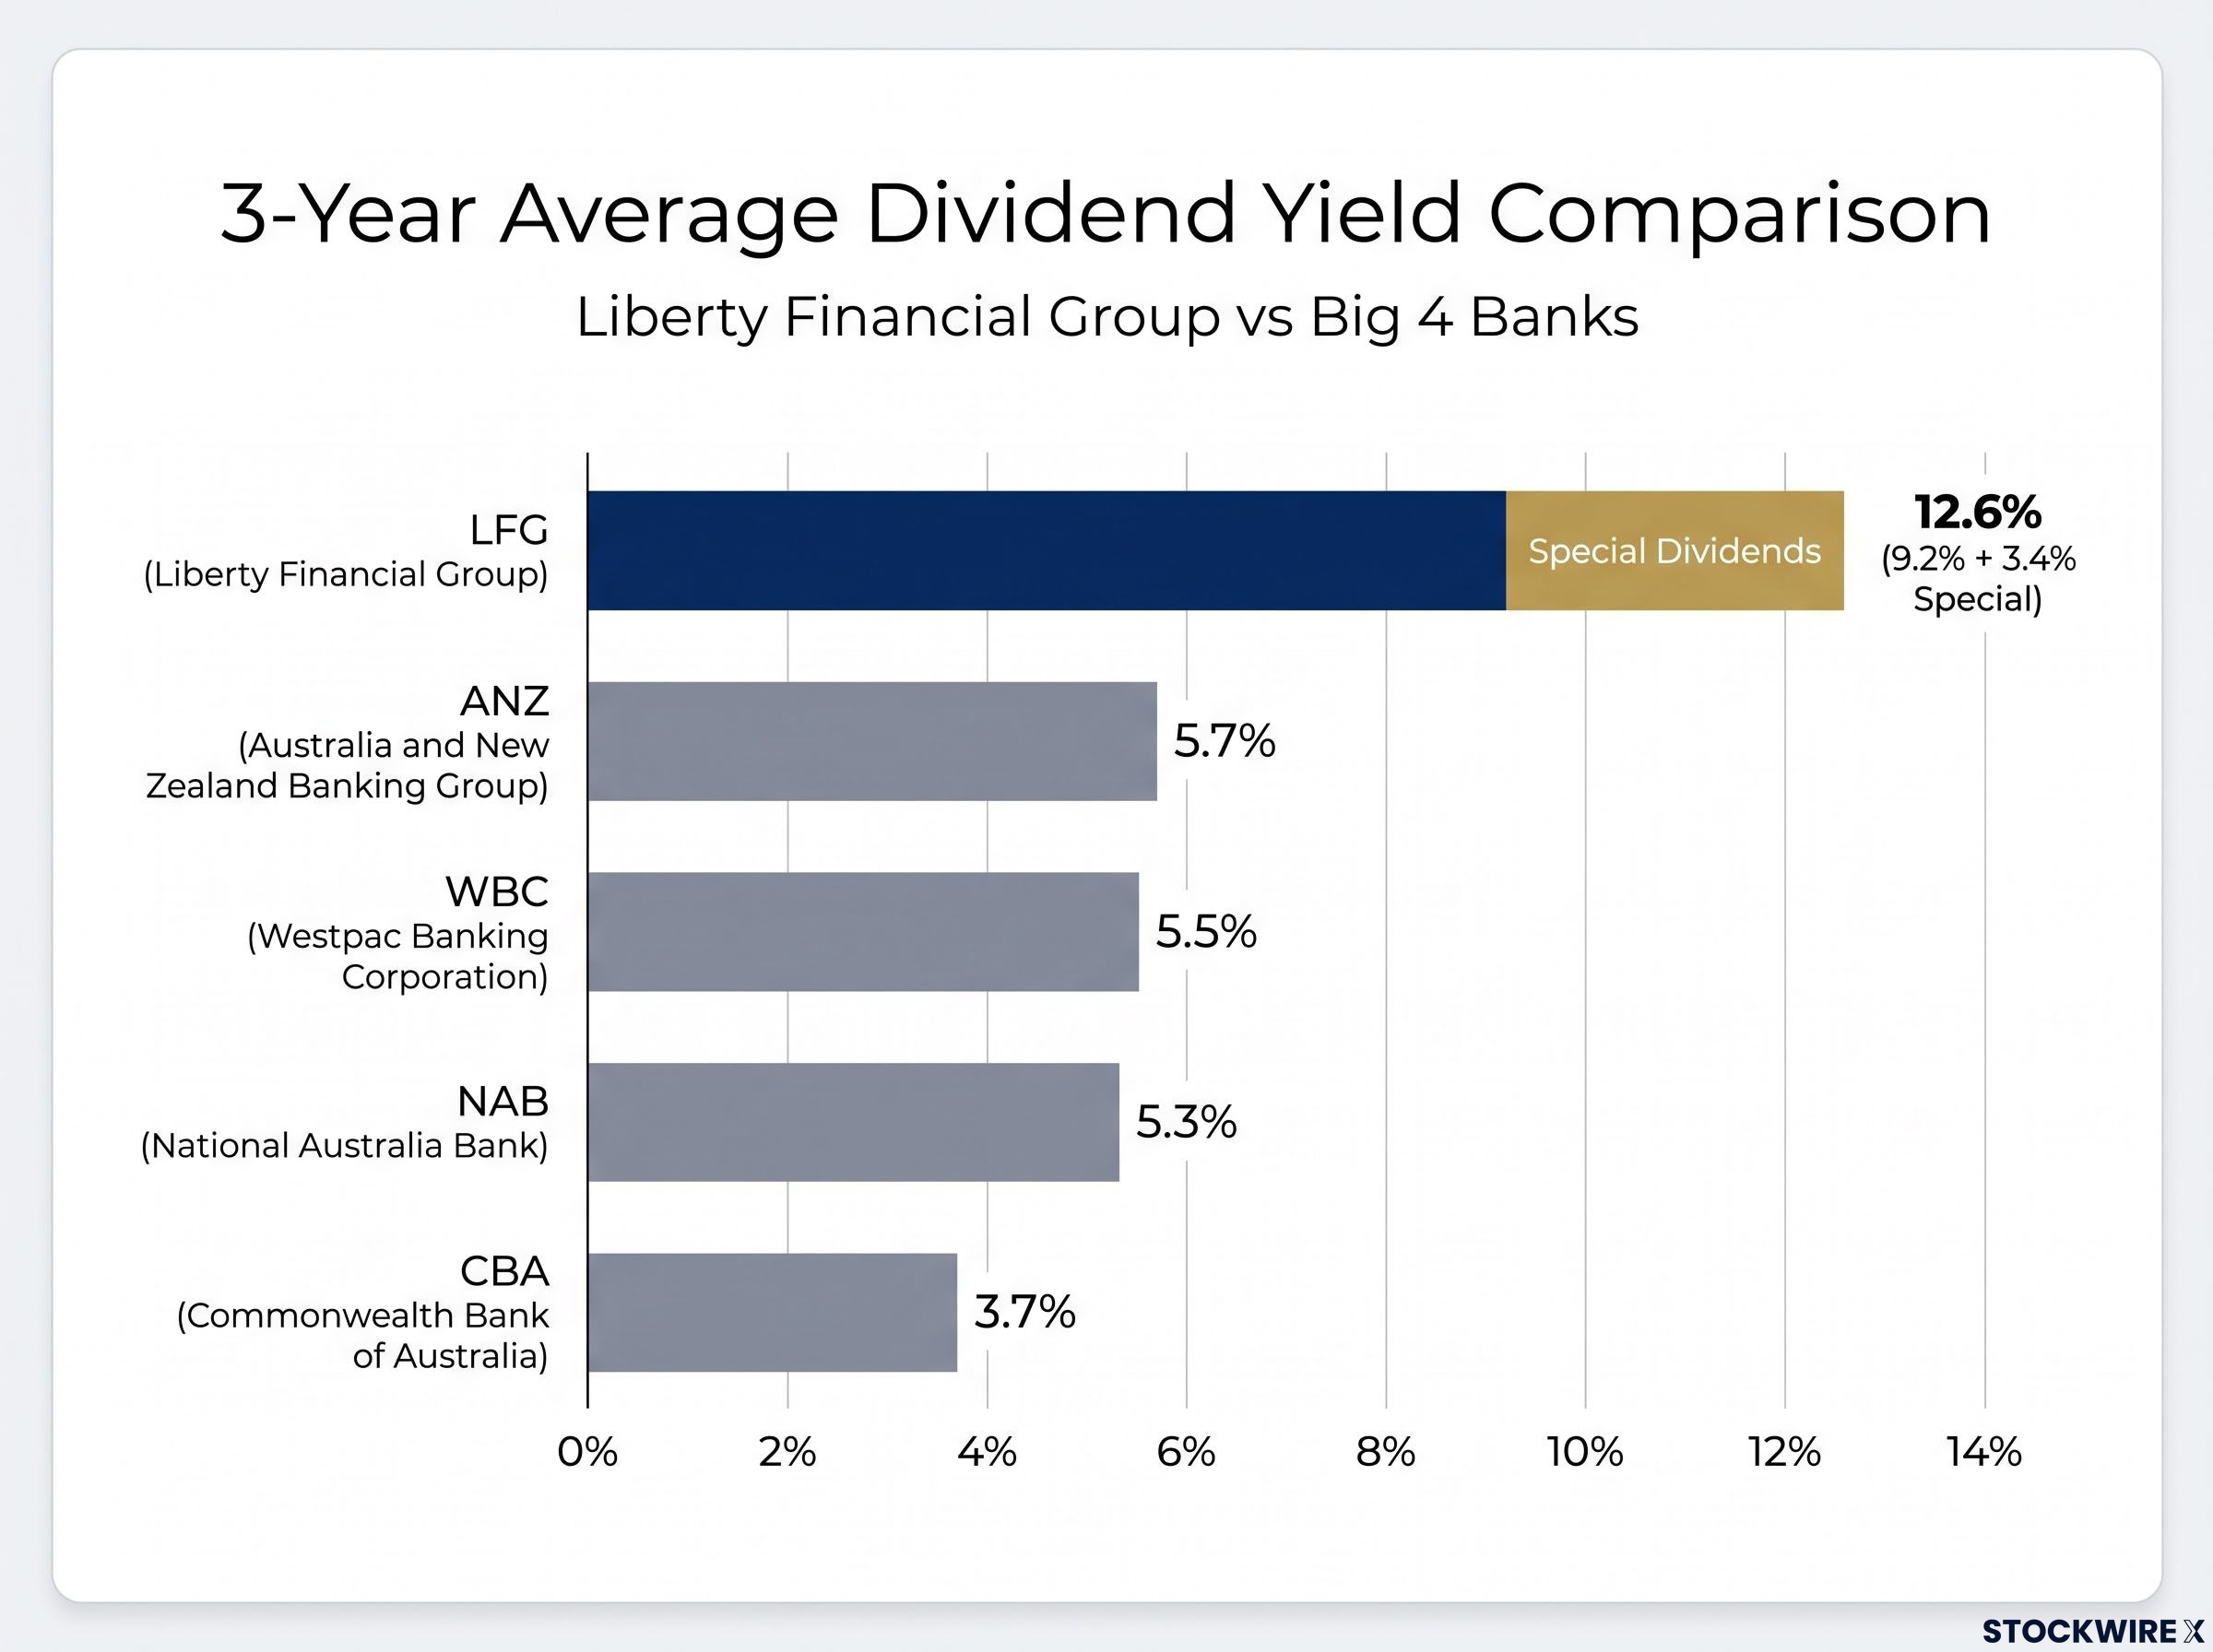
Distributions are unfranked and taxed at the holder’s marginal rate, with a franking credit balance of $42m providing $98m in franked dividend headroom. The company noted its distribution has grown 40% since FY24 (excluding special dividends), while Big 4 dividends remained broadly flat.
Management commentary
The FY26 presentation contained no direct verbatim quotes. Management reinforced consistent, compelling distributions to securityholders and continued profit growth momentum as central themes of the result.
Where Liberty is heading next
Segment momentum supported the record group originations. The residential portfolio remained stable, commercial lending growth stayed strong, motor finance returned to growth in 2H26, and Financial Services was supported by the Moula acquisition.
The portfolio mix continued shifting toward higher-yielding Secured and Financial Services assets, which reached 50% of the portfolio at 2H26 (up from 48% at 1H26).
Management’s disclosed outlook priorities included:
-
An environment that supports continued differentiation
-
Favourable funding markets expected to continue supporting NIM
-
Automation and digital investment to maintain leading operational efficiency
-
Continued NIM, cost-to-income and return-on-assets peer outperformance
-
Acknowledgement that increasing interest rates may pressure delinquency
On people and culture, the company was recognised as an AFR Best Places to Work (Large Organisation) 2026, achieved a top-quartile B Corp Impact Score, and reported that 98% of team members felt proud to work at Liberty. The combination positions LFG for continued differentiated growth backed by a conservative, investment-grade balance sheet.
Stay Ahead on ASX Finance and Fintech News
Get FREE breaking ASX announcements delivered to your inbox within minutes, complete with in-depth analysis already done for you. Join 20,000+ investors who never miss a market-moving update across finance, fintech and beyond. Click the “Free Alerts” button at Big News Blast to start receiving alerts the moment news breaks.