
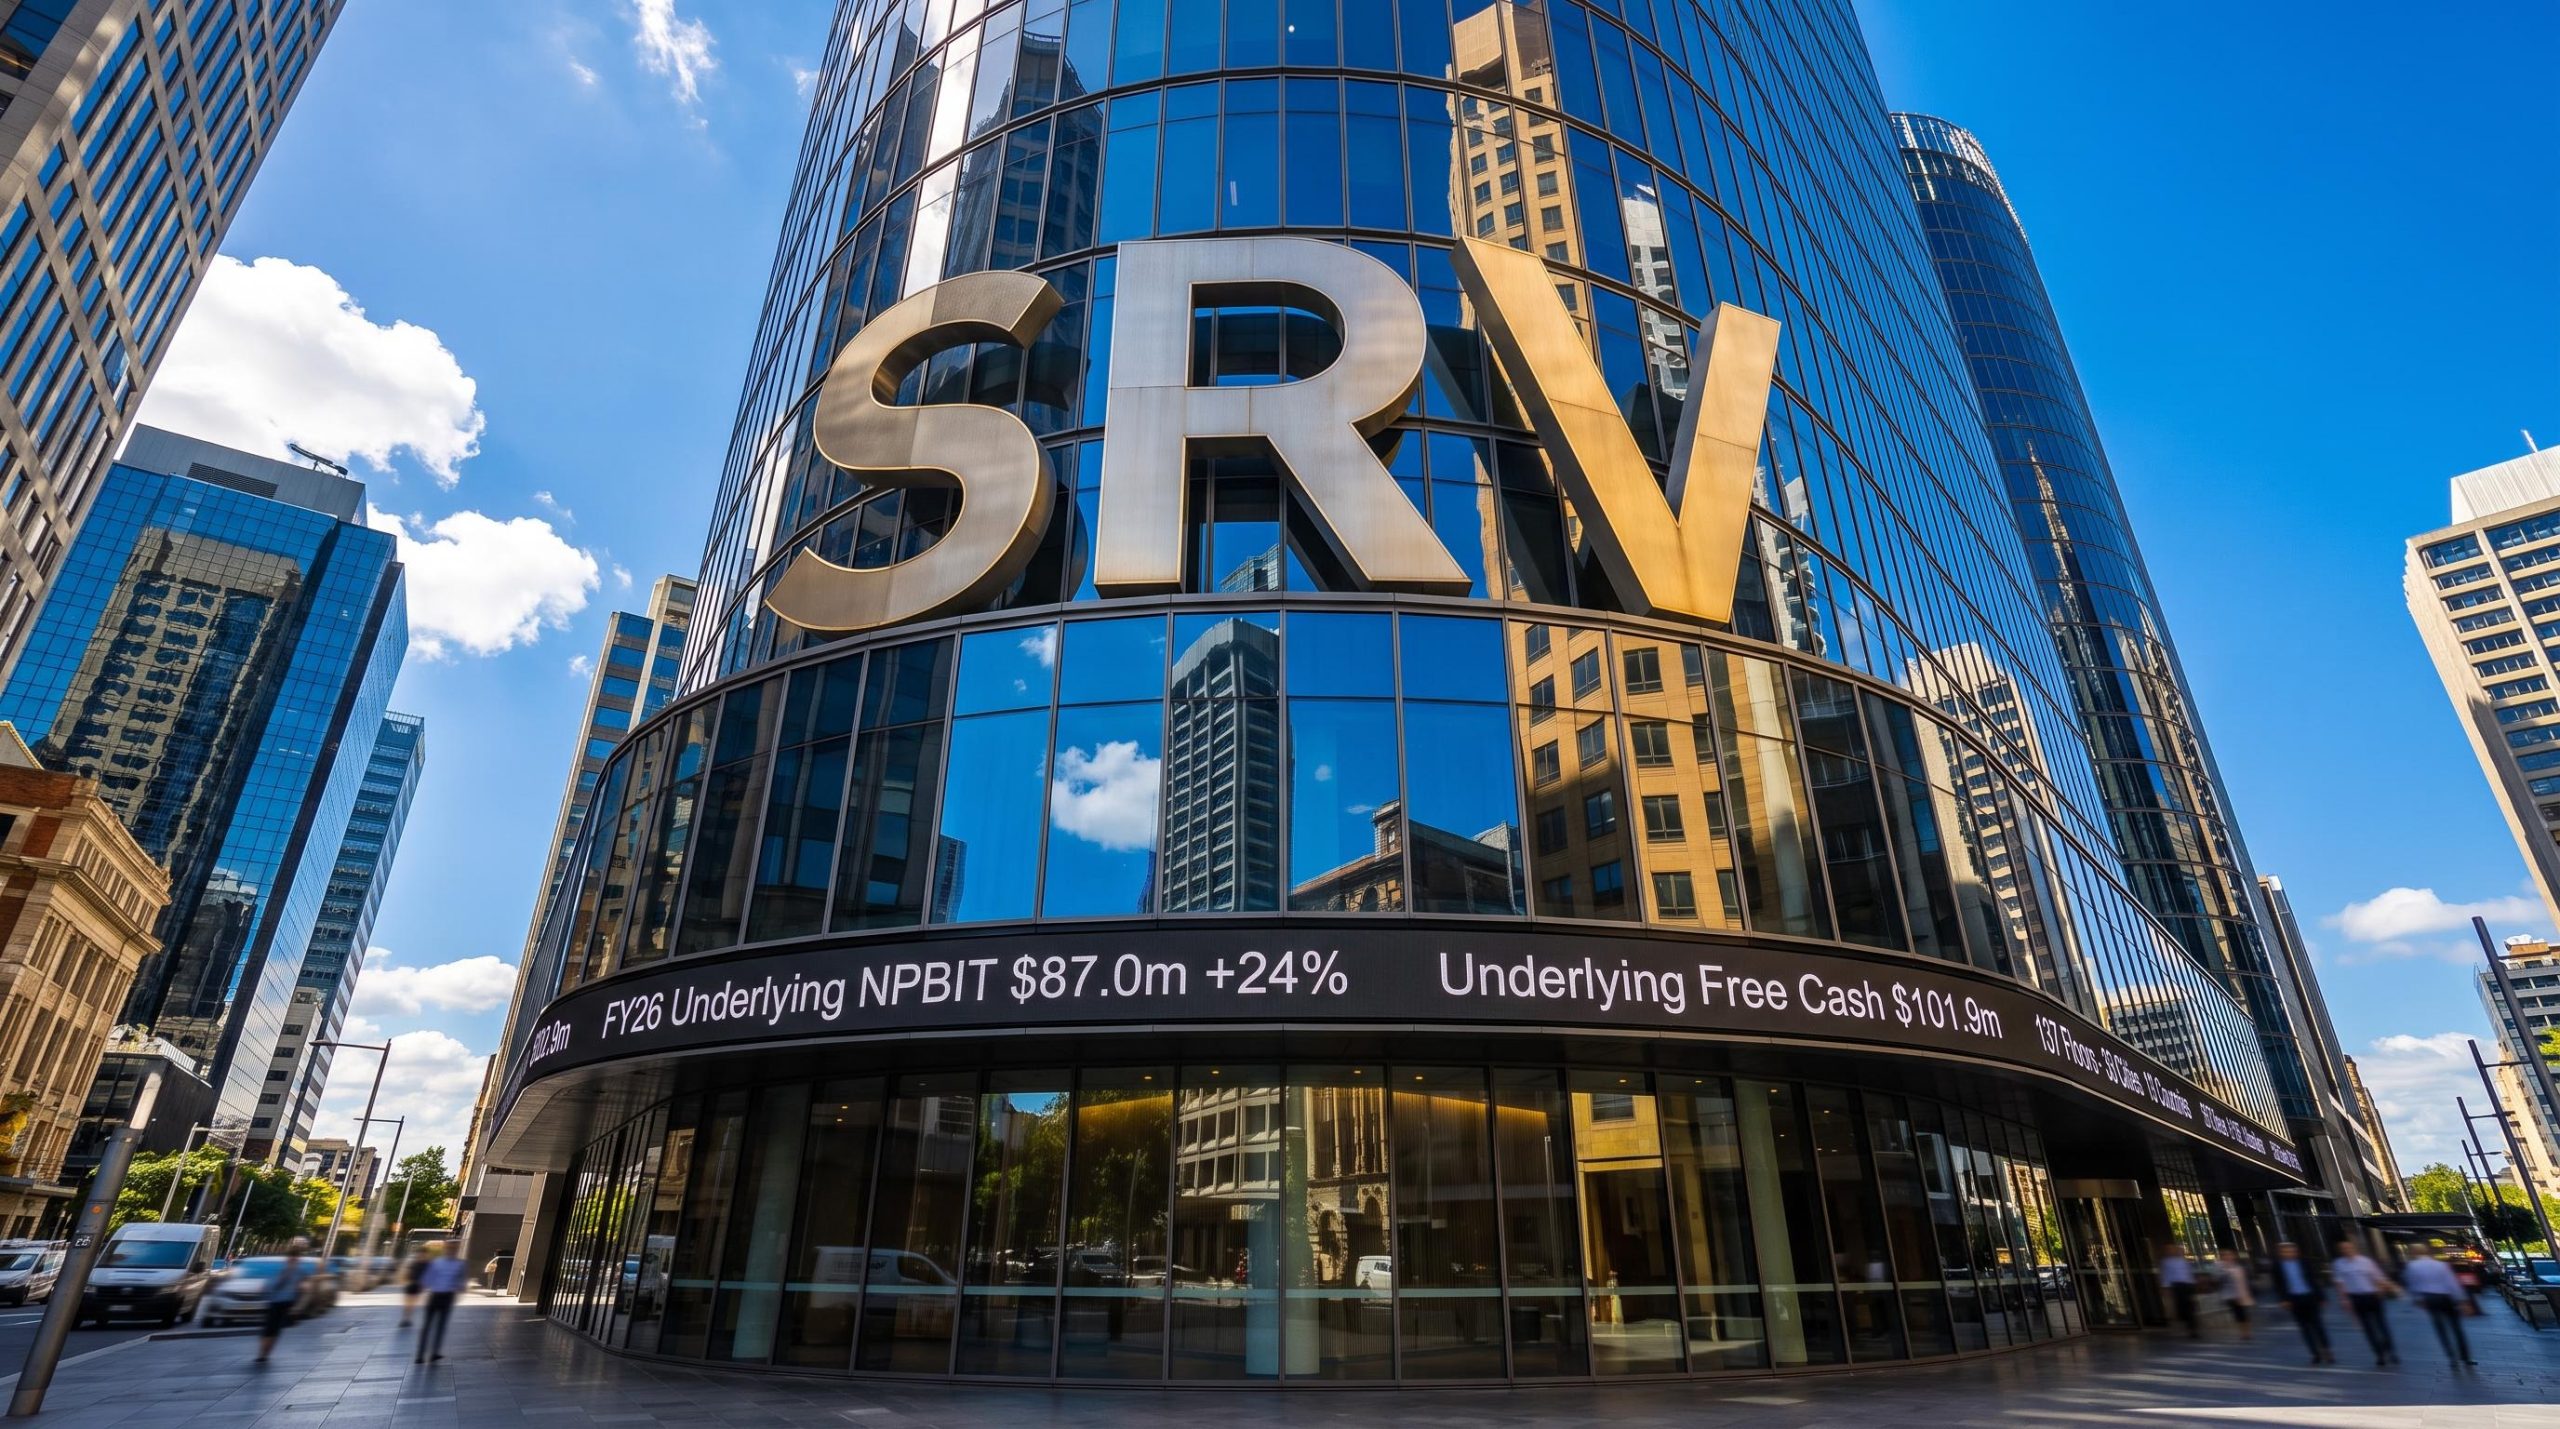
Servcorp delivers record FY26 earnings of $87.0m as global platform scales
In its FY26 results presentation, published 20 August 2026 for the financial year ended 30 June 2026, Servcorp reported results that outperformed its upgraded profit guidance across every headline measure.
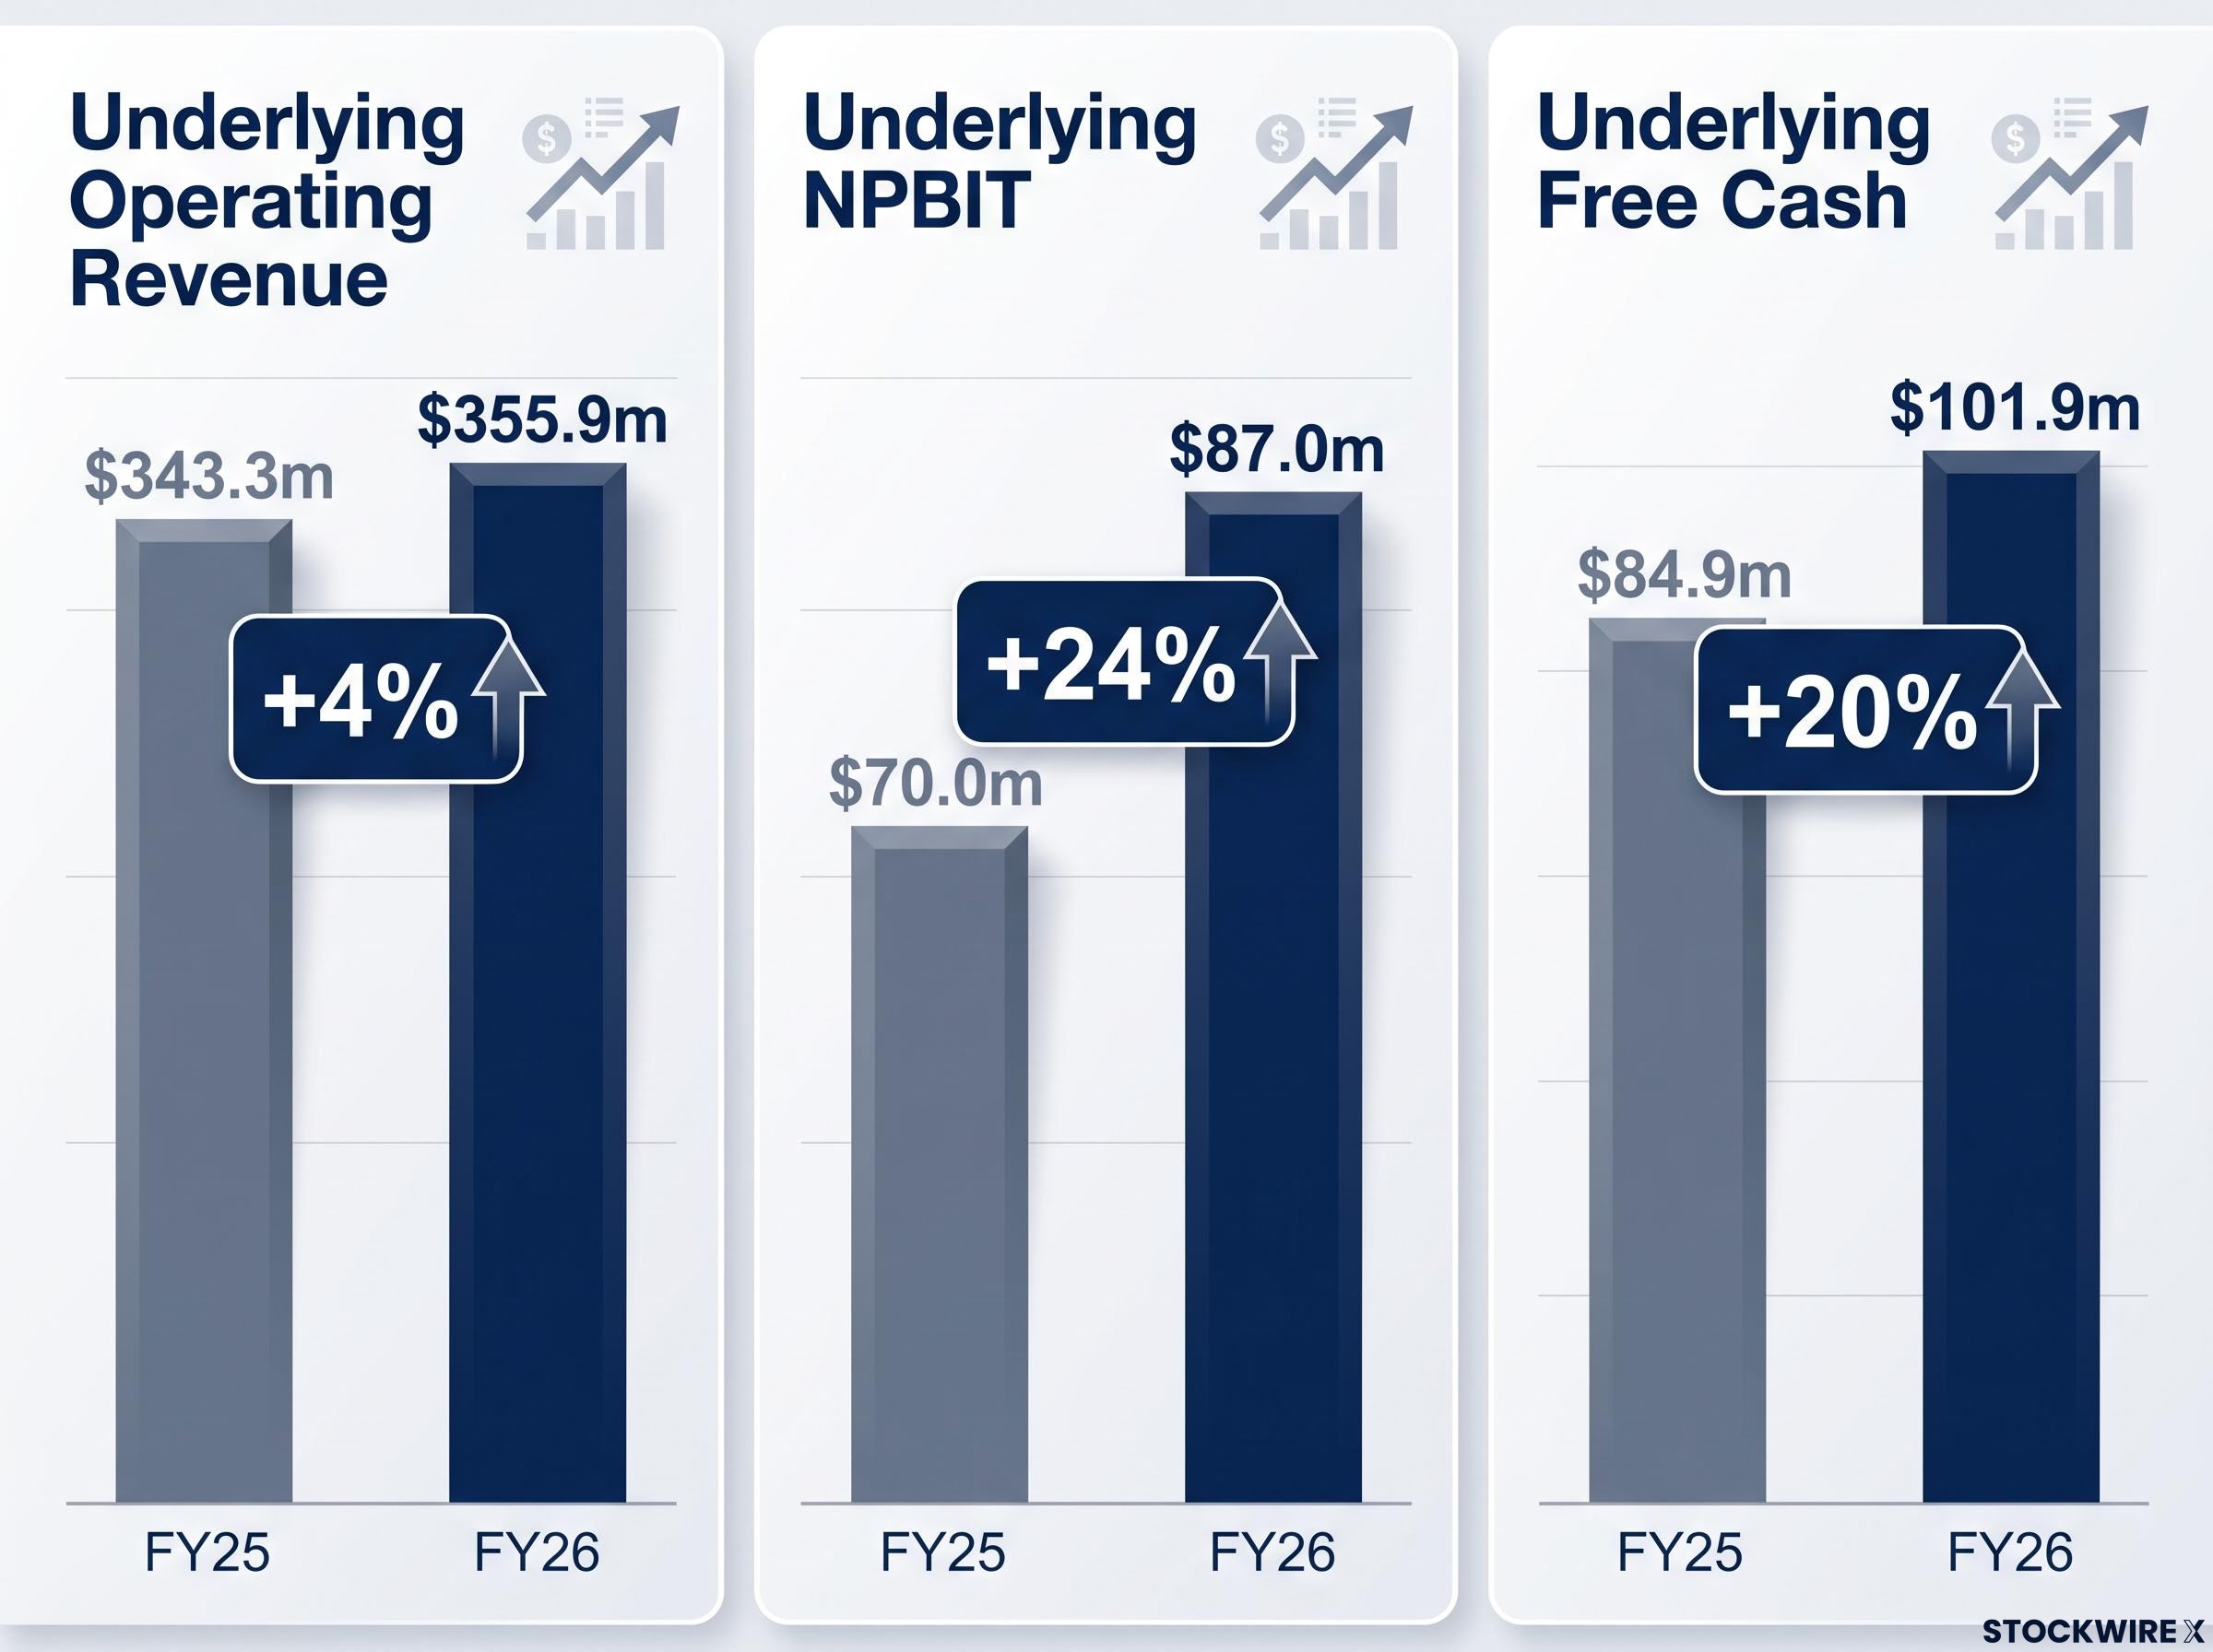
The serviced-office operator recorded Underlying NPBIT of $87.0m, up 24% on the prior corresponding period (pcp) and a record for the Group, exceeding revised guidance of $80.0m to $84.0m. Underlying Free Cash reached $101.9m (up 20%), beating revised guidance of at least $100.0m.
Underlying operating revenue rose 4% to $355.9m, while statutory NPAT climbed 24% to $65.6m and statutory NPBT lifted 29% to $80.9m.
Management framed the year around a theme of “a clear strategy, disciplined execution, sustainable growth,” underscoring how revenue gains are increasingly converting to profit and cash through operating leverage on a largely fixed cost base.
When big ASX news breaks, our subscribers know first
FY26 result headlines: earnings and cash outpace revenue
The defining feature of FY26 was the divergence between modest revenue growth and substantially stronger profit and cash generation. While underlying revenue rose a measured 4%, earnings and cash grew several times faster.
| Metric | FY26 | FY25 (pcp) | Change | Why it matters |
|---|---|---|---|---|
| Underlying NPBIT | $87.0m | $70.0m | +24% | Record; operating leverage |
| Underlying Free Cash | $101.9m | $84.9m | +20% | 117% of Underlying NPBIT |
| Underlying Operating Revenue | $355.9m | $343.3m | +4% | Pricing-led growth |
| Underlying EPS | 78.6c | 63.9c | +23% | Shareholder value |
| DPS | 32.0c | 28.0c | +14% | Rising returns |
The presentation noted a five-year Underlying NPBIT compound annual growth rate (CAGR) of 24%, alongside an improvement in return on net funds employed (ROFE) to 81%, up from 75% in FY25.
Supporting milestones from the year included:
-
6 new operations opened in FY26, with 6 more in the FY27 pipeline
-
Unencumbered cash at historically high levels of $152.4m, with no external gearing
-
A robust net cash position, with $137.8m cash on the balance sheet
What drives Servcorp’s operating leverage
Operating leverage is the reason a serviced-office business with a largely fixed cost base can grow profit and cash much faster than revenue. Once a floor is leased, fitted out and staffed, most of its costs are set. Additional revenue, whether from higher pricing or greater utilisation, then flows through to profit with little added expense.
Servcorp distinguishes between “mature” and “pre-mature” floors. New floors take time to reach profitability, so underlying and mature metrics strip these out to reveal the core earnings engine.
This structure explains why measured revenue growth of 4% converted into a 24% rise in underlying earnings and a 20% increase in cash during FY26. For investors, it means a differentiated proposition that supports pricing, retention and utilisation, allowing incremental revenue to translate into stronger earnings and cash generation.
Regional performance: Europe & Middle East leads the charge
Across the four operating segments, Europe & Middle East stood out as the primary growth engine, while the other regions each played distinct roles in the result.
| Segment | Mature Revenue FY26 | Mature Segment Profit FY26 | Mature Cash Earnings FY26 | Commentary |
|---|---|---|---|---|
| ANZ & SEA | $76.8m | $15.2m | $20.9m | Stable base; ~140% cash conversion |
| North Asia | $88.2m | $15.7m | $20.4m | Profit up despite weak JPY; +2% revenue constant-currency |
| Europe & Middle East | $163.0m | $50.0m | $55.6m | Standout growth engine |
| USA | $26.1m | $4.3m | $5.9m | Transitioning to sustainable profit |
| Total (operating) | $354.0m | $85.3m | $102.7m | — |
Europe & Middle East revenue rose strongly to $163.0m, supported by sustained demand and regional scale, with segment profit lifting to $50.0m. Management noted continued confidence in the region, while flagging an expected short-term negative impact across the Middle East due to the current geopolitical situation.
North Asia mature revenue declined to $88.2m, an outcome driven by a weaker Japanese Yen trading at decade-low levels rather than underlying demand. On a constant-currency basis, revenue was 2% higher, and profitability still improved, with segment profit rising to $15.7m.
The USA continued its transition from stabilisation toward a sustainable earnings contribution, with cash earnings reaching $5.9m as utilisation and operating control improved.
Balance sheet strength and cash generation
Servcorp ended FY26 with $152.4m in unencumbered cash, up $8.6m from June 2025, and no external gearing. Underlying Free Cash of $101.9m represented 117% of Underlying NPBIT, reflecting the high quality of cash conversion.
Net assets stood at $255.0m, with NTA per share rising to $2.38 from $2.17. The current ratio held at 1.6, with a net surplus in current assets of $79.0m.
The presentation framed this position as self-funding, with both ongoing operations and organic expansion financed internally.
Global expansion and technology investment
The Group’s platform now spans 137 floors across 38 cities and 19 countries, serving more than 56,000 members and drawing on over 45 years of experience. During FY26, 6 operations were opened or expanded and 4 were closed, with capital resources from closed floors redeployed to more prestigious locations opened in the same year.
At least 6 new floors are scheduled to commence in FY27, including a flagship property acquired late in FY26 at 333 Sussex St, Sydney, currently under renovation.
On technology, Servcorp continued to deepen its Servcorp Smart Office® ecosystem, its integrated proprietary platform. The Servcorp AI Concierge, an agentic assistant within the Servcorp App, acts on a client’s behalf to book facilities and manage reservations, while internally an AI agent now resolves IT Helpdesk requests directly. A new AI Assistant and the next generation of Servcorp Home are planned for the coming year. Management described this ecosystem as a capability set that is difficult to replicate, supporting margin and client retention.
Dividend lifted 14% and FY27 guidance signals continued growth
Servcorp increased shareholder returns for the year while providing measured forward guidance. Dividend details included:
-
Final dividend of 16.0 cps, 10% franked, payable 7 October 2026
-
Total FY26 dividend of 32.0 cps, up 14% on FY25
-
FY27 dividend not expected to be below 34.0 cps
-
A 147% three-year total shareholder return (TSR)
On the FY27 outlook
“FY27 is a year of consolidation. In a mixed global environment, management will prioritise performance improvement across the existing portfolio, with a focus on occupancy, pricing discipline and service revenue, as recently opened floors mature and operating leverage is realised against a largely fixed cost base.”
The presentation set out the following FY27 guidance, subject to no material deterioration in global economic conditions:
-
Underlying NPBIT of $85.0m to $90.0m
-
Underlying Free Cash of no less than $105.0m
-
Dividend not below 34.0 cps
Why FY26 matters for the investment case
FY26 delivered record underlying earnings that beat upgraded guidance, backed by high-quality cash conversion at 117% of Underlying NPBIT. The self-funded model, with no external gearing and $152.4m in unencumbered cash, allowed the Group to finance both operations and organic expansion internally.
A differentiated and, in management’s words, difficult-to-replicate global platform underpins the pricing power and operating leverage evident in the result, while rising dividends signal growing returns to shareholders.
Management framed FY27 as a year of consolidation, prioritising occupancy, pricing discipline and service revenue as recently opened floors mature. Positioned as a foundation-building phase, the guidance points to continued, measured growth rather than a slowdown.
Don’t Miss the Next ASX Real Estate Winner
Big News Blast delivers FREE breaking ASX announcements to your inbox within minutes of release, complete with in-depth analysis already done. Join 20,000+ subscribers who stay ahead of the market the moment news breaks. Click the “Free Alerts” button at StockWire X to start receiving alerts today.