

Vicinity Centres delivers record leasing spread and 7.7% NTA uplift in FY26 results
In its FY26 annual results presentation dated 20 August 2026, Vicinity Centres reported statutory net profit after tax of $1,391.2m (FY25: $1,004.6m) and Funds From Operations (FFO) of $700.1m (FY25: $673.8m) for the full year. Management framed the result as the payoff of a multi-year portfolio repositioning towards premium assets.
FFO per security rose 2.8% to 15.21 cps, with an annual distribution of 12.40 cps, up 3.3%. Net tangible assets (NTA) increased 19 cents, or 7.7%, to $2.59 across the year.
CEO and Managing Director Peter Huddle and Chief Financial Officer Adrian Chye presented the results, noting that both FFO and AFFO per security landed at the top end of the guidance range.
When big ASX news breaks, our subscribers know first
FY26 highlights at a glance
The headline metrics summarised below reflect the full-year performance reported by management.
| Metric | FY26 | FY25 | Change |
|---|---|---|---|
| Statutory NPAT | $1,391.2m | $1,004.6m | +38.5% |
| FFO | $700.1m | $673.8m | +3.9% |
| FFO per security | 15.21 cps | 14.79 cps | +2.8% |
| Distribution | 12.40 cps | 12.00 cps | +3.3% |
| Comparable NPI growth | +4.2% | +3.7% | — |
| Occupancy | 99.6% | 99.5% | — |
| Leasing spread | +4.2% | +2.5% | — |
| NTA per security | $2.59 | $2.40 | +7.7% |
The presentation also outlined the year’s strategic transaction activity:
-
Invested $563m acquiring DFO Eastern Creek ($351m) and the remaining 75% of Uptown ($212m)
-
Divested non-strategic assets for $327.2m at an 18.2% premium to book ($447.2m including Taigum Square)
-
Completed the Chatswood Chase redevelopment
-
Gearing of 26.1%, at the lower end of the target range
Portfolio metrics hit record highs on premium repositioning
Management attributed the strength of the result to operational execution across a repositioned portfolio, supported by resilient sector fundamentals.
Leasing and occupancy strength
The company reported its highest annual leasing spread since inception at +4.2% (FY25: +2.5%), with occupancy of 99.6%, equating to an average of less than one vacancy per centre. Income on holdover reduced to 1.5% (FY25: 2.1%).
Average lease tenure on completed deals strengthened to 4.6 years, while annual rent escalators were maintained at +4.8% p.a. The specialty occupancy cost ratio of 14.4% remains below the pre-COVID level of around 15%, described by management as sustainable and supportive of future rental growth.
Premium portfolio driving superior growth
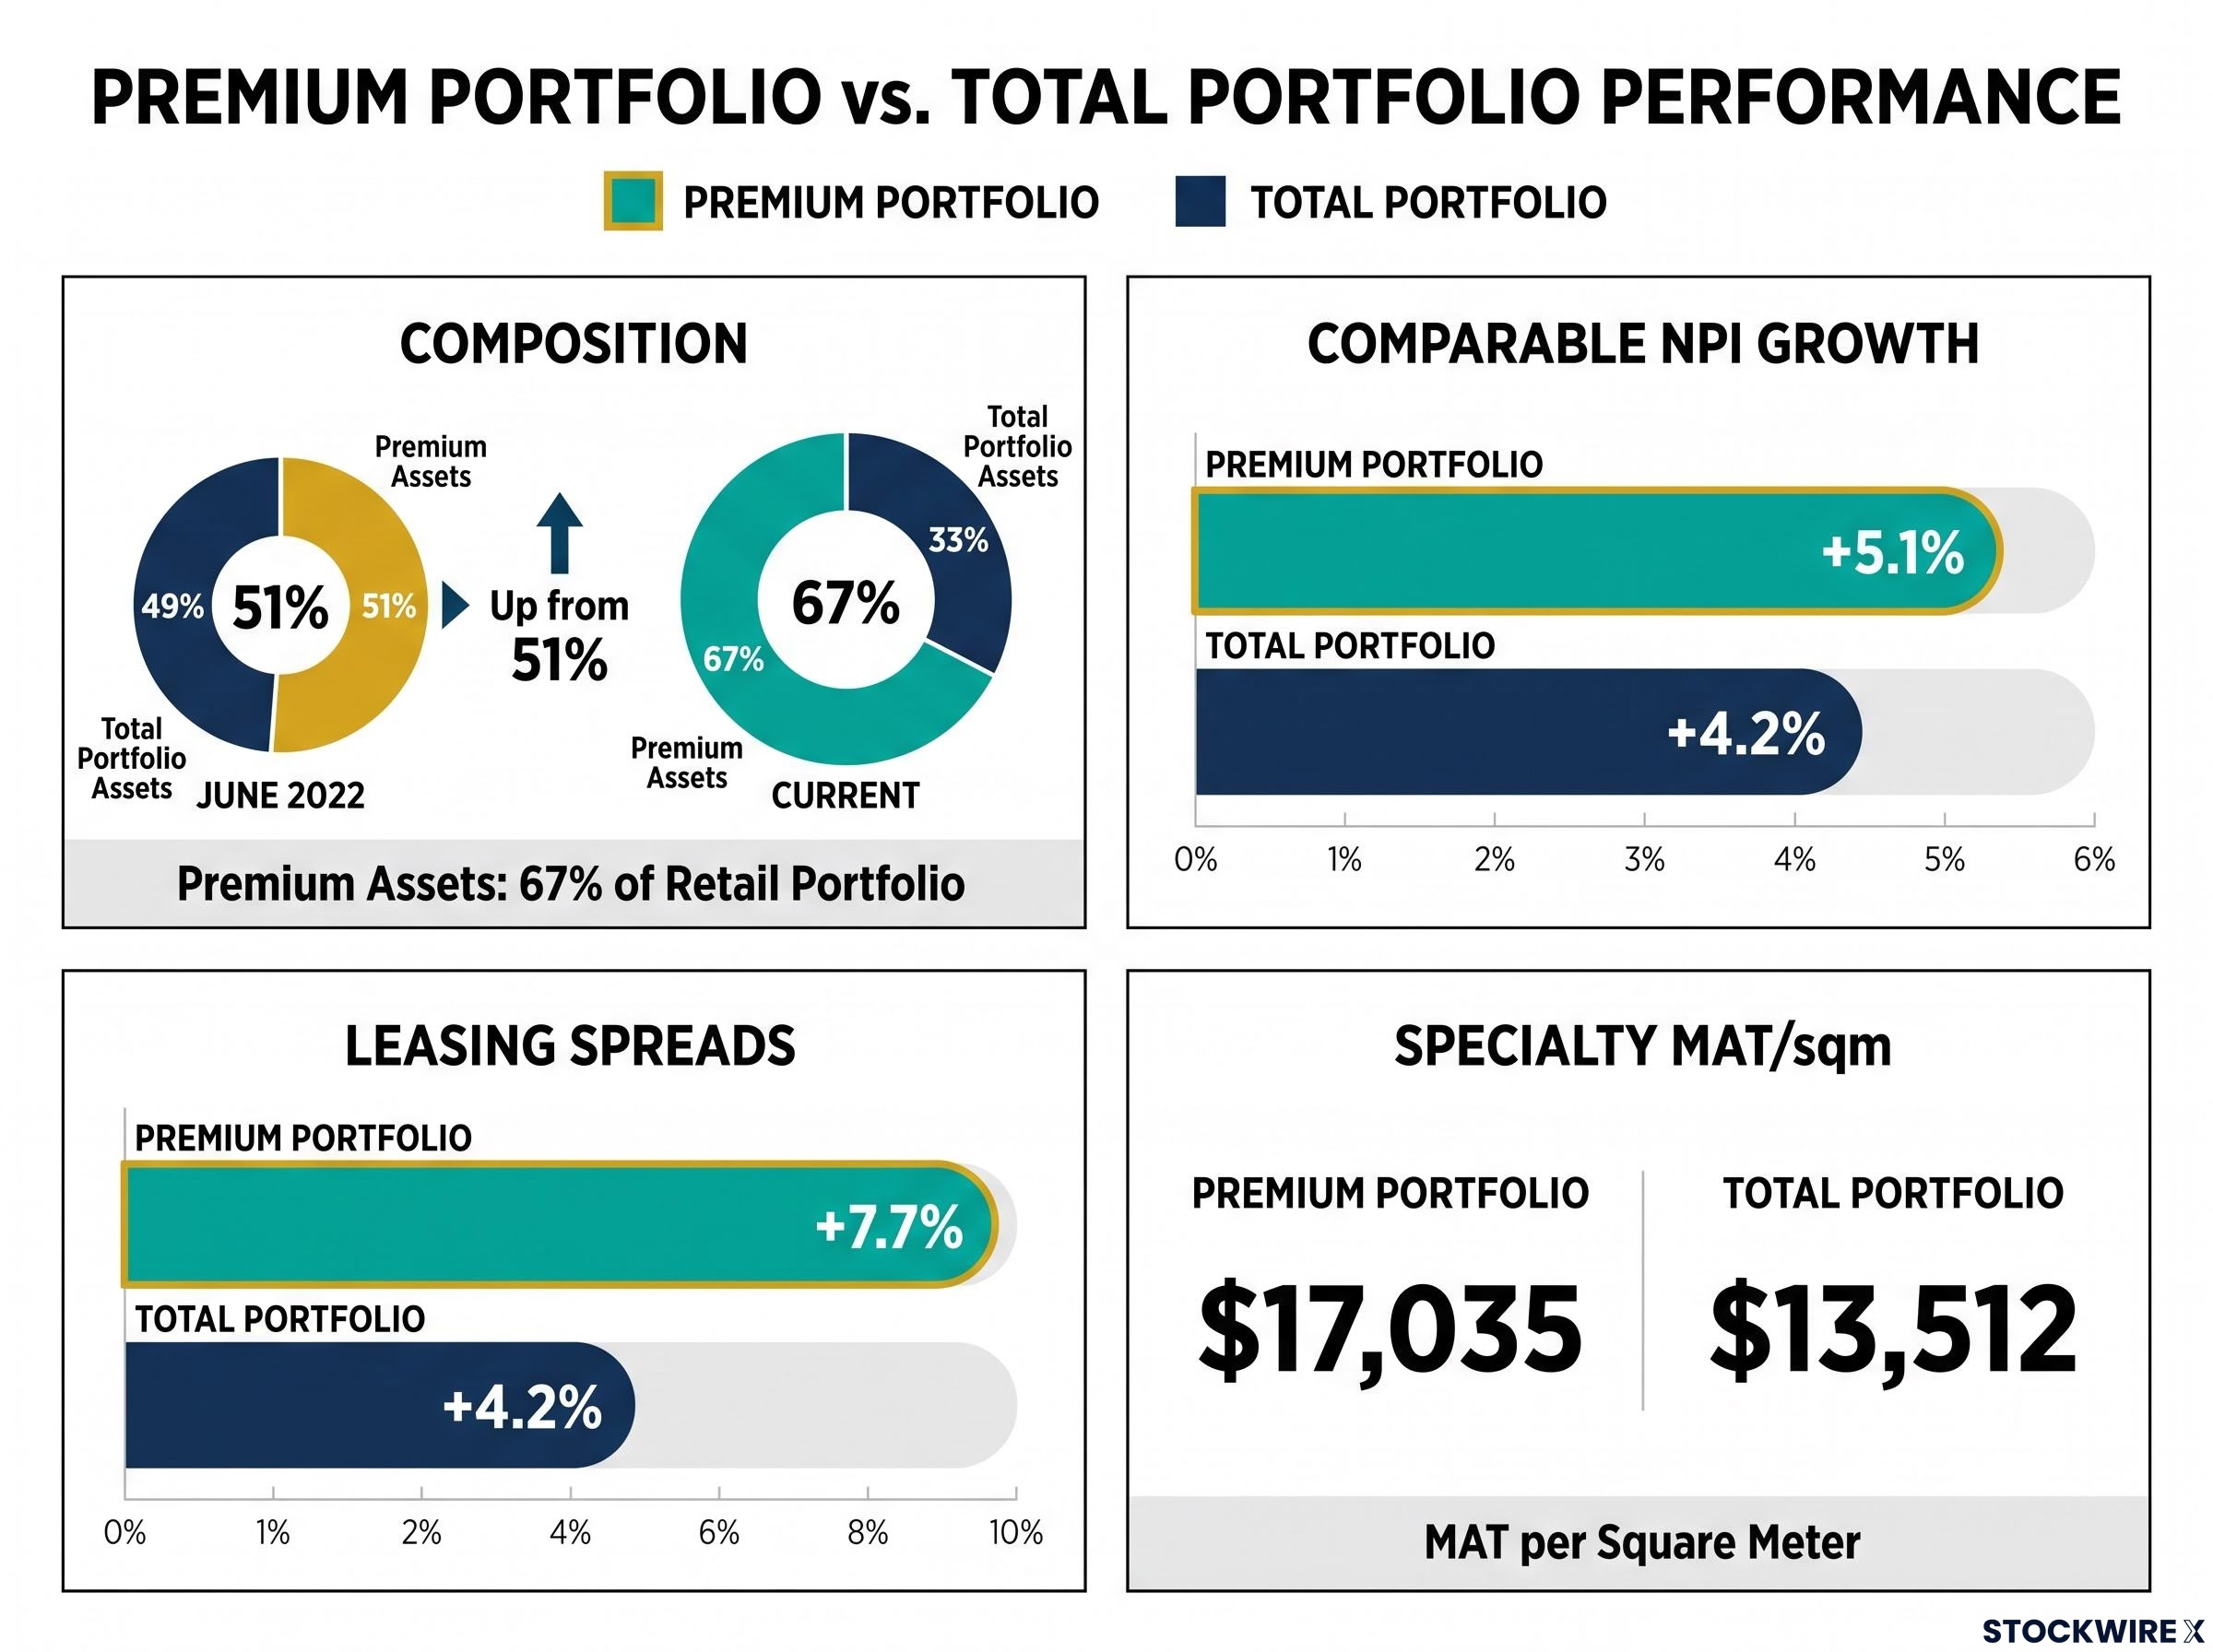
Premium assets now comprise 67% of the retail portfolio, up from 51% in June 2022. This segment delivered measurably stronger performance across key metrics.
-
Premium comparable NPI growth of +5.1% versus total portfolio +4.2%
-
Premium leasing spreads of +7.7% versus total portfolio +4.2%
-
Premium specialty MAT/sqm of $17,035 versus total portfolio $13,512
Since June 2022, average asset value has increased 41% to $554m.
Retail sales trends
Total portfolio retail sales grew +3.3% for FY26, while specialties and mini majors rose +4.0%. Mini majors stood out as a standout category at +4.6%, with resilient growth also recorded in jewellery (+7.8%), leisure (+6.8%) and homewares (+6.1%).
For balance, department stores recorded softer performance, with moving annual turnover (MAT) down 1.3%.
What “premium repositioning” means for investors
A real estate investment trust (REIT) like Vicinity owns and manages shopping centres, earning rental income known as Net Property Income (NPI) that funds distributions to security holders. Because statutory profit swings with property revaluations, REITs typically report Funds From Operations (FFO), a cash-earnings measure that strips out those non-cash movements.
“Capital recycling” refers to selling lower-growth, non-strategic assets and reinvesting the proceeds into higher-quality premium assets such as CBD centres, outlets and Chadstone. A leasing spread measures the percentage uplift in rent on new or renewed leases compared with the prior lease; a positive spread signals pricing power and retailer demand.
Gearing (debt relative to assets) indicates balance-sheet risk, while NTA reflects the underlying asset value backing each security. A record leasing spread, rising NTA and top-of-guidance FFO together suggest the repositioning strategy is translating into measurable results.
Capital recycling and a strengthened balance sheet
The portfolio recorded a net valuation increase of $293m (+1.8%) in the second half to $16.1b, contributing to a full-year valuation gain of $700m. Gearing ended the year at 26.1% (proforma 26.5%), at the lower end of the target range.
On capital management, the company raised $732m via 10-year debt capital market transactions and extended or repriced $1.2b of bank facilities. Weighted average drawn debt maturity extended from 3.8 years to 5.1 years.
Key debt metrics reported at period end included a weighted average cost of debt of 4.98% and interest cover of 4.1x. Vicinity maintained credit ratings of A/stable (S&P) and A2/stable (Moody’s).
The DFO Eastern Creek acquisition was detailed as follows:
The Eastern Creek Quarter acquisition was structured without an equity raise, funded entirely from existing debt facilities, with gearing expected to increase by approximately 200 basis points at the time of announcement before the subsequent asset divestments partially offset that impact.
-
Acquired for $351m at a 6.0% capitalisation rate, settled 30 June 2026
-
Comprises 10,000 sqm of traditional and 20,000 sqm of outlet retail in Western Sydney’s growth corridor
-
Vicinity intends to on-sell the Eastern Creek large format retail (LFR) on a pass-through basis for $49 million, subject to landlord consent for ground lease assignment, expected to settle September 2026
-
An option for approximately 8,500 sqm of outlet expansion provides longer-term growth potential
Development pipeline sets up the next phase of growth
Management outlined a development pipeline positioned as the bridge to the next phase of earnings growth.
| Project | Status | Est. cost | Target / stabilised yield |
|---|---|---|---|
| Chatswood Chase | Completed | — | ~6.7% stabilised yield; >$250m est. development profit; ~$1.5b est. stabilised valuation |
| Galleria (Perth) | Opening Nov 2026 | ~$130m | ~6.25% yield; 98% of leases instructed |
| Chadstone (luxury + MECCA) | Construction | ~$60m | Opening from Christmas 2026 |
| Uptown (Brisbane) | Planned, works early 2027 | ~$350–400m | >6.0% yield; >10% IRR |
Additional projects noted in the presentation include Grand Plaza (Rebel Sport, targeted 4Q FY27), Castle Plaza (full-line Woolworths supermarket, targeted 3Q FY27), and mixed-use optionality at Chatswood Chase, where plans for 480 apartments are advancing with authority approval anticipated in CY2027.
FY27 guidance signals an earnings inflection point
Management provided FY27 earnings guidance, which it noted remains subject to unforeseen circumstances and material changes in operating conditions.
-
FFO of 16.0 – 16.2 cps
-
AFFO of 13.9 – 14.1 cps
-
FFO per security growth of 5.3 – 6.6%
-
Distribution payout of 95–100% of AFFO
The guidance rests on several stated assumptions:
-
Comparable NPI growth expected to be approximately 3.5% (FY26: 4.2%)
-
Development-related loss of rent reducing to approximately $18m (FY26: ~$27m)
-
Weighted average cost of debt expected to be maintained at approximately 5.0%
-
Investment capital expenditure of approximately $300m
Management characterised FY26 as showcasing the value of owning and operating a higher quality, differentiated asset portfolio, with FY27 marking a meaningful inflection point where portfolio repositioning translates to a step-up in earnings growth. The outlook was described as characterised by cautious confidence, mindful of geopolitical uncertainty and potential shifts in household financial conditions.
The FY27 FFO per security growth guidance of 5.3–6.6% represents an acceleration from FY26’s 2.8%, reflecting the anticipated earnings step-up management has positioned the portfolio to deliver.
Key dates for security holders
The presentation confirmed the following key dates:
-
20 August 2026 — FY26 results and final distribution announced
-
25 August 2026 — Ex-distribution date
-
26 August 2026 — Record date
-
27 August 2026 — Last date for DRP election
-
16 September 2026 — Distribution payment date
-
28 October 2026 — 2026 Annual General Meeting
-
17 February 2027 — FY27 interim results
With its portfolio repositioning largely complete, Vicinity has framed FY26 as the foundation for the anticipated FY27 earnings step-up, contingent on the sector fundamentals and operating conditions holding through the period.
Don’t Miss the Next ASX Real Estate Winner
Big News Blast delivers FREE breaking ASX announcements straight to your inbox within minutes of release, complete with in-depth analysis already done for you. Join 20,000+ investors who stay ahead of the market the moment news breaks. Click the “Free Alerts” button at StockWire X to get started today.