
APA delivers 8.3% EBITDA lift and lifts growth pipeline to $3.5bn in FY26 results
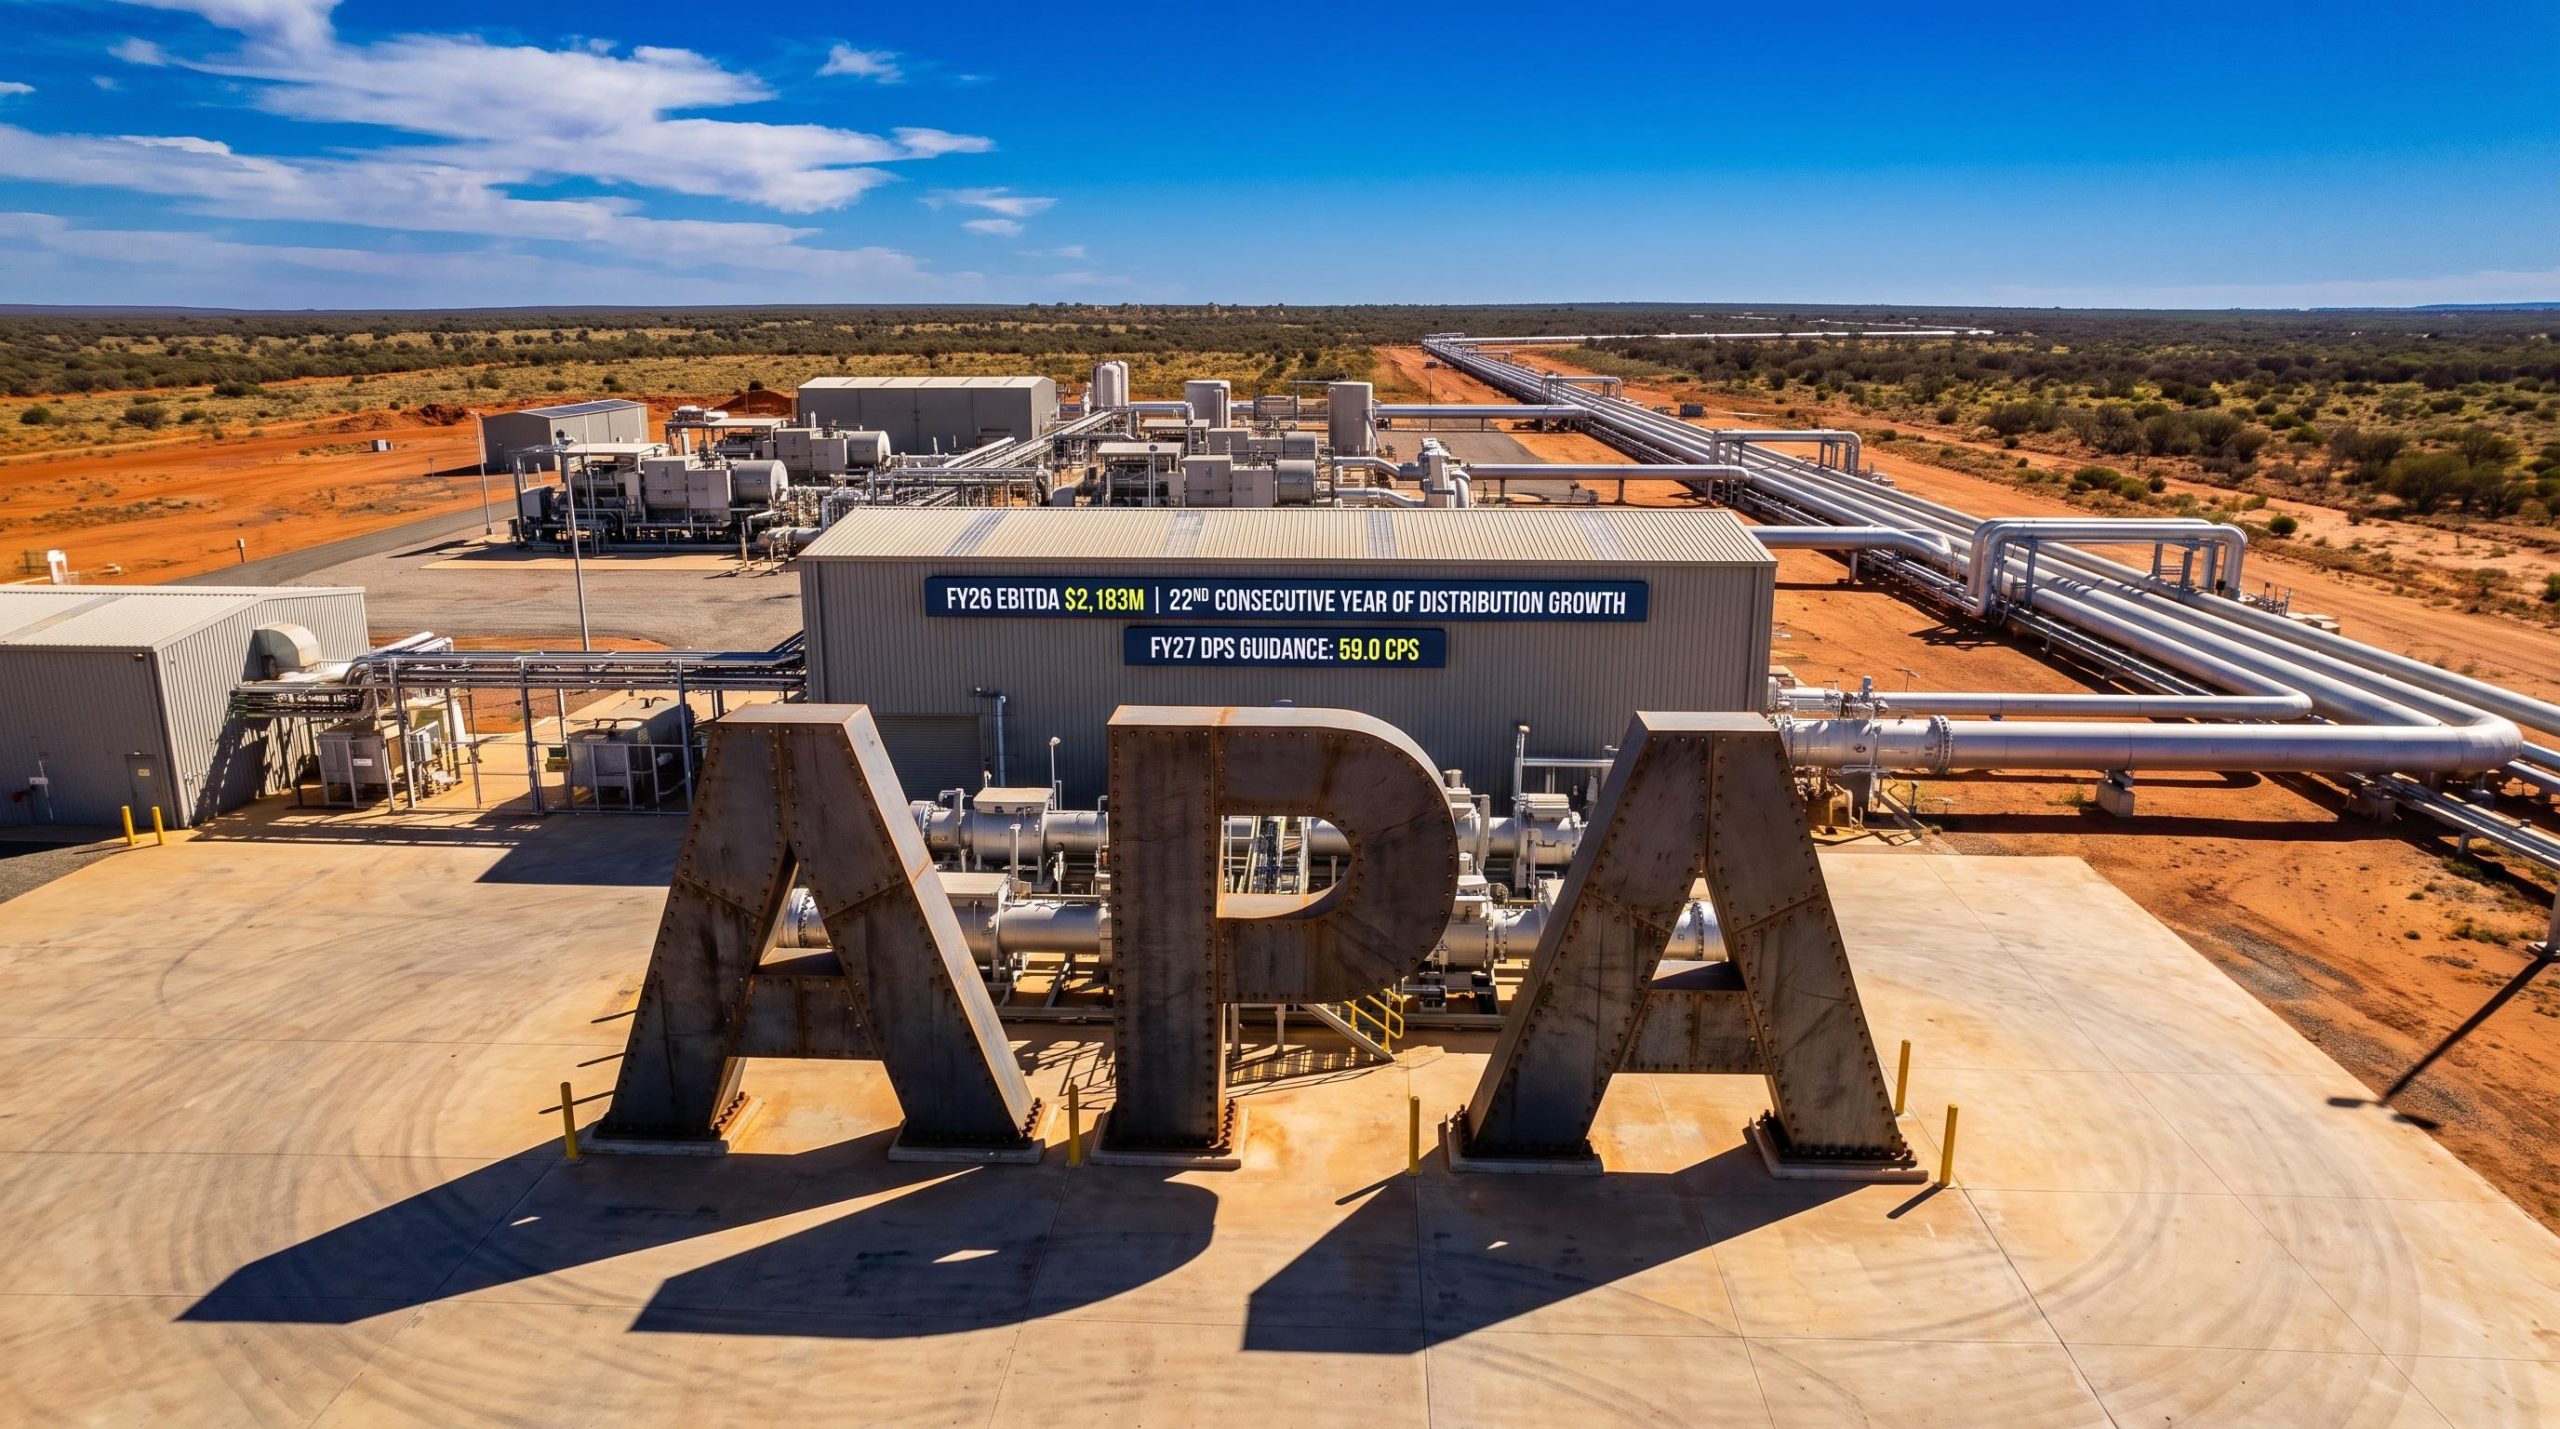
In its FY26 full-year results presentation, released on 20 August 2026 for the year ended 30 June 2026, APA Group reported underlying earnings before interest, tax, depreciation and amortisation (EBITDA) up 8.3% to $2,183m, with margins expanding 370bps to 77.9% and free cash flow rising 3.2% to $1,118m.
The energy infrastructure group also recorded its 22nd consecutive year of distribution growth, lifting distribution per security (DPS) to 58.0 cents. Looking forward, management increased the FY27-FY29 organic growth pipeline estimate to ~$3.5bn, up from ~$3.0bn previously.
The presentation framed the result around three pillars: disciplined financial performance, an expanding growth pipeline anchored in gas and power, and balance sheet capacity to fund that growth while sustaining distributions.
When big ASX news breaks, our subscribers know first
FY26 financial results at a glance
APA delivered earnings growth across its core metrics, with management attributing the outcome to robust asset performance and cost discipline. The completed FY26 result set is summarised below against the prior comparative period.
The FY26 outcome builds on momentum established at the 1H26 interim results, where EBITDA of $1,092 million was up 7.6% with margins expanding 280bps as cost reduction initiatives and new asset contributions began flowing through.
| Metric | FY26 | FY25 | % Change |
|---|---|---|---|
| Segment revenue | $2,803m | $2,716m | +3.2% |
| Underlying EBITDA | $2,183m | $2,015m | +8.3% |
| EBITDA margin | 77.9% | 74.2% | +370bps |
| Free Cash Flow | $1,118m | $1,083m | +3.2% |
| Distribution per security | 58.0c | 57.0c | +1.8% |
Management identified three primary drivers behind the EBITDA uplift:
- +$66m from inflation-linked tariff escalation
- +$70m contribution from new assets (Kurri Kurri lateral pipeline, Port Hedland Solar & Battery, and Atlas to Reedy Creek pipeline)
- +$80m from enterprise-wide cost reductions, which exceeded the $50m target
The company also reported a 20.6% reduction in corporate costs, while statutory net profit after tax (NPAT) rose 81.4% to $234m, reflecting underlying earnings growth partly offset by depreciation on newly commissioned assets.
Cost discipline and portfolio simplification underpin the result
Enterprise-wide cost reductions
APA delivered $80m in enterprise-wide cost reductions during FY26, ahead of its $50m target, and pointed to an annualised run-rate of $100m into FY27. These savings stemmed from operating model changes, headcount reductions, optimised maintenance scheduling, and a restructure of corporate functions.
Portfolio simplification supported the outcome, with the sale of the Networks business and APA’s interest in GDI generating combined proceeds of $101m in FY26. The 370bps margin expansion recorded during the period reflected robust asset performance and enterprise-wide cost reduction initiatives.
Understanding APA’s inflation-linked infrastructure model
APA owns and operates more than $20bn of energy infrastructure and delivers around half of Australia’s domestic gas through more than 15,000km of pipelines. Understanding why its earnings are defensive begins with how revenue is structured.
The business generates what the presentation describes as “contracted, capacity-based, inflation-linked revenues.” Approximately 86% of Energy Infrastructure revenue is take-or-pay or regulated. Around 84% of that revenue comes from investment grade counterparties.
The FY26 revenue mix breaks down as follows:
- Capacity charge revenue: 68%
- Regulated revenue: 15%
- Throughput and other variable revenue: 13%
- Contracted fixed revenue: 3%
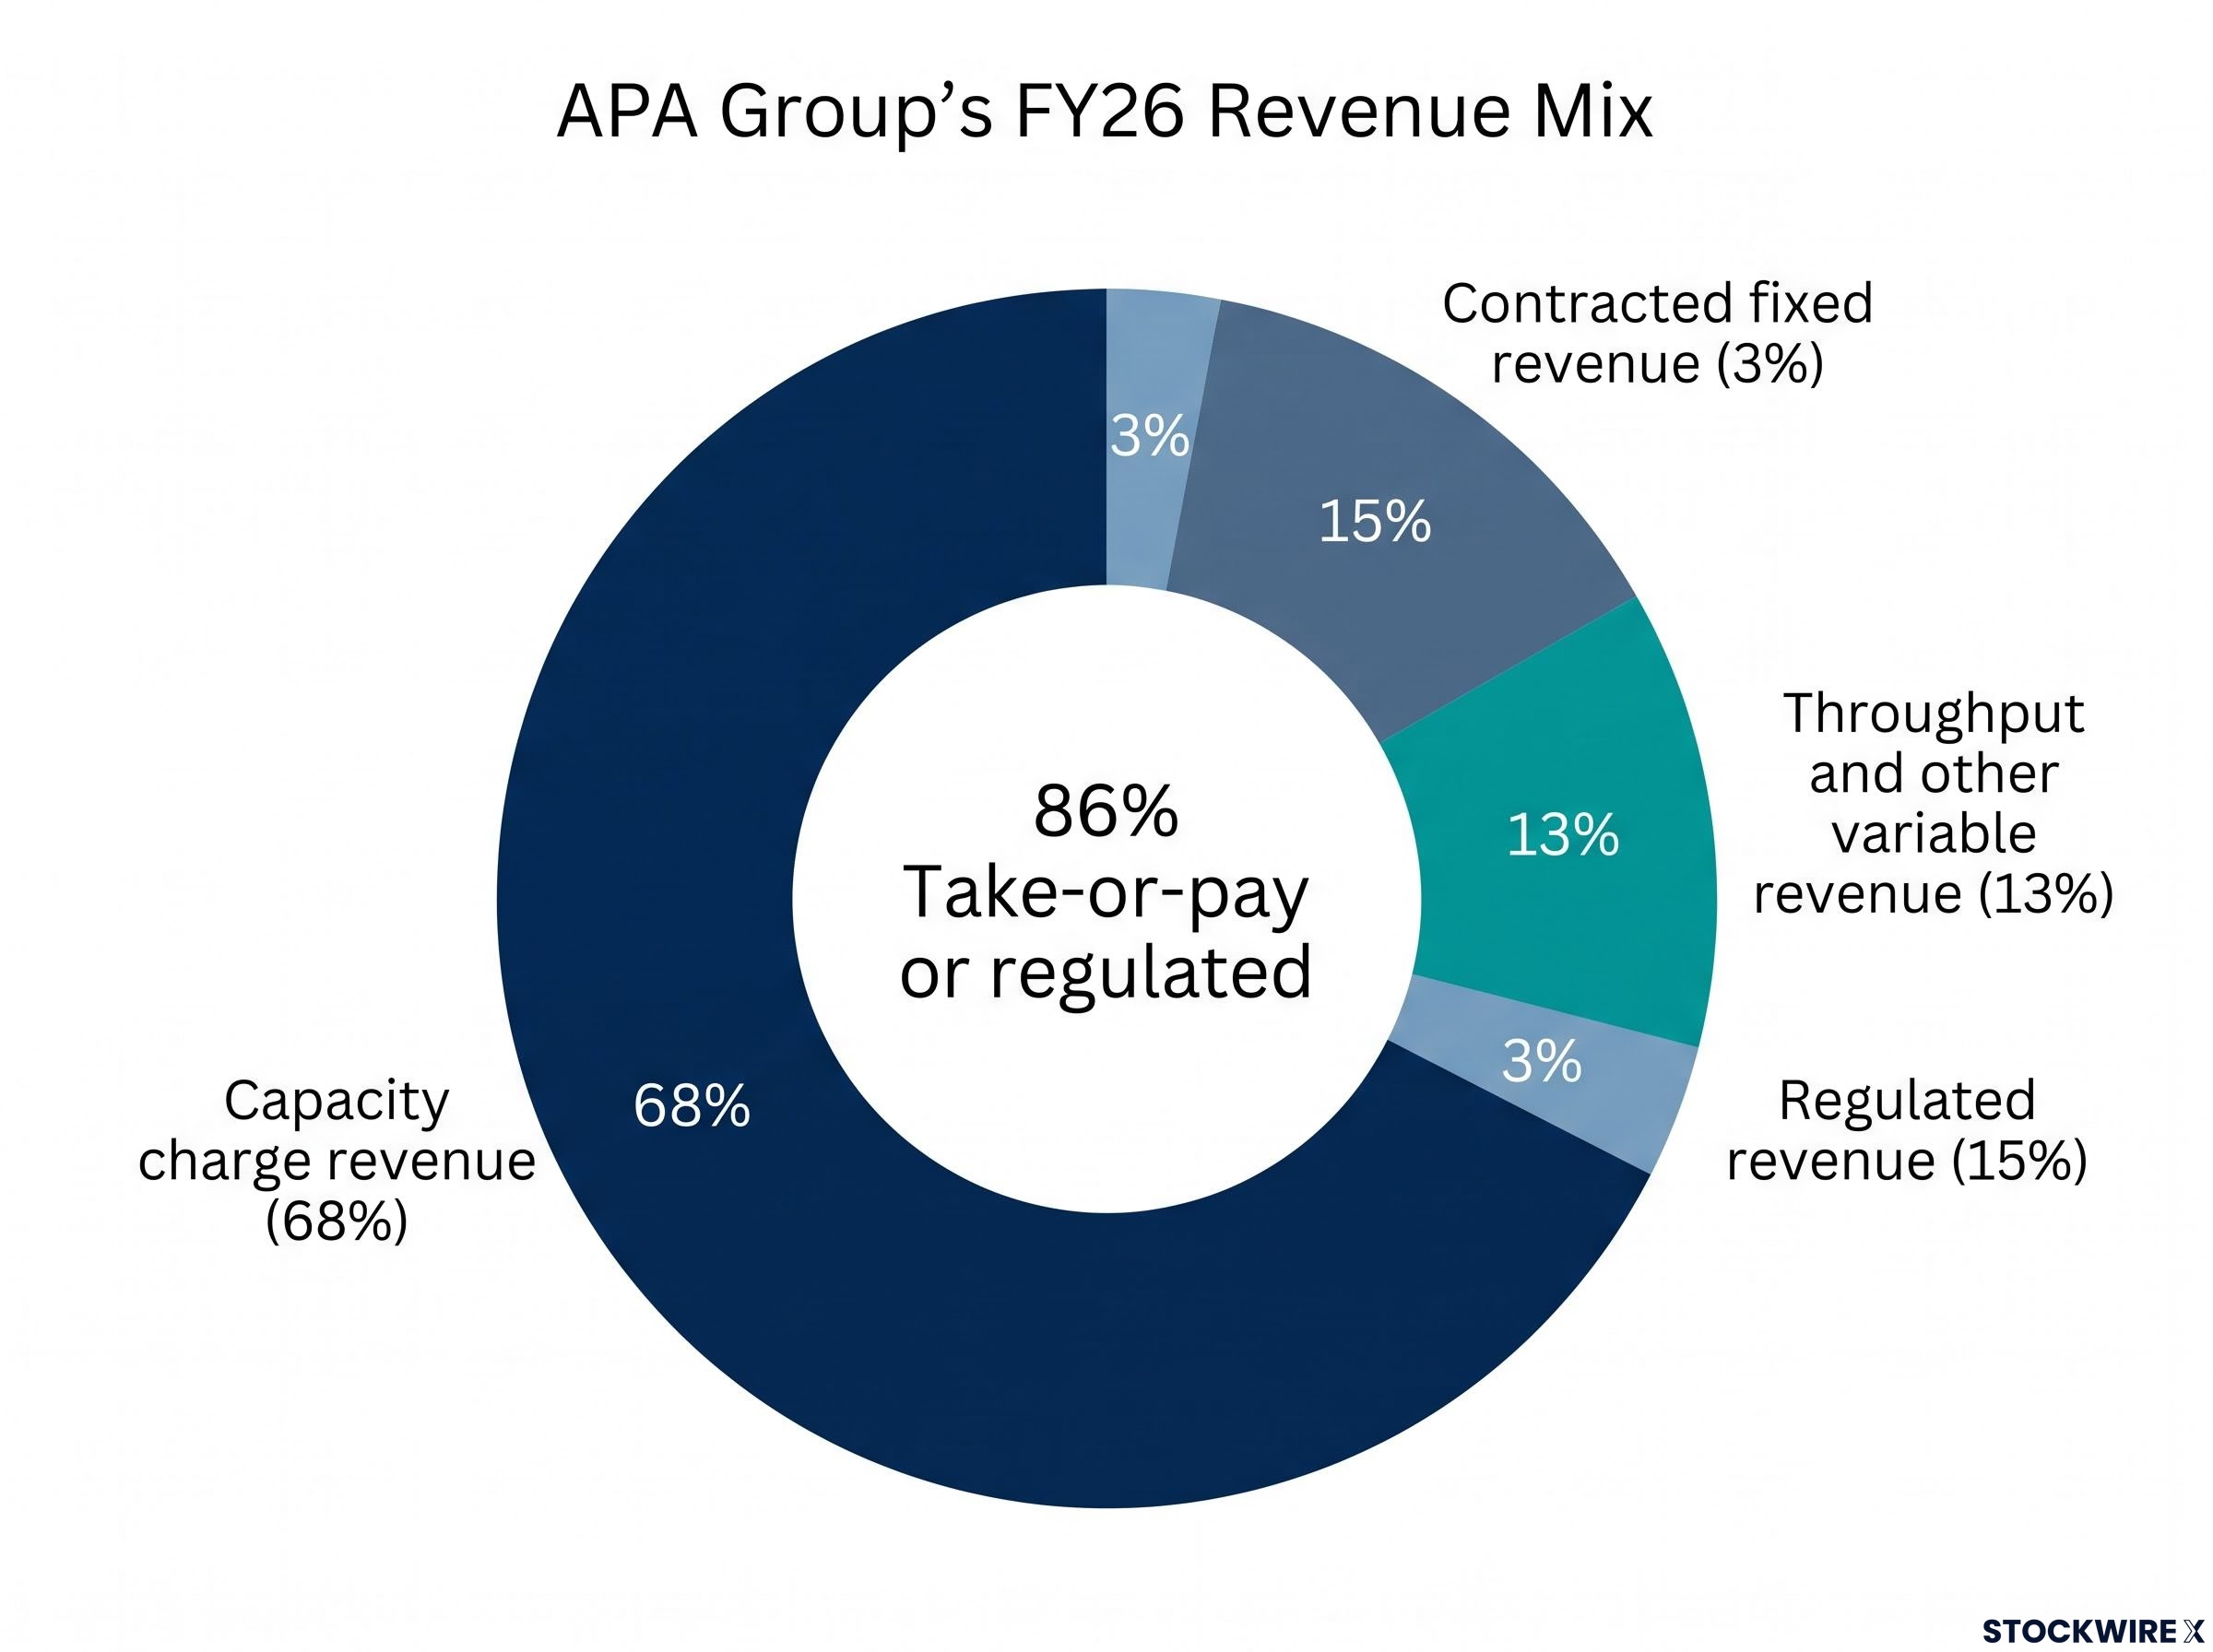
This structure is what supports consistent distribution growth and provides the earnings base to fund the growth pipeline. Take-or-pay contracts mean revenue is largely insulated from short-term demand fluctuations, while inflation linkage helps preserve real returns over time.
A $3.5bn growth pipeline anchored in gas and power
Management increased its FY27-FY29 organic growth pipeline estimate to ~$3.5bn. This figure reflects management’s current expectations based on project design and is subject to change up to final investment decision (FID) and definitive documentation, rather than committed capital.
Gas transmission expansion
Several gas projects underpin the pipeline. On the East Coast Gas Grid Stage 3 expansion, APA reported an FID on a $260m investment in three new compressors (Stage 3A), on track to deliver additional capacity from 2028.
For Stage 3B, the Bulloo Interlink Pipeline, $220m has been approved for early works and long-lead procurement, against a total project cost of ~$800m, with FID expected later in 2026. Separately, an AER-approved $213m South West Pipeline expansion is set to increase capacity into Victoria from 2029. Construction of the Sturt Plateau Pipeline is now complete, capable of delivering up to 40TJ/day of Beetaloo gas.
The East Coast Gas Grid expansion underpins the largest single tranche of capital in the pipeline, with Stage 3A and Stage 3B together representing more than $1bn of committed and approved-for-early-works spend targeting additional north-to-south capacity by winter 2028.
Contracted power generation, Brigalow
The presentation featured the proposed Brigalow Peaking Power Plant, a 400MW gas peaking power station in Queensland, as a case study. Under the arrangement, APA is to acquire an 80% interest, with CS Energy retaining 20% and operating the plant, including market dispatch.
APA plans to limit its exposure to wholesale electricity prices through a proposed 25-year inflation-linked hedge offtake agreement with CS Energy. Operations are targeted from calendar year 2028. Development of the project remains conditional and subject to necessary external and Government approvals, finalisation of development matters, and entry into full form documentation.
In its remote power pipeline, the Sybella Creek Solar Farm and Battery Energy Storage System at Mt Isa reached FID, supporting Evolution Mining’s Ernest Henry mine. The demand backdrop is significant: AEMO’s 2026 Integrated System Plan forecasts a requirement for 14GW of new-build gas-powered generation capacity on the National Electricity Market by 2050 as coal exits.
Balance sheet built to fund growth without straining distributions
APA outlined a funding position designed to support the pipeline while sustaining distributions and credit metrics. Key balance sheet indicators included:
- FFO/Net Debt of 11.2%, comfortably above the 8.5% threshold
- $1.5bn of debt raised in April 2026 ($1bn hybrid subordinated capital securities plus $500m senior 10-year notes)
- Liquidity of $3.1bn, with credit ratings of BBB/Baa2 maintained
Two ratings threshold modifications expanded APA’s debt capacity. In December 2025, S&P moved its BBB downside FFO/Net Debt threshold from 9.5% to 8.5%. In April 2026, Moody’s moved its Baa2 threshold from 8% to 7%. Together, these changes delivered approximately $1bn in additional debt capacity, recognising APA’s stable and predictable cash flows.
Management pointed to operating cash flow, existing balance sheet capacity, and the Distribution Reinvestment Plan (with a 1.5% discount) as funding sources, alongside a willingness to partner on growth, as demonstrated by the CS Energy arrangement on Brigalow.
FY27 guidance points to continued growth
Looking ahead, APA provided FY27 guidance, which management noted is subject to asset performance, macroeconomic factors and regulatory changes.
- FY27 Underlying EBITDA guidance of $2,260m–$2,340m (midpoint $2,300m, a 5.4% increase on FY26)
- FY27 DPS guidance of 59.0 cps, a 1 cent increase
- FY27 Free Cash Flow expected to grow broadly in line with inflation
Key assumptions include earnings contributions from new assets such as the Sturt Plateau Pipeline and the conversion of Basslink to a regulated asset, plus an additional $20m of cost reductions representing the full-year run-rate of FY26 initiatives.
From APA’s FY26 results presentation
APA’s presentation notes that approximately 90% of the business is leveraged to highly defensive and predictable inflation-linked revenues, and separately that FY26 represented the 22nd consecutive year of distribution growth.
What it means for investors
APA’s FY26 result reinforces a defensive earnings profile built on inflation-linked, capacity-based revenues, supported by a distribution track record now extending to 22 consecutive years and an attractive distribution yield of approximately 5.9%. The lifted ~$3.5bn growth pipeline, backed by expanded balance sheet capacity and improved ratings thresholds, provides a forward path management describes as funded by operating cash flow, balance sheet capacity and the DRP. FY27 guidance and pending final investment decisions, including the Bulloo Interlink Pipeline expected later in 2026, stand as the next catalysts to watch.
Don’t Miss the Next ASX Infrastructure Winner
Get FREE breaking ASX news and in-depth analysis delivered to your inbox within minutes of release. Join 20,000+ investors already staying ahead of the market with Big News Blast from StockWire X. Click the “Free Alerts” button to start receiving real-time coverage of ASX infrastructure, utilities, and beyond the moment announcements drop.